Log Explorer
Log Explorer is an interactive query tool for log-analytics scenarios. It lets you search, query, and aggregate logs directly from the console, with an experience similar to Kibana's Discover page but optimized for the depth and scale typical of log retrieval.
Open Log Explorer from the Work with data group in the left navigation.
Interface layout
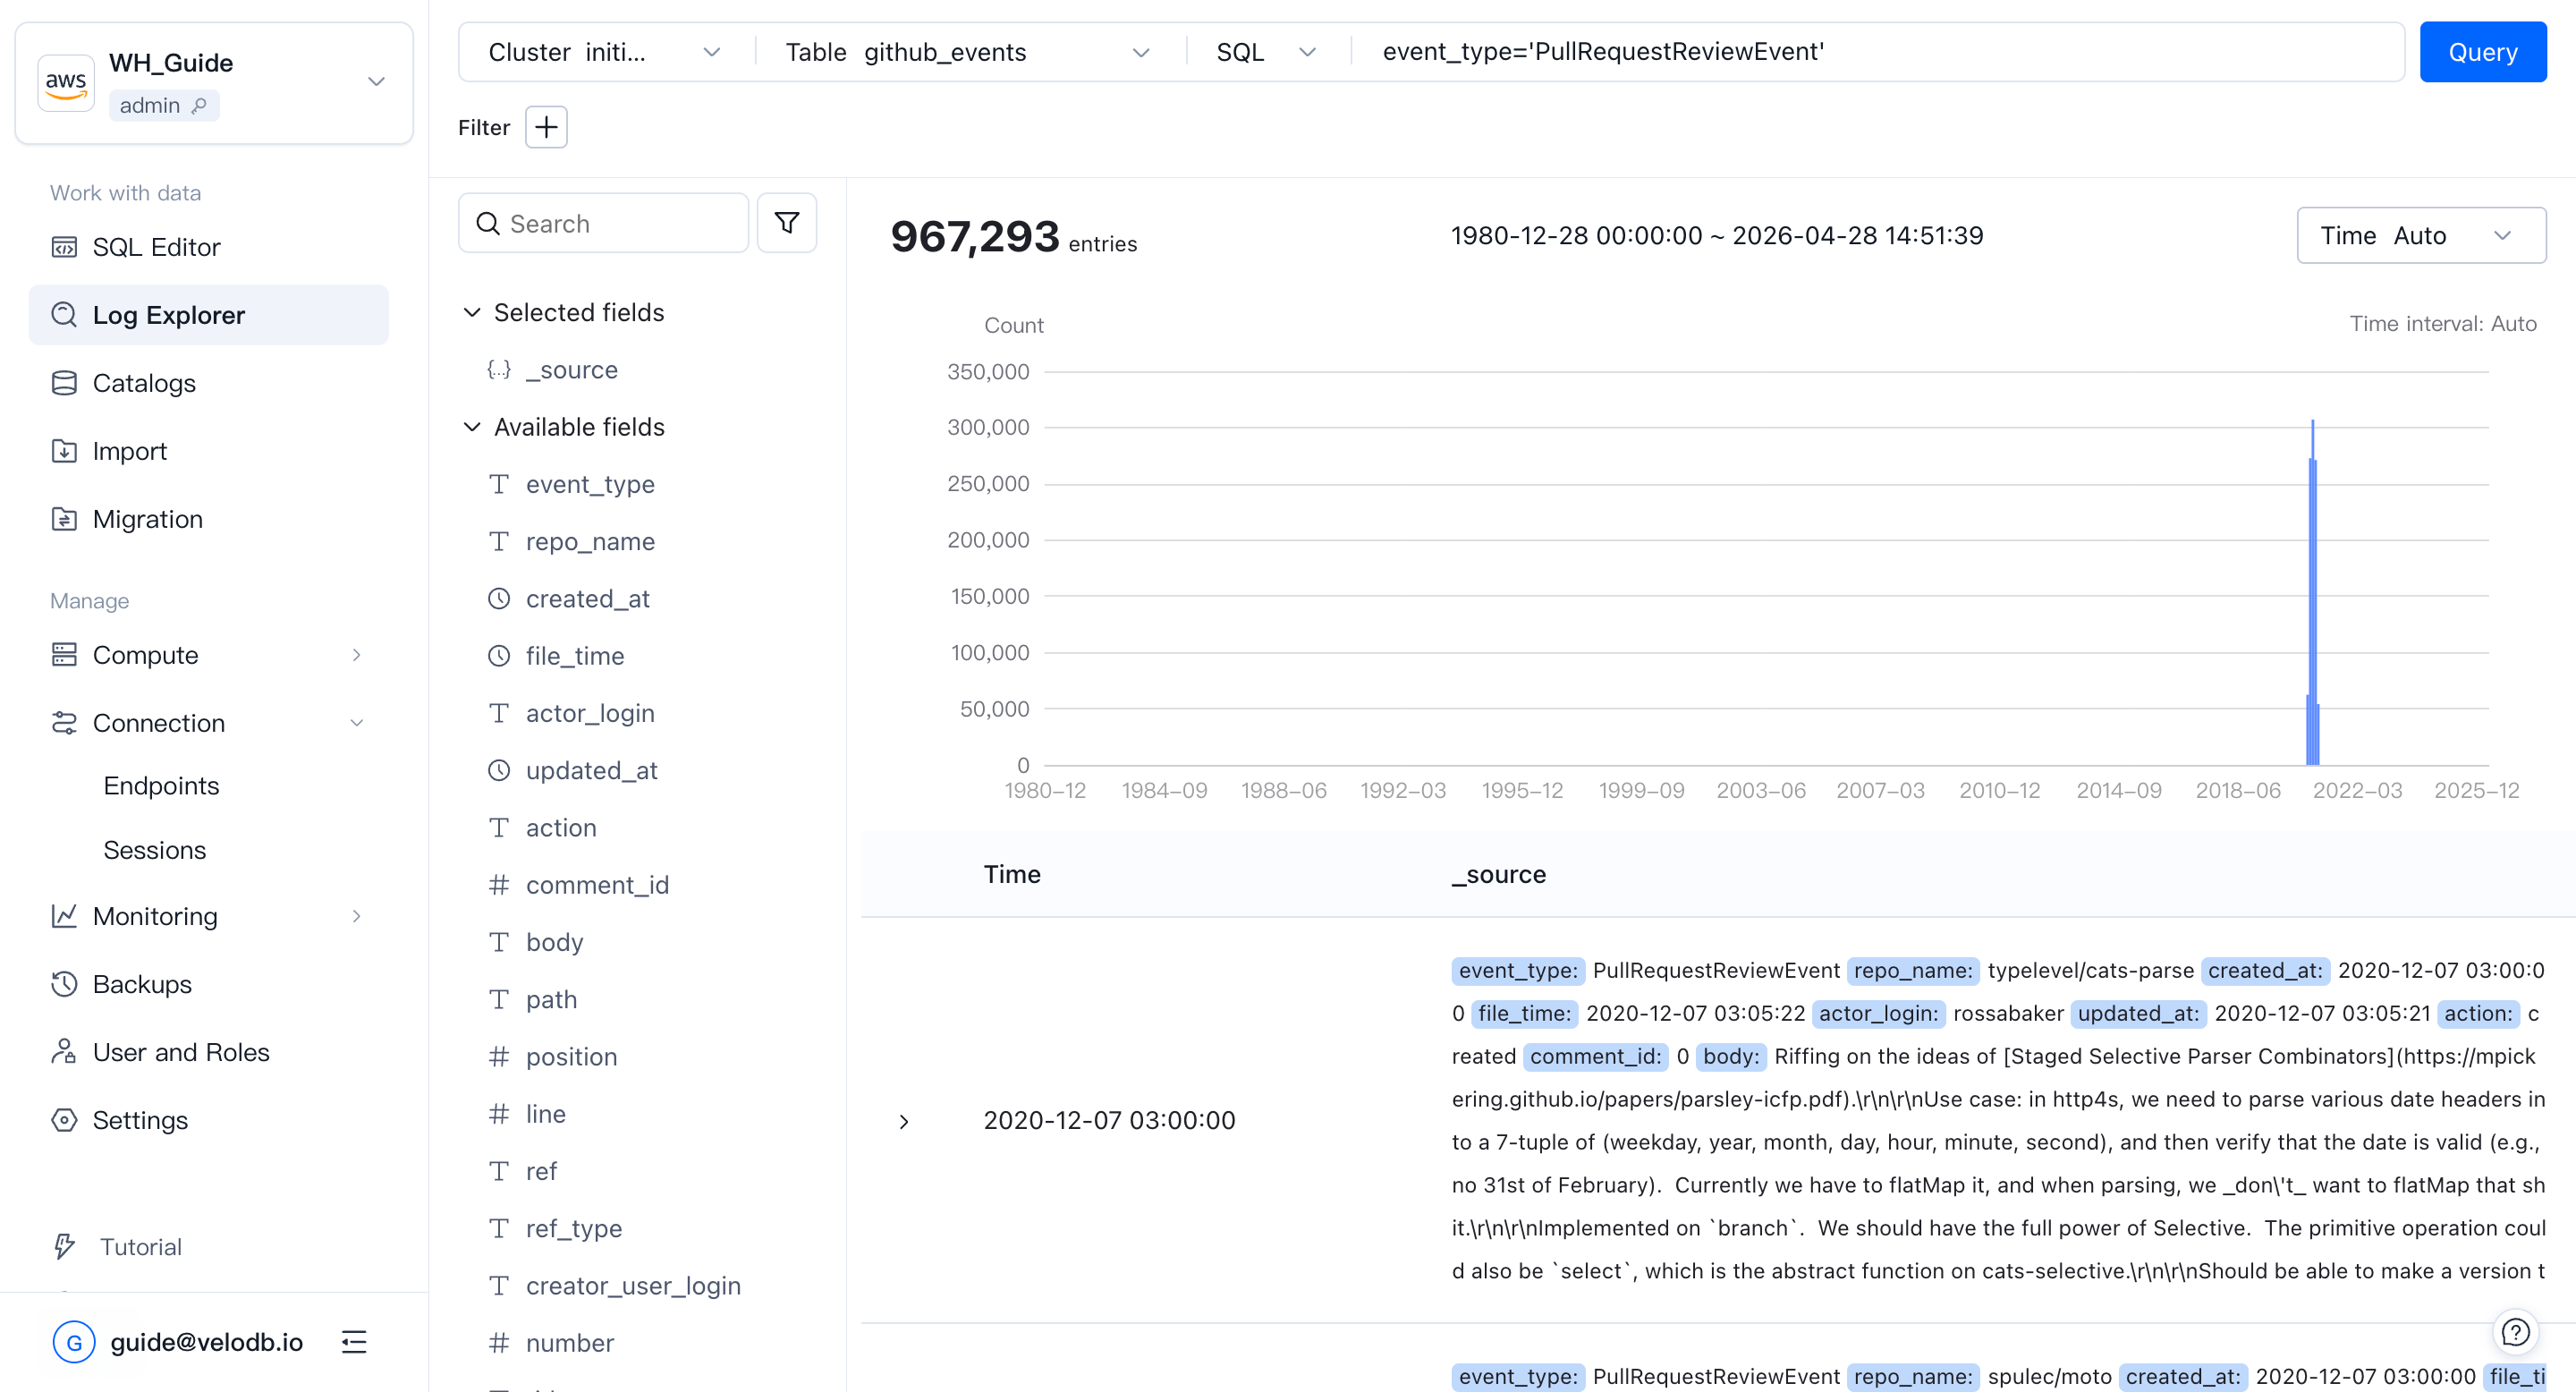
Log Explorer is divided into four areas:
- Top input area — pick the cluster, table, time field, and query time range. The main input box supports two modes: keyword search and SQL.
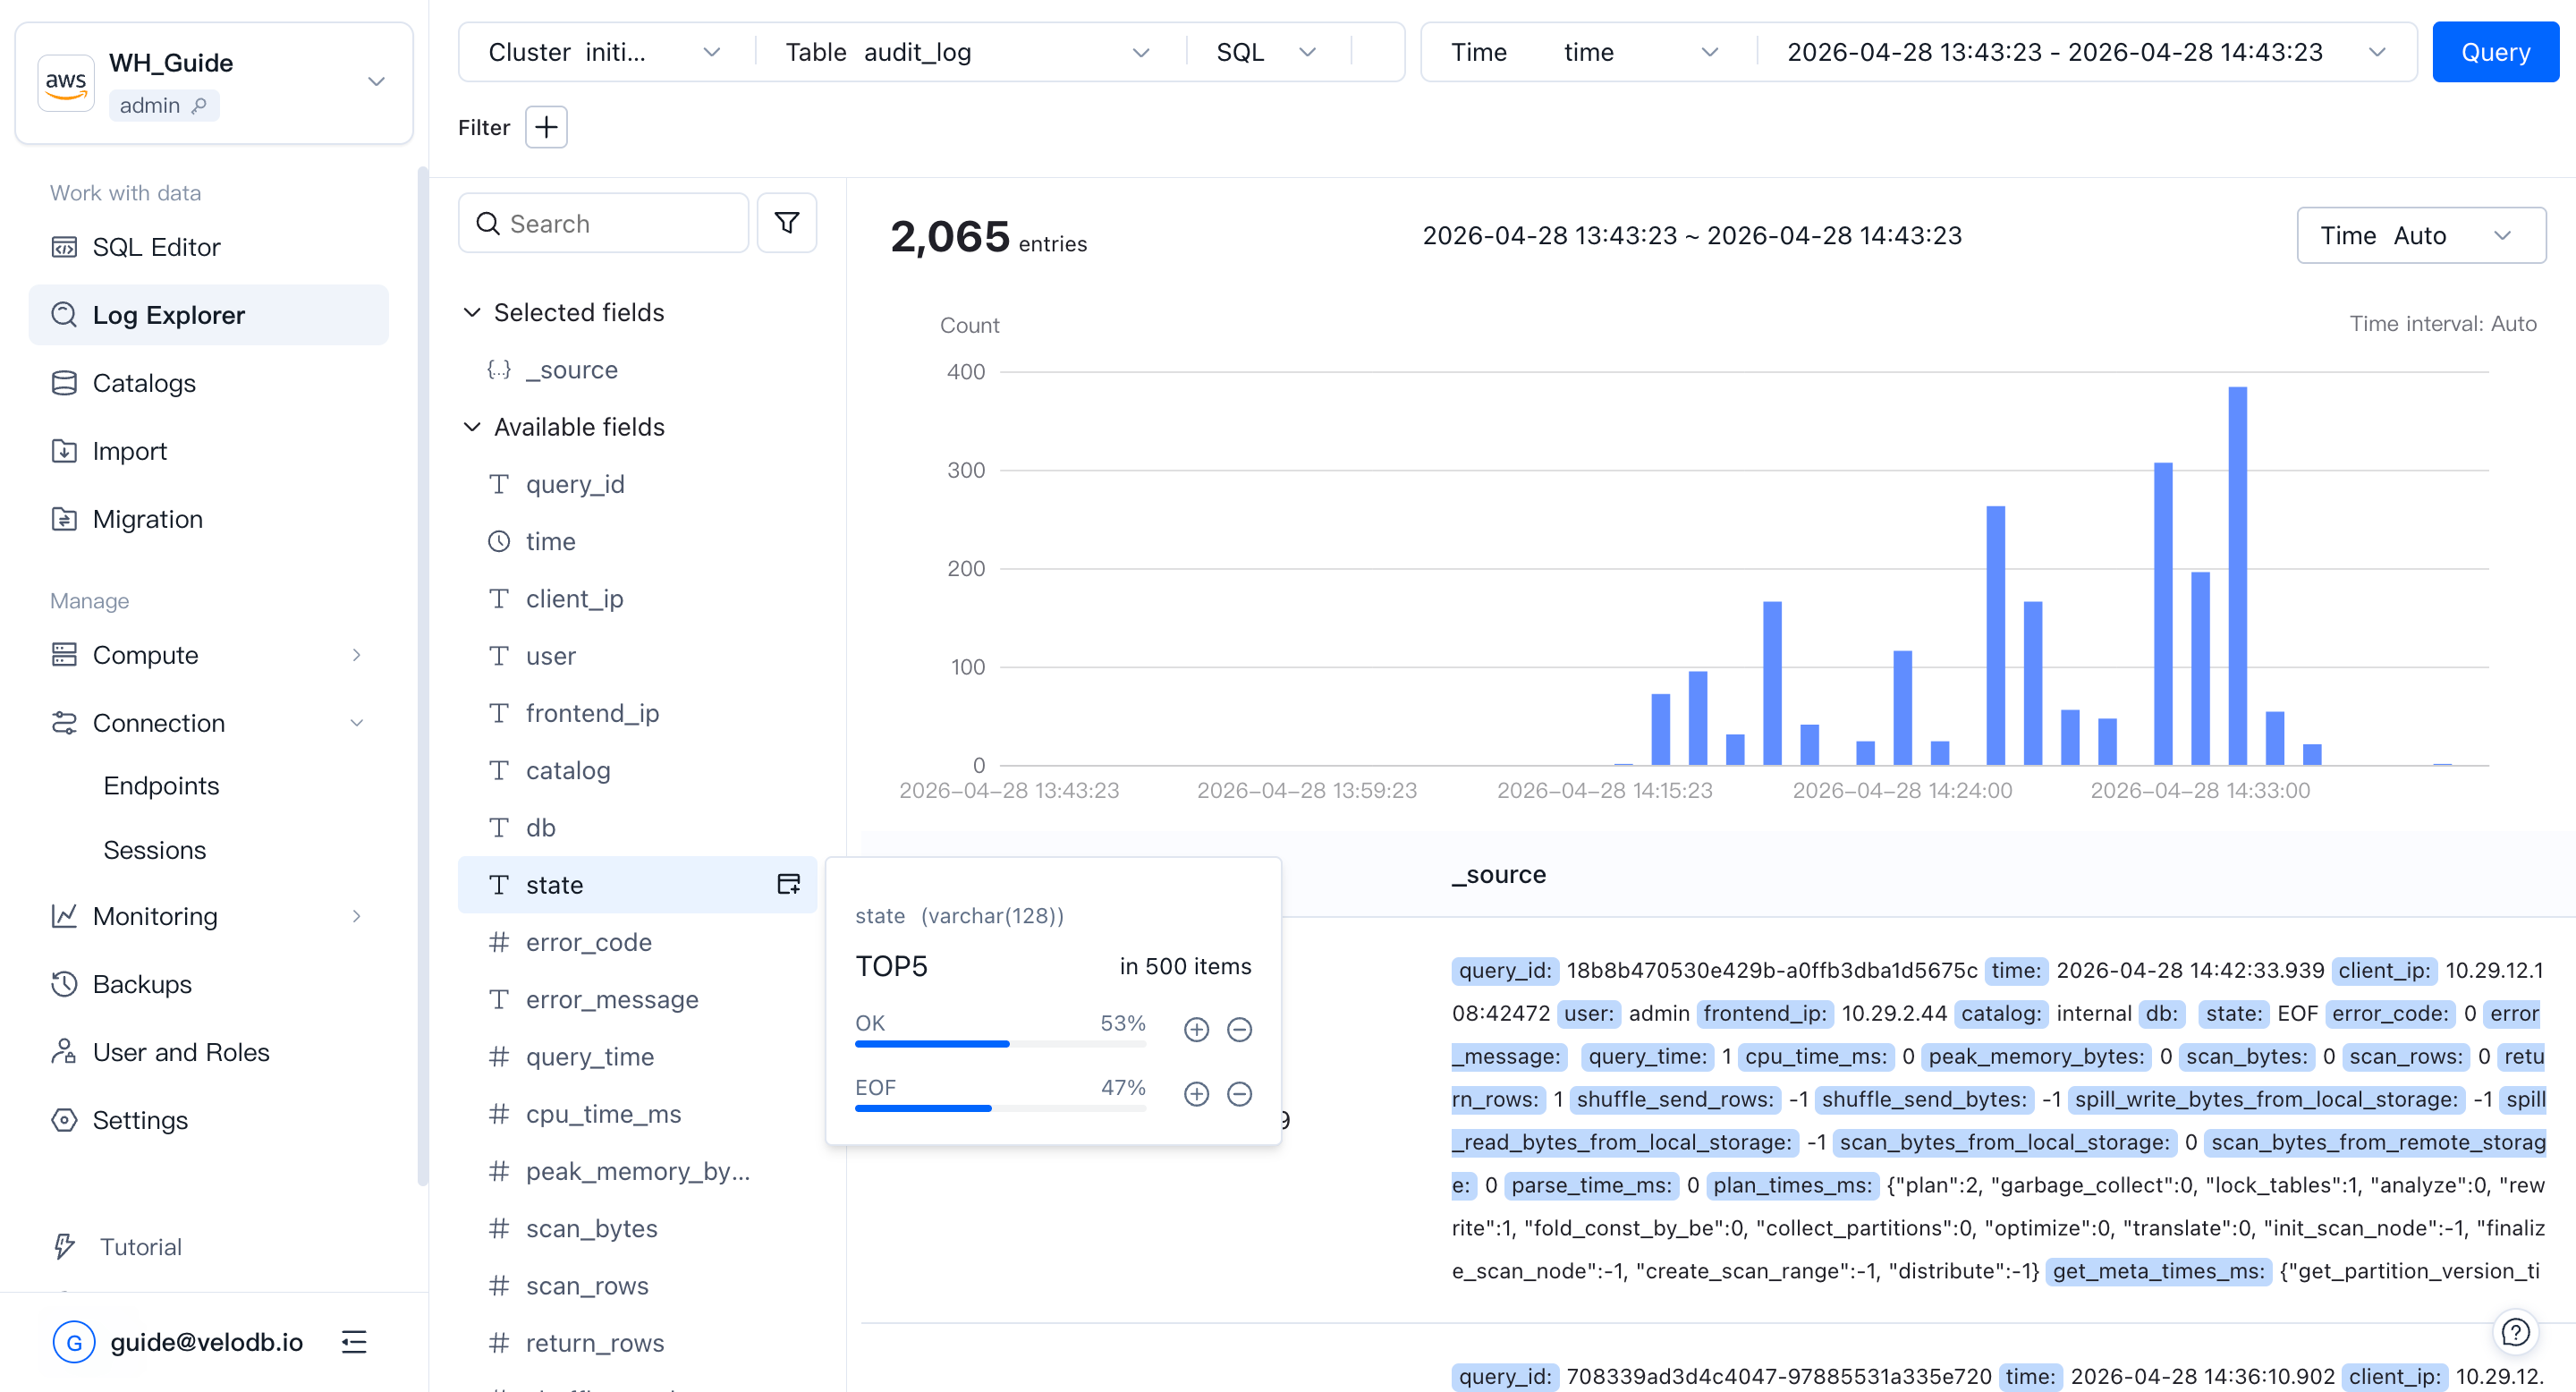
- Left field panel — every field in the current table. Pick which fields appear in the detail panel on the right. Hover over a field to see its top 5 values and their proportions, and filter by value directly from there (filters show up in the top input area).
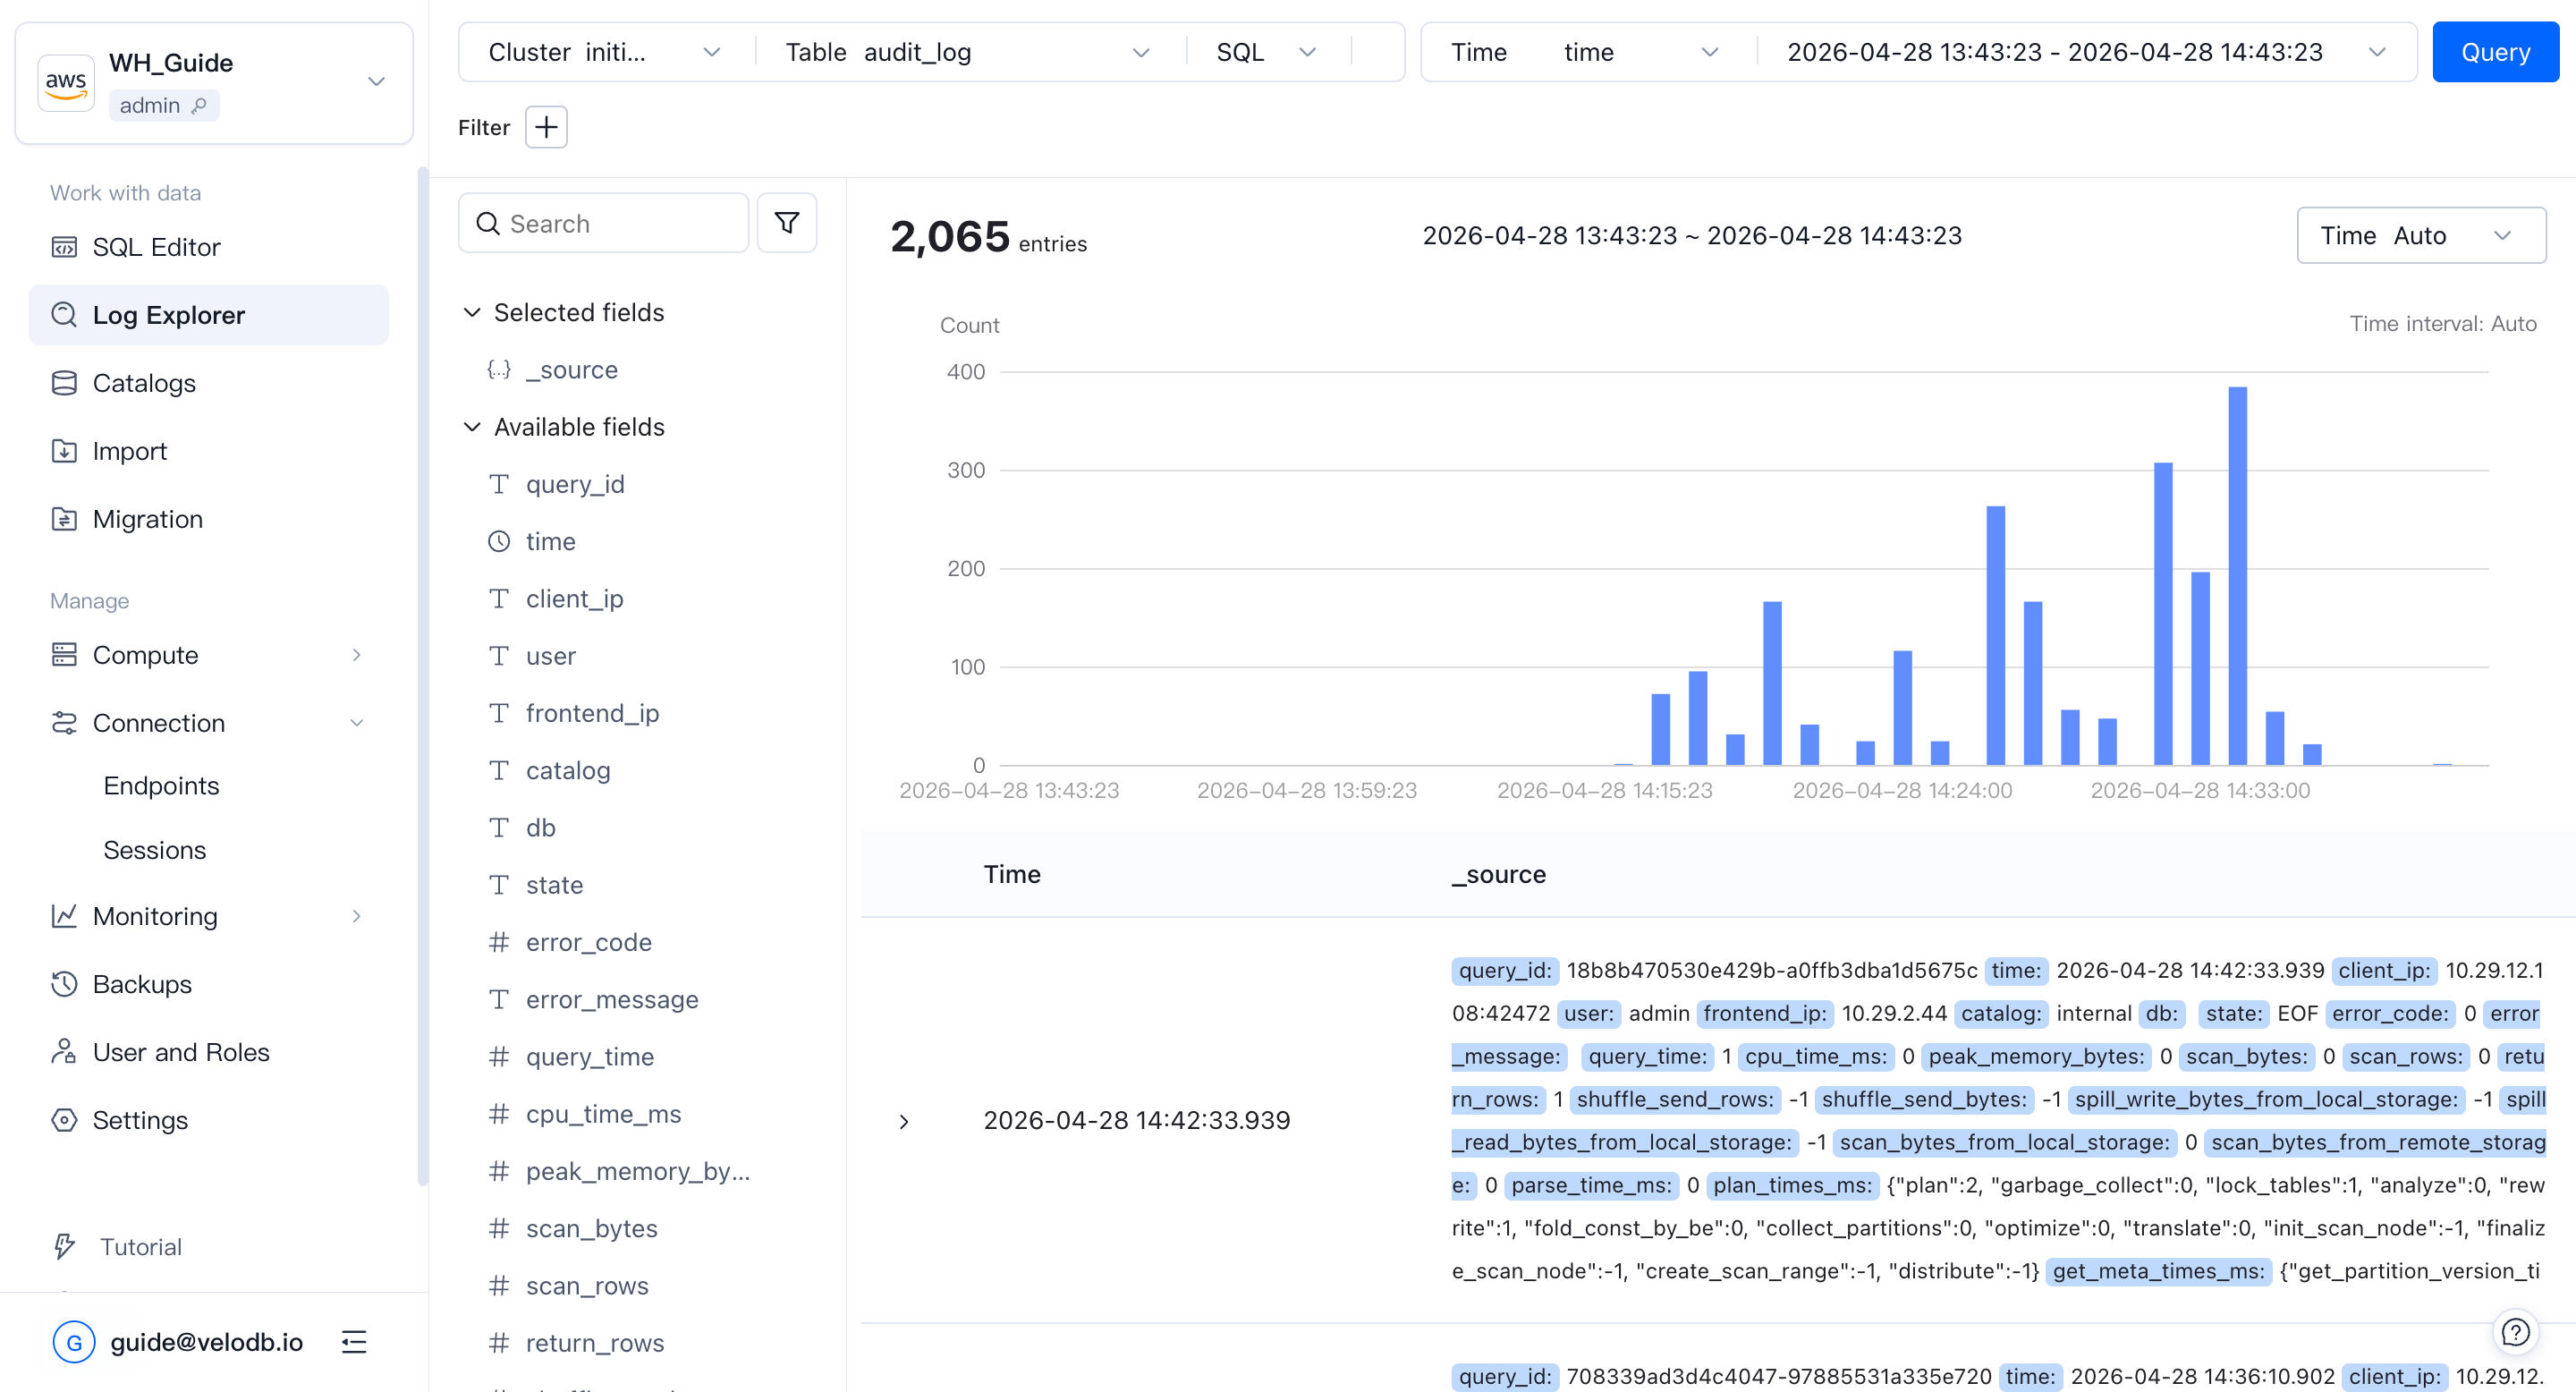
- Middle trend chart — the number of matching log entries over time. Drag across the chart to adjust the query time range.
- Bottom detail panel — the matching log rows. Click a row to open its full detail. Both table and JSON formats are supported; the table format also lets you build filters interactively.
To get started, click Log Explorer, then select the table (for example, internal_schema > audit_log). Log Explorer queries its fields and selects the first time field automatically.
Filter with the field panel
Hover over a field on the left to see its top values. For example, the state field might show the highest-frequency values EOF, OK, ERR, with the proportion of each.
Click + or − next to a value to build a filter — for example, clicking − next to ERR adds state != ERR to the filter bar.
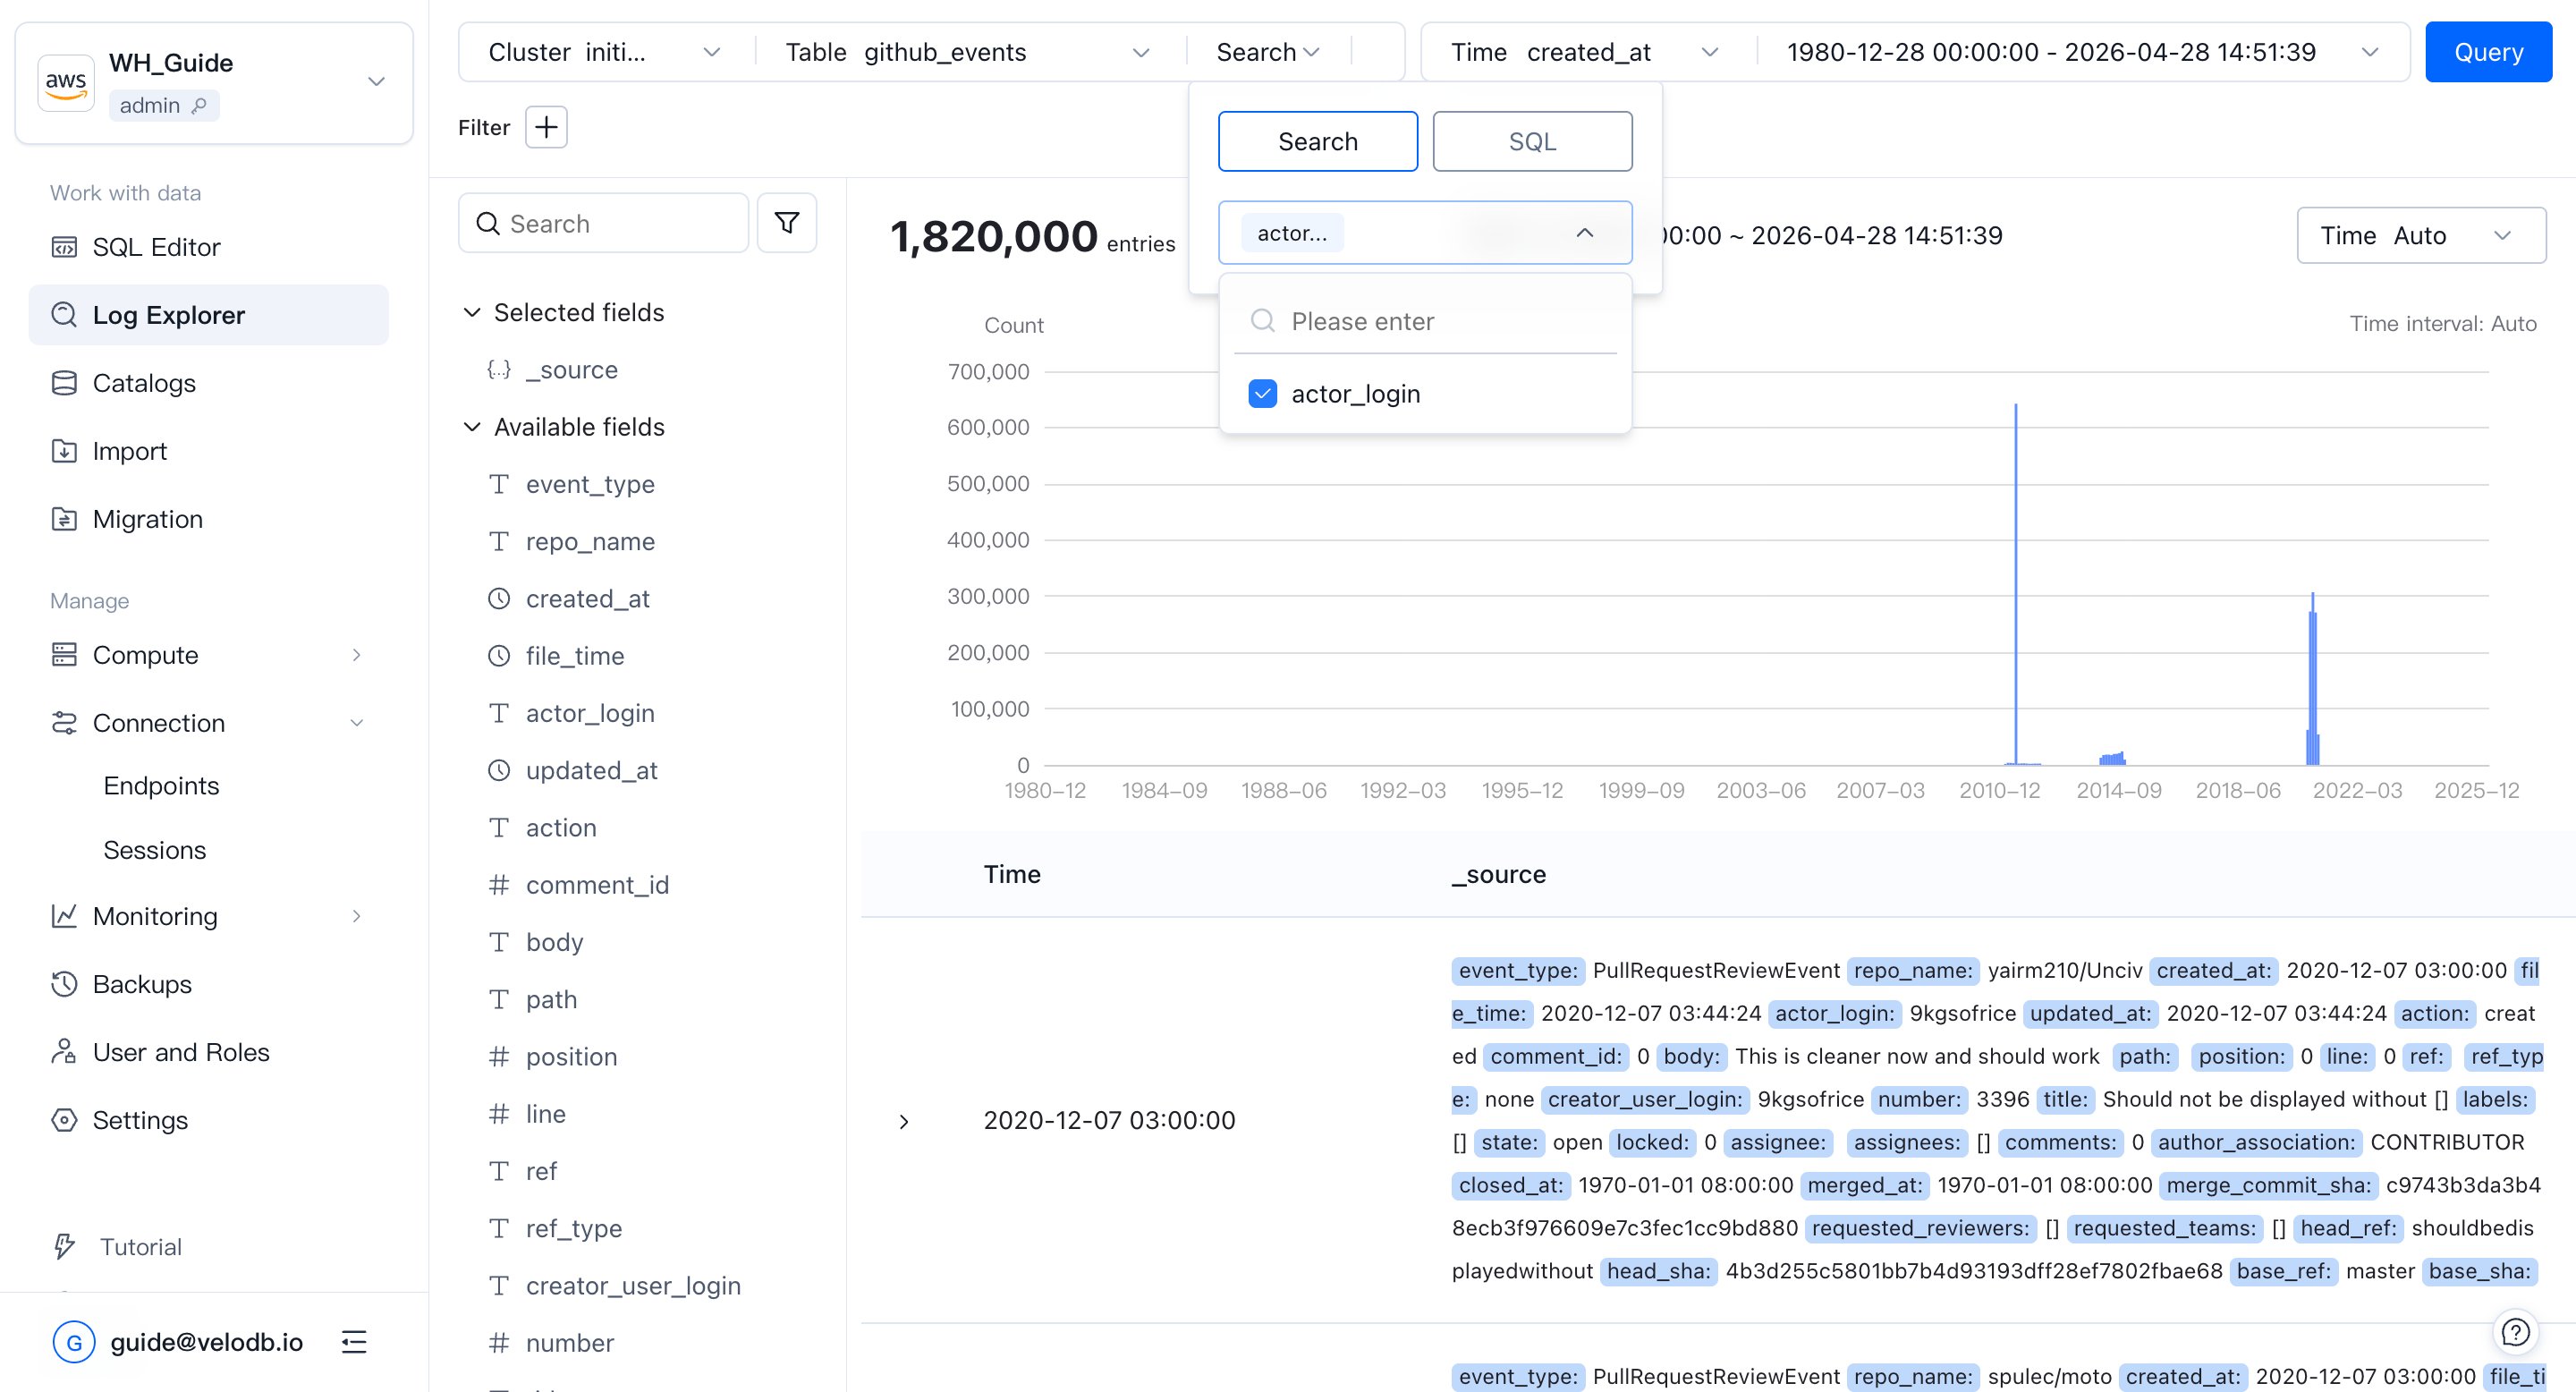
Keyword search mode
In the input box, select Search on the left and type the keyword on the right, then click Query. Keyword search mode requires an inverted index on the target table.
Matches are highlighted in the detail panel, and the trend chart updates to show how many entries match over time.
Note Using
MATCH_ANYto match any keyword matches across every field in the log. Highlighting will try to cover all search keywords, but because of special characters the highlight may not be character-exact.
To match a phrase, wrap it in double quotes — for example "GET /api/v1/user". Phrase search uses MATCH_PHRASE under the hood.
SQL mode
When you need a more precise match, switch the search box to SQL, type a WHERE condition, and click Query.
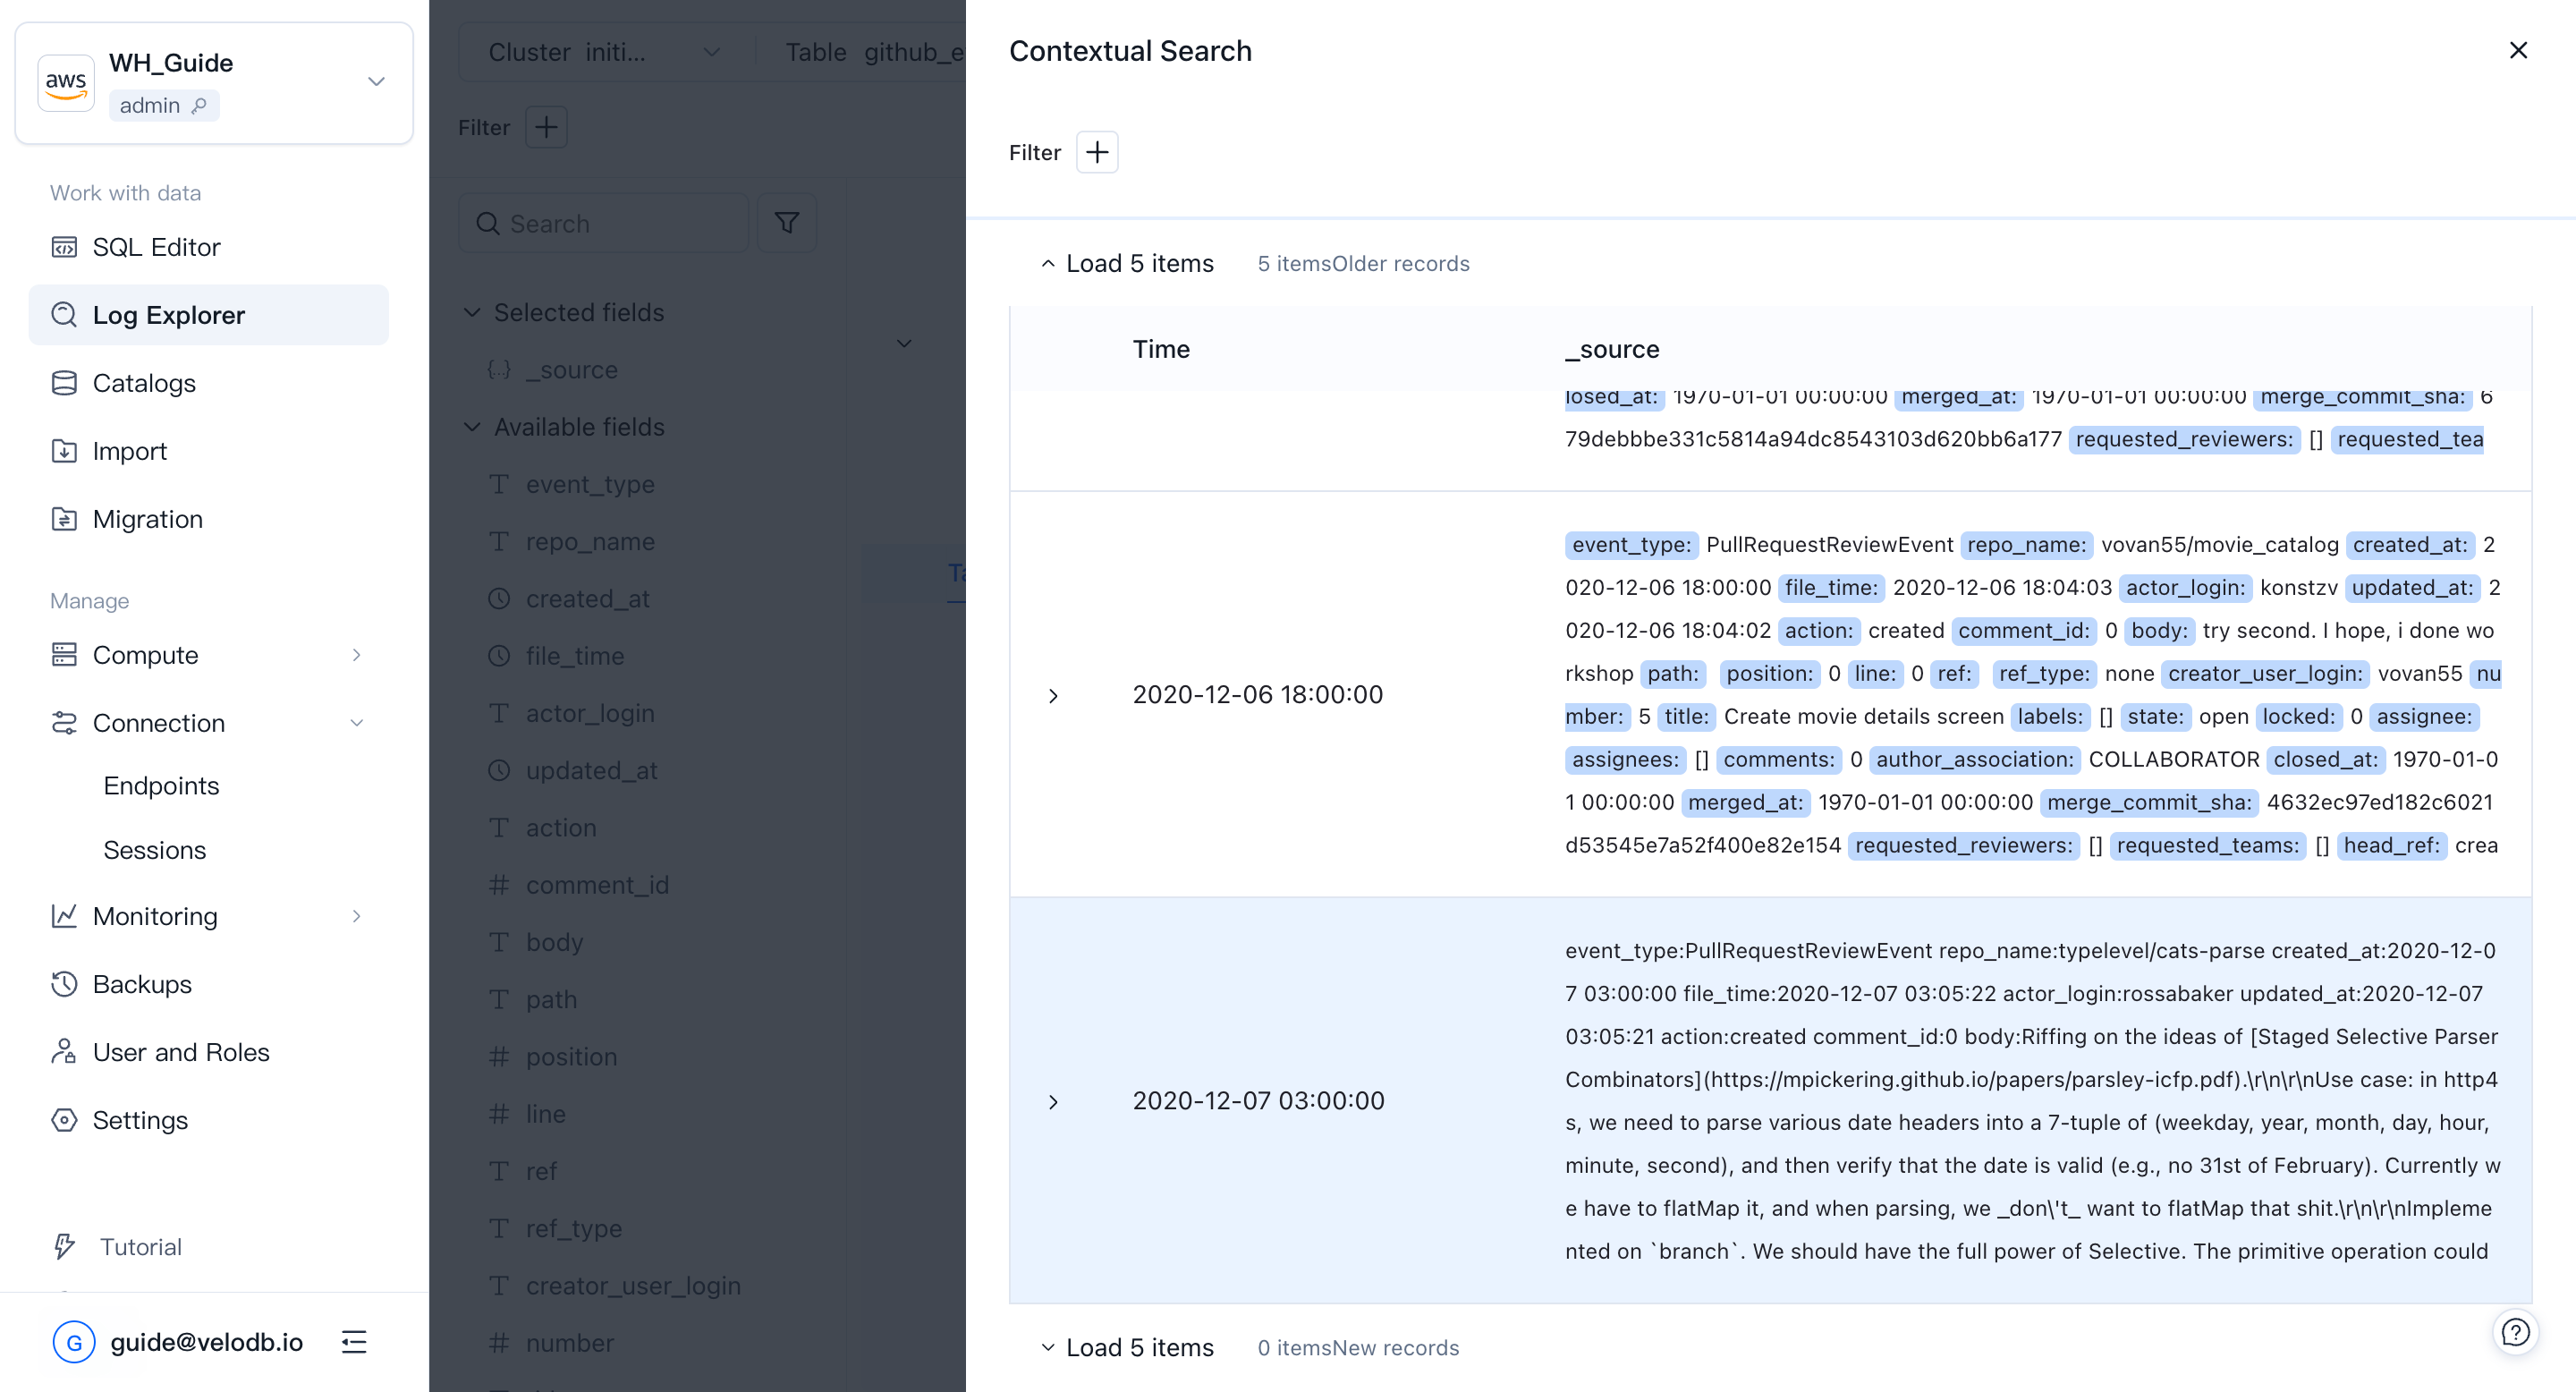
Row details and context
Click a row to expand its details. In table format, click + or − next to any field to add or exclude that value in the current filter.
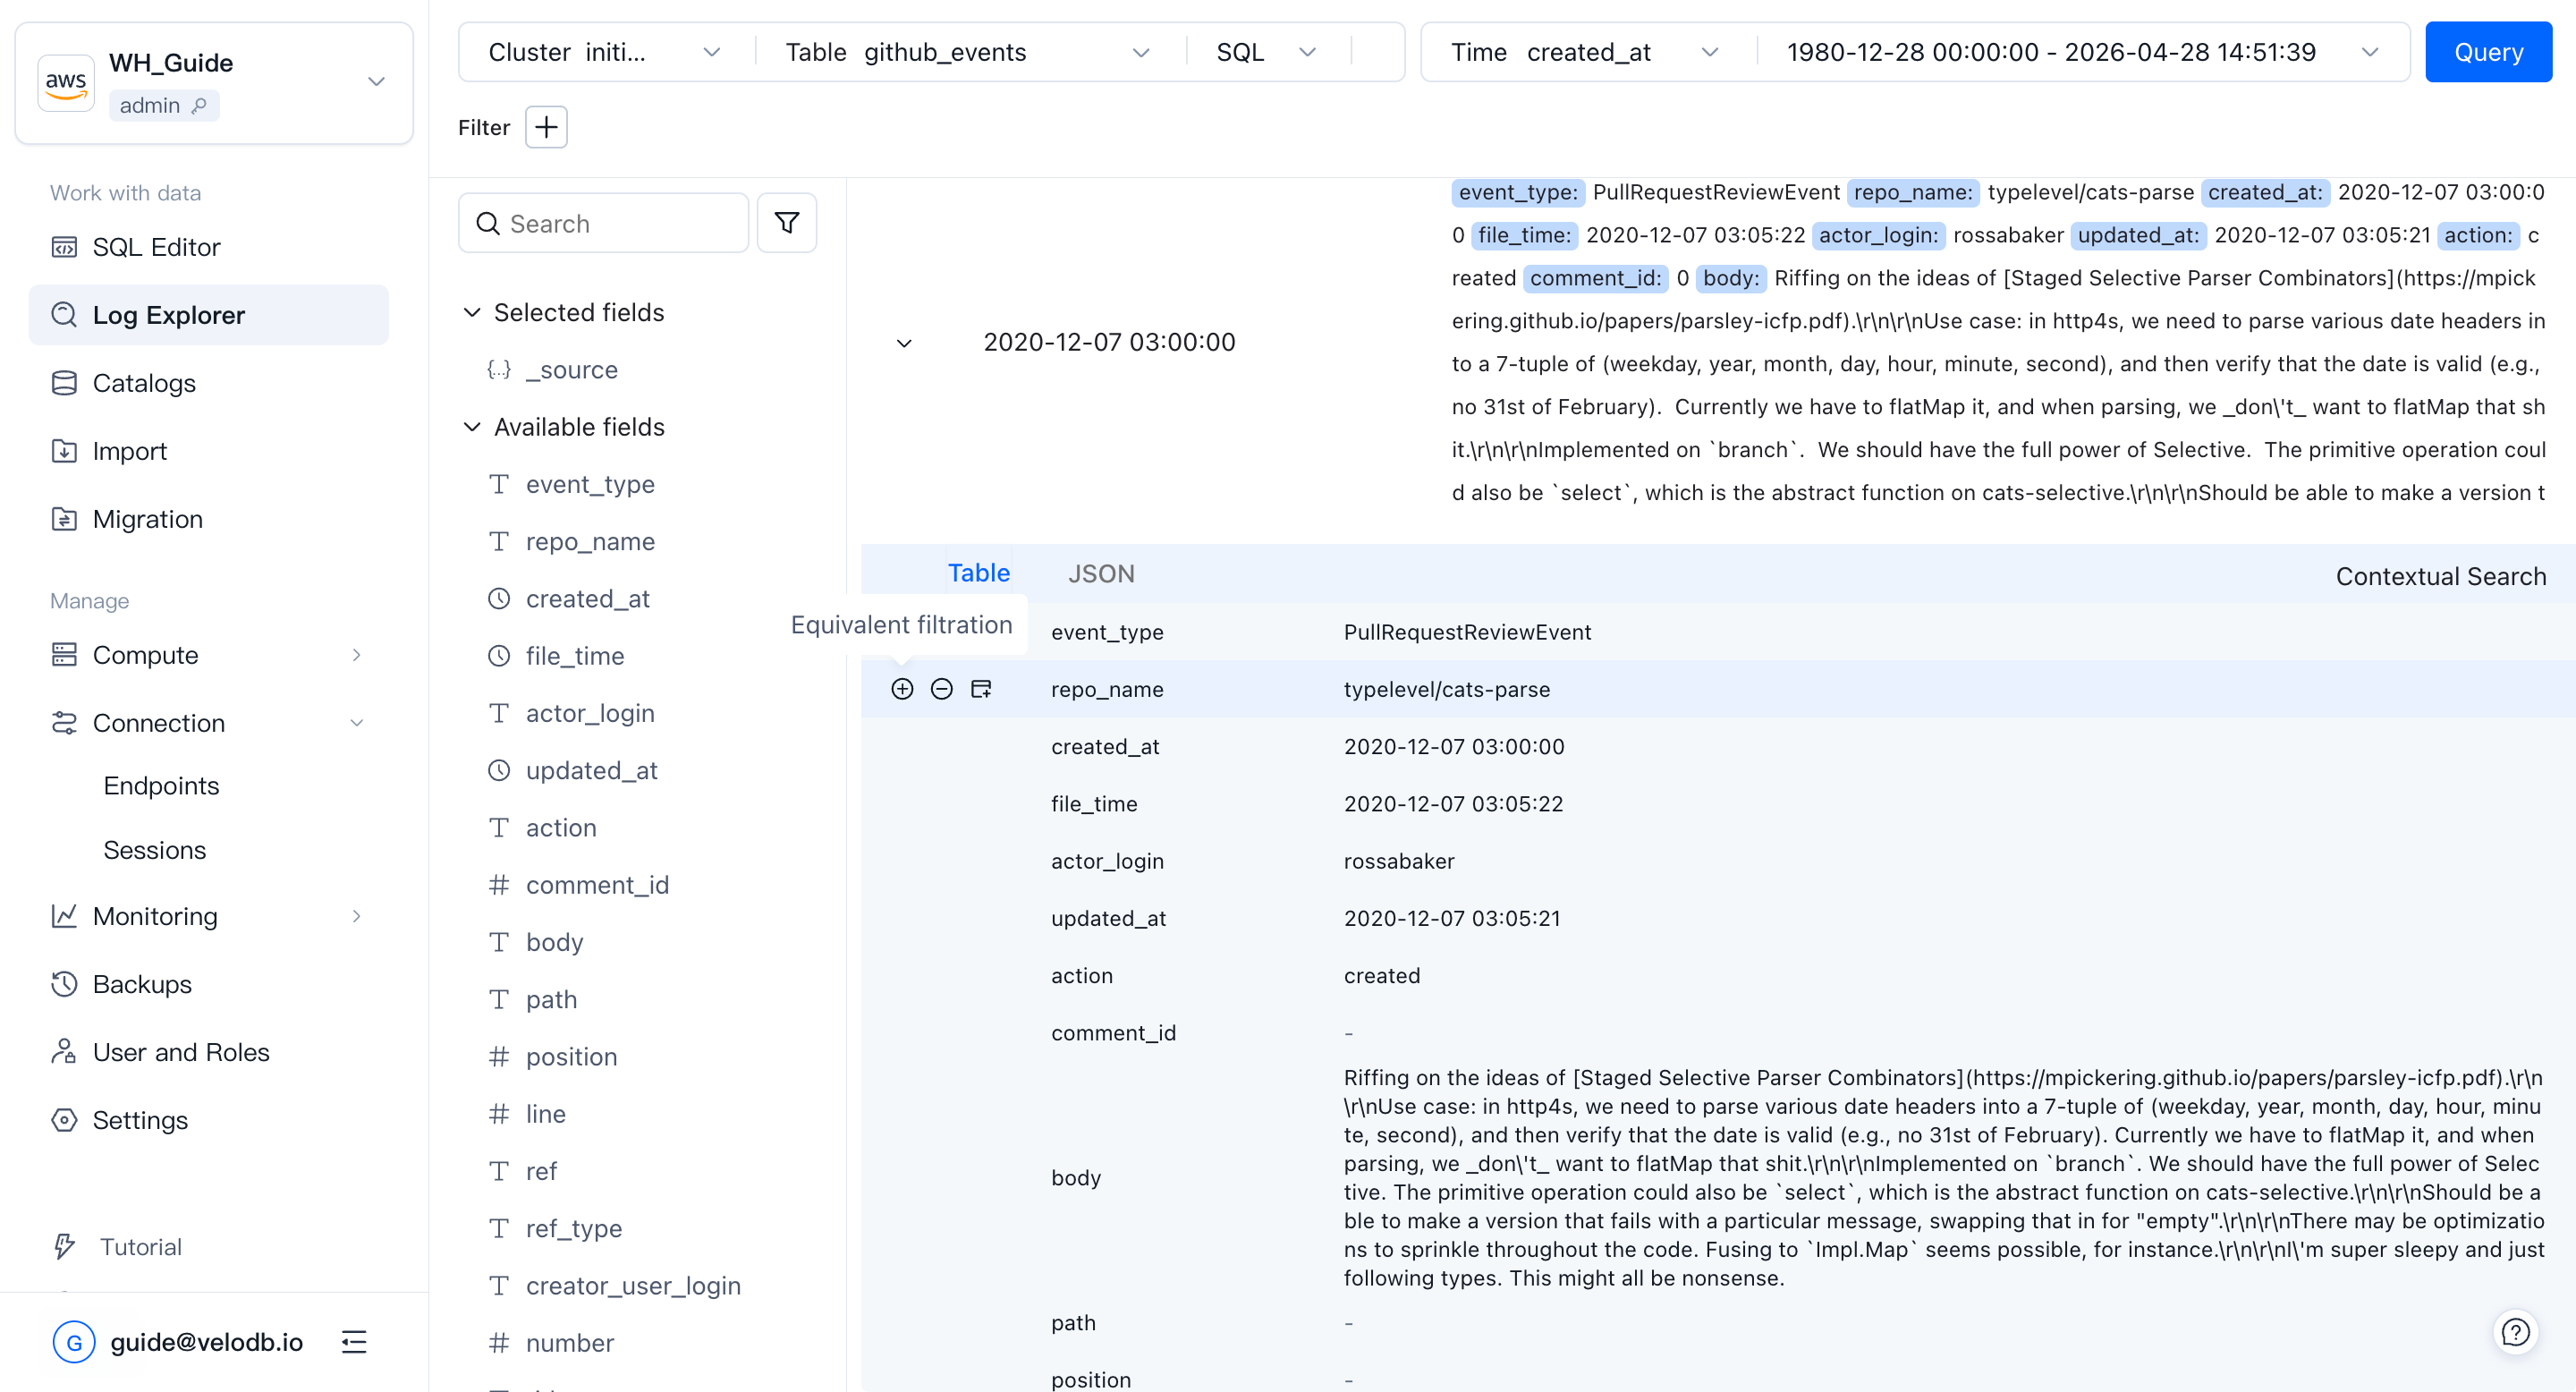
Click Context on the right of a row to see the 10 log entries before and after it. You can continue to add filter conditions inside the context view.