Monitoring
VeloDB Cloud provides monitoring and alerting so you can track the health and performance of your warehouse and clusters and react when something changes.
Open Monitoring from the Manage group in the left navigation. Monitoring has four sub-pages: Metrics, Alerts, Query Audit, and Usage.
Metrics
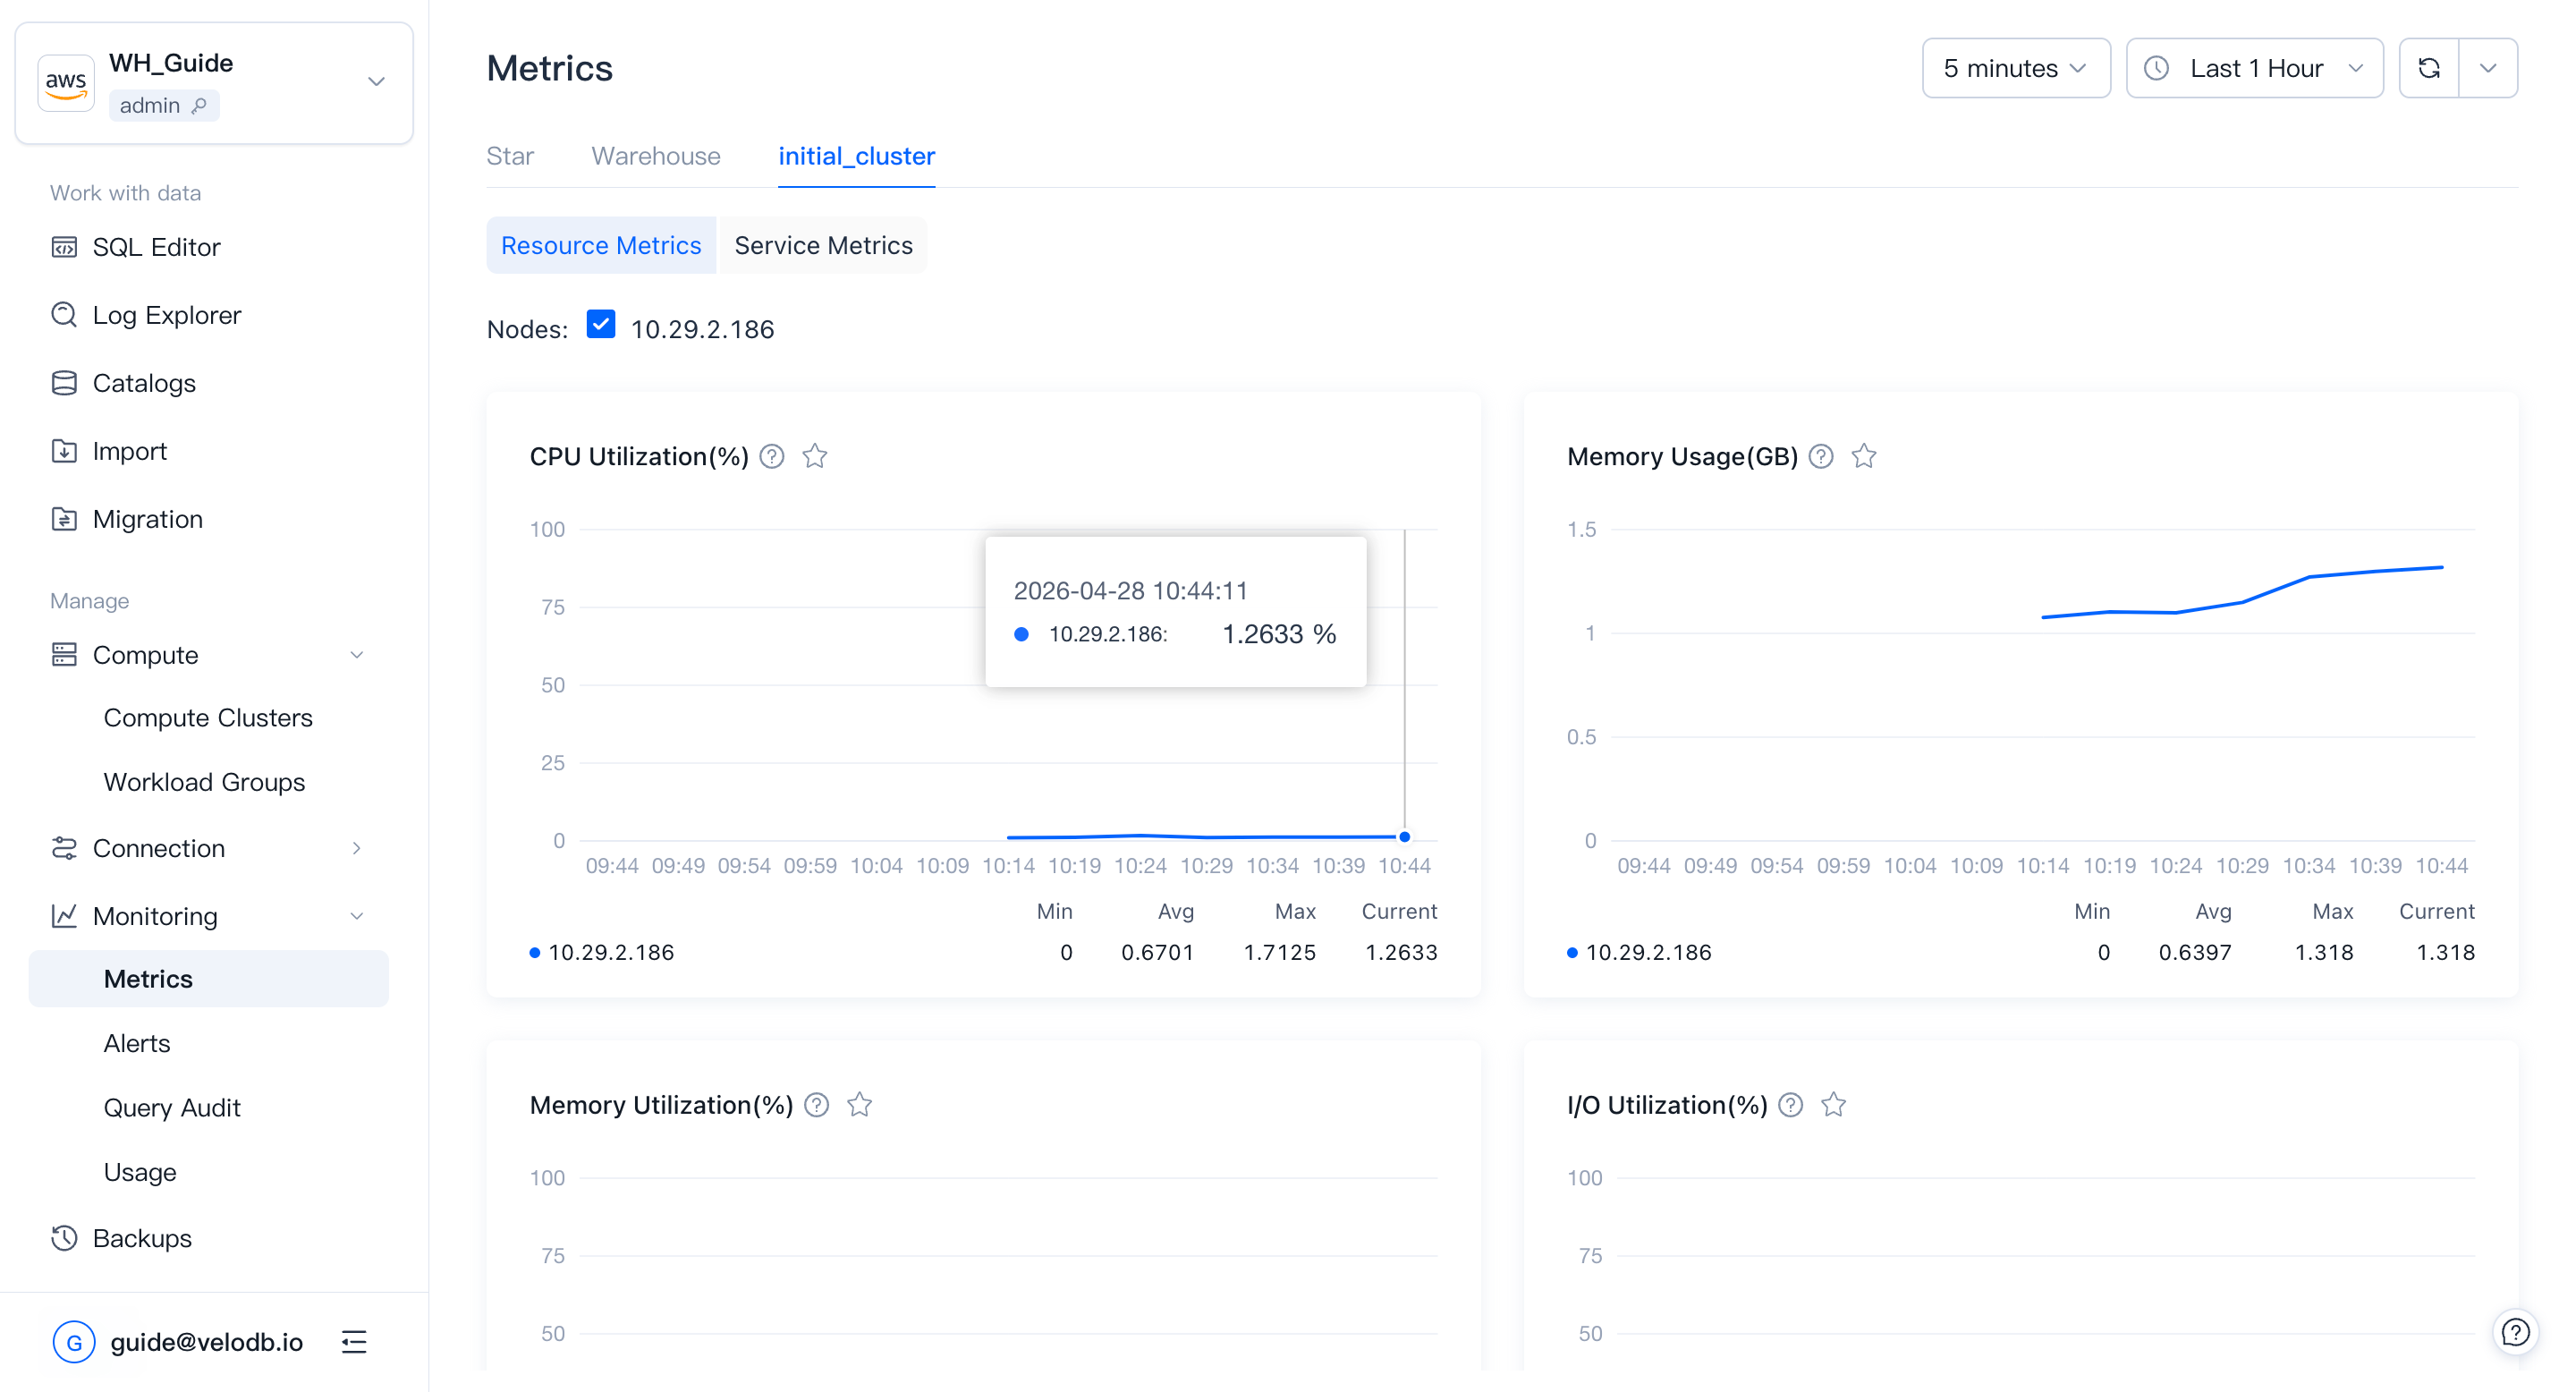
On the Metrics page you can:
- View metrics by warehouse or by cluster.
- Use Starred to pin the metrics you care about across warehouses and clusters so they display together.
- Adjust the time selector to look at historical data up to the past 15 days.
- Enable auto-refresh for near-real-time updates (5-second interval).
Metrics are split into two categories: Basic Metrics (physical resource utilization) and Service Metrics (query / workload performance).
Basic metrics
Basic metrics track physical utilization of the cluster by node. They help you judge whether the cluster is healthy in a given time range, and whether historical or current queries are affecting performance — useful input when planning to scale up, scale down, or optimize SQL.
| Metric | What it shows |
|---|---|
| CPU Utilization | CPU utilization percentage across all nodes. Useful to find quiet windows for scaling or other resource-heavy operations. |
| Memory Usage | Memory consumed by all nodes. Consistently high usage is a signal to scale up. |
| Memory Utilization | Memory utilization of all nodes. Consistently high utilization is a signal to scale up. |
| I/O Utilization | Disk I/O utilization. Consistently high values suggest adding more nodes for query performance. |
| Network Outbound Throughput | Average outbound speed per second per node (MB/s). Queries that read data over the network are slower — configure caching to reduce network reads. |
| Network Inbound Throughput | Average inbound speed per second per node (MB/s). |
| Cache Read Throughput | Per-second cache read throughput (MB/s). |
| Cache Write Throughput | Per-second cache write throughput (MB/s). |
Support range:
| Metric | Warehouse | Cluster |
|---|---|---|
| CPU Utilization | ✓ | ✓ |
| Memory Usage | ✓ | ✓ |
| Memory Utilization | ✓ | ✓ |
| I/O Utilization | ✓ | ✓ |
| Network Outbound Throughput | ✓ | ✓ |
| Network Inbound Throughput | ✓ | ✓ |
| Cache Read Throughput | — | ✓ |
| Cache Write Throughput | — | ✓ |
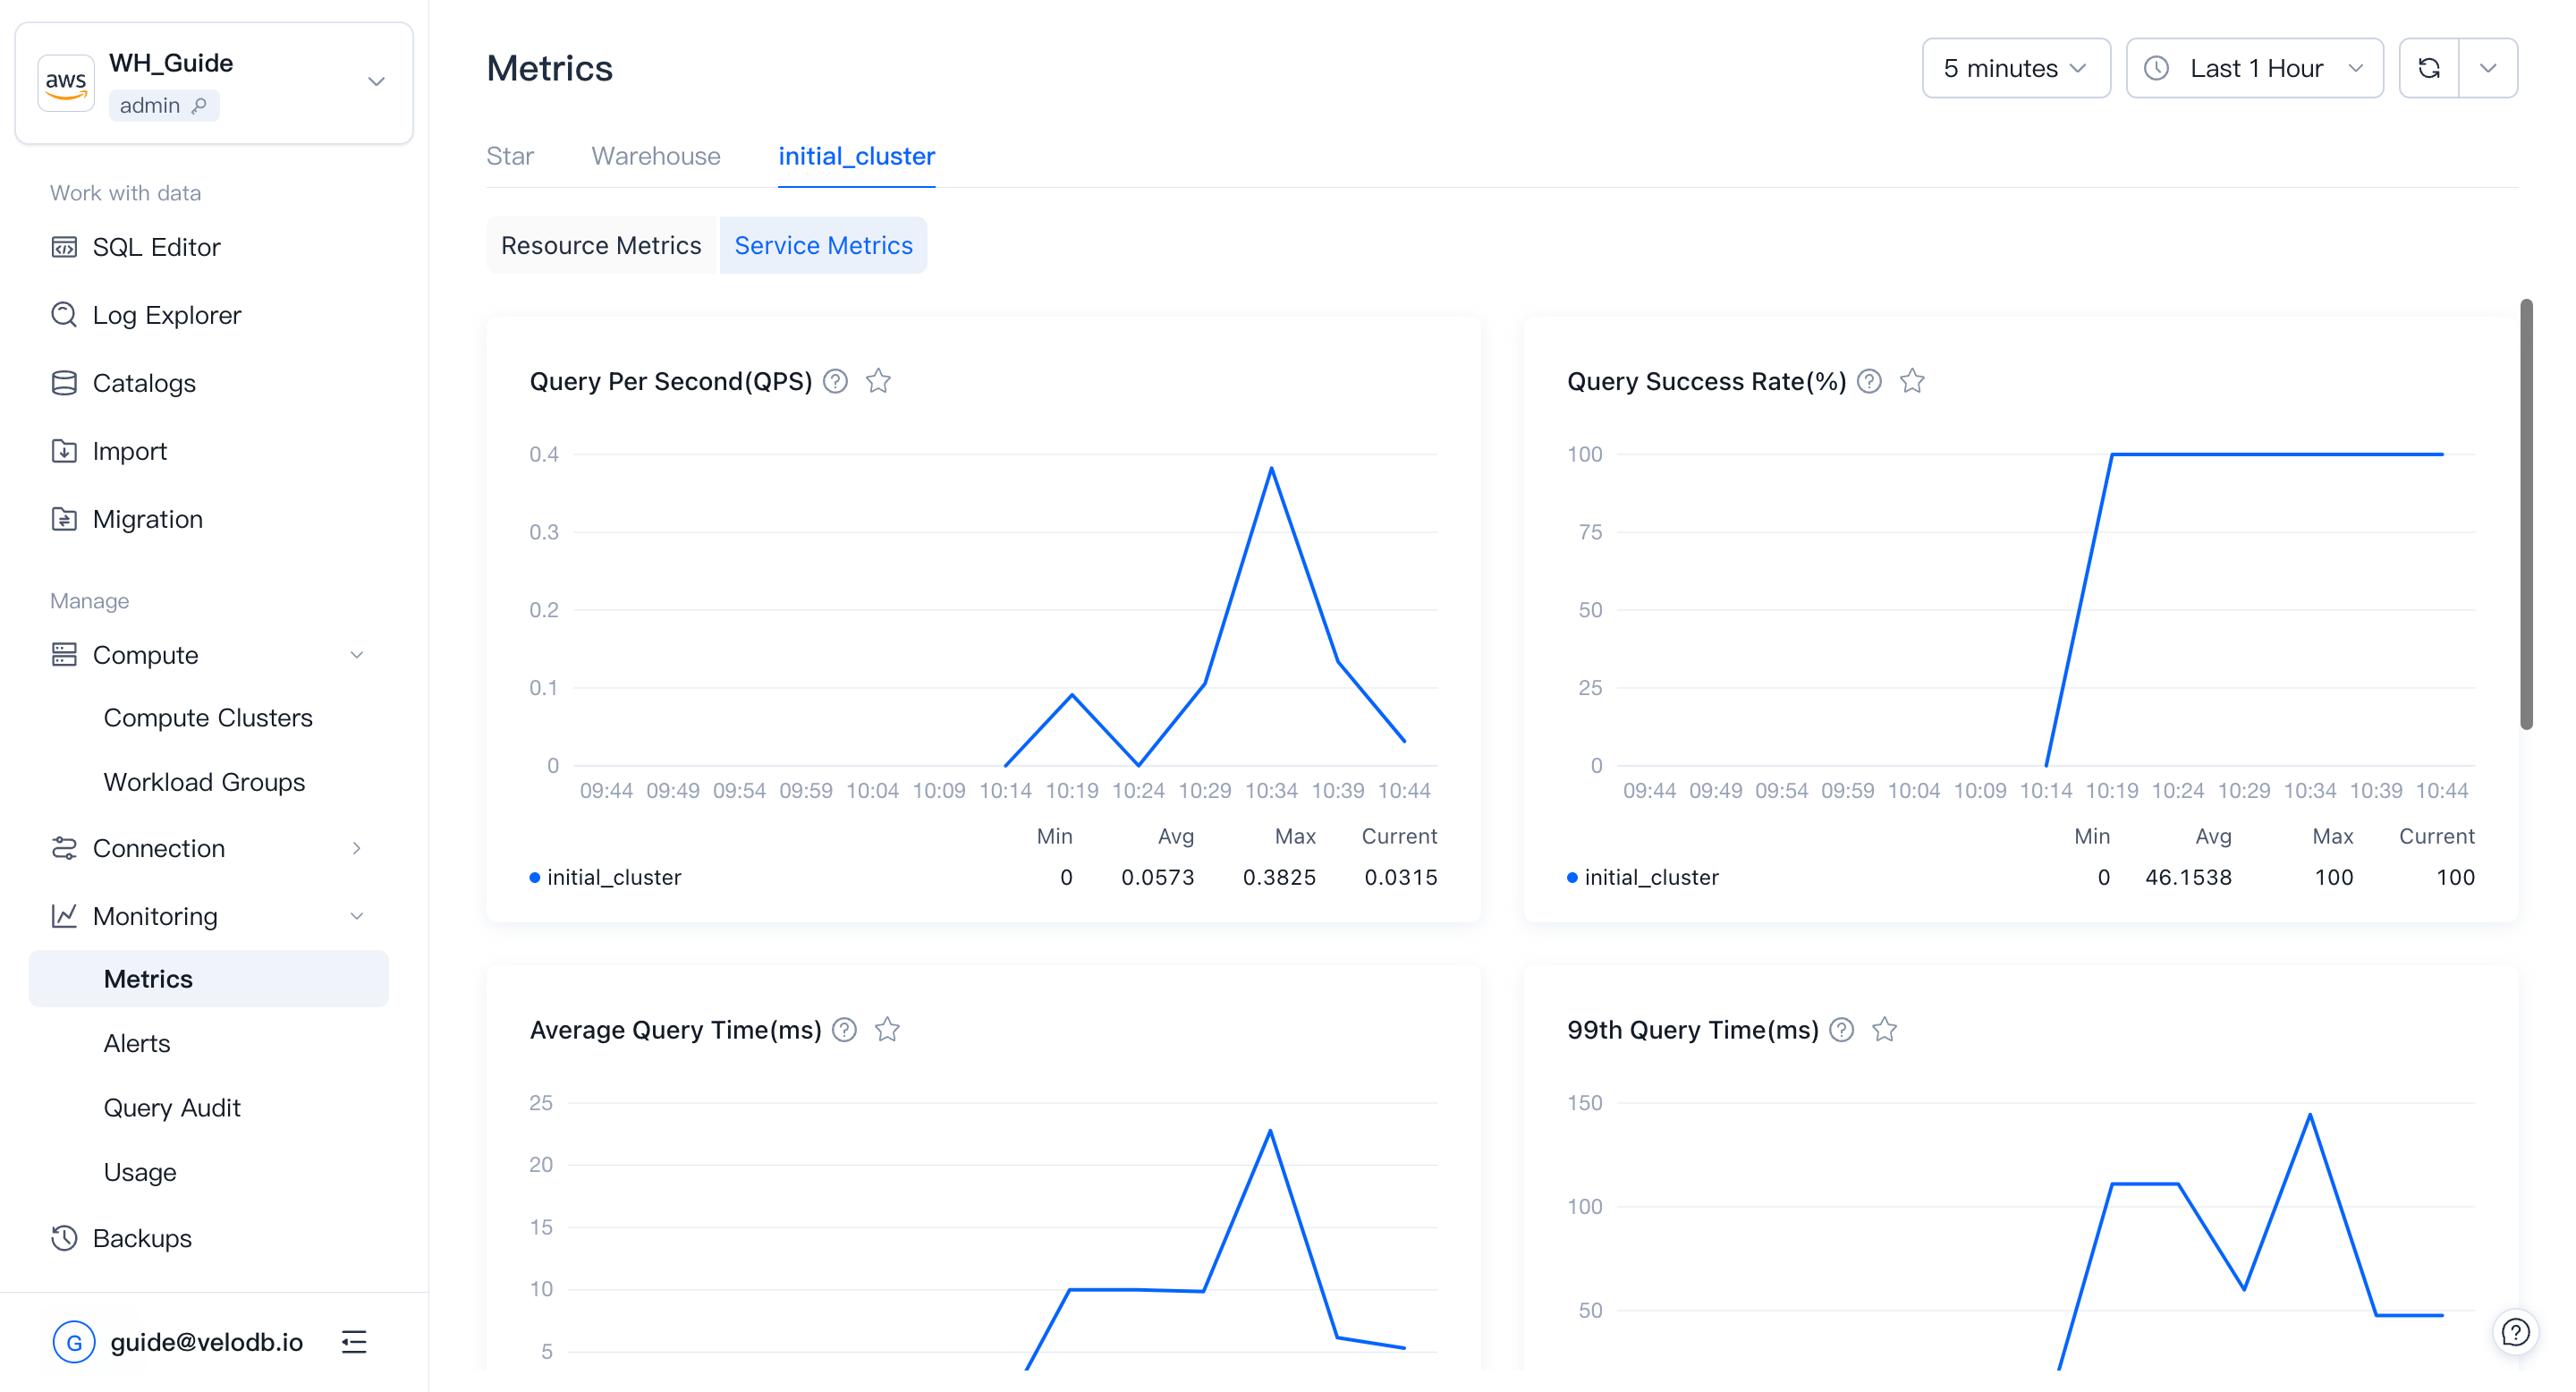
Service metrics
Service metrics track query and workload behavior: how fast queries run, how many succeed, how write paths behave.
| Metric | What it shows |
|---|---|
| Query Per Second (QPS) | Number of query requests per second. Peak QPS is a useful input when sizing a cluster. |
| Query Success Rate | Percentage of successful queries, updated per minute. Abnormal drops may indicate a cluster or node failure. |
| Dead Nodes | Number of dead nodes in the cluster. |
| Average Query Runtime | Average query time, updated per minute. Abnormal rises are a signal to investigate. |
| Query 99th Latency | Response time of the 99th-percentile query. Reflects the speed of slow queries. |
| Cache Hit Rate | Percentage of I/O operations served from cache. Low values suggest reviewing the cache policy or increasing cache space. |
| Remote Storage Read Throughput | Amount of data read from remote storage per unit time. |
| Sessions | Number of sessions for the warehouse (not split per cluster). |
| Load Rows Per Second | Rate at which records are being successfully written. |
| Load Bytes Per Second | Rate at which data volume is being written. |
| Finished Load Tasks | Number of load tasks completed in the recent period. Sharp changes may indicate a business anomaly. |
| Compaction Score | Data-file merging pressure. Higher score means more merging pressure. |
| Transaction Latency | Transaction latency of write tasks. Lower means data becomes queryable sooner. |
Support range:
| Metric | Warehouse | Cluster |
|---|---|---|
| Query Per Second | ✓ | ✓ |
| Query Success Rate | ✓ | ✓ |
| Dead Nodes | — | ✓ |
| Average Query Time | ✓ | ✓ |
| Query 99th Latency | ✓ | ✓ |
| Cache Hit Rate | — | ✓ |
| Remote Storage Read Throughput | — | ✓ |
| Sessions | ✓ | — |
| Load Rows Per Second | ✓ | ✓ |
| Load Bytes Per Second | ✓ | ✓ |
| Finished Load Tasks | ✓ | — |
| Compaction Score | — | ✓ |
| Transaction Latency | ✓ | — |
Alerts
VeloDB Cloud provides monitoring and alerting at no additional charge (beyond SMS alert notifications). You can configure alert rules so you are notified when cluster monitoring metrics change.
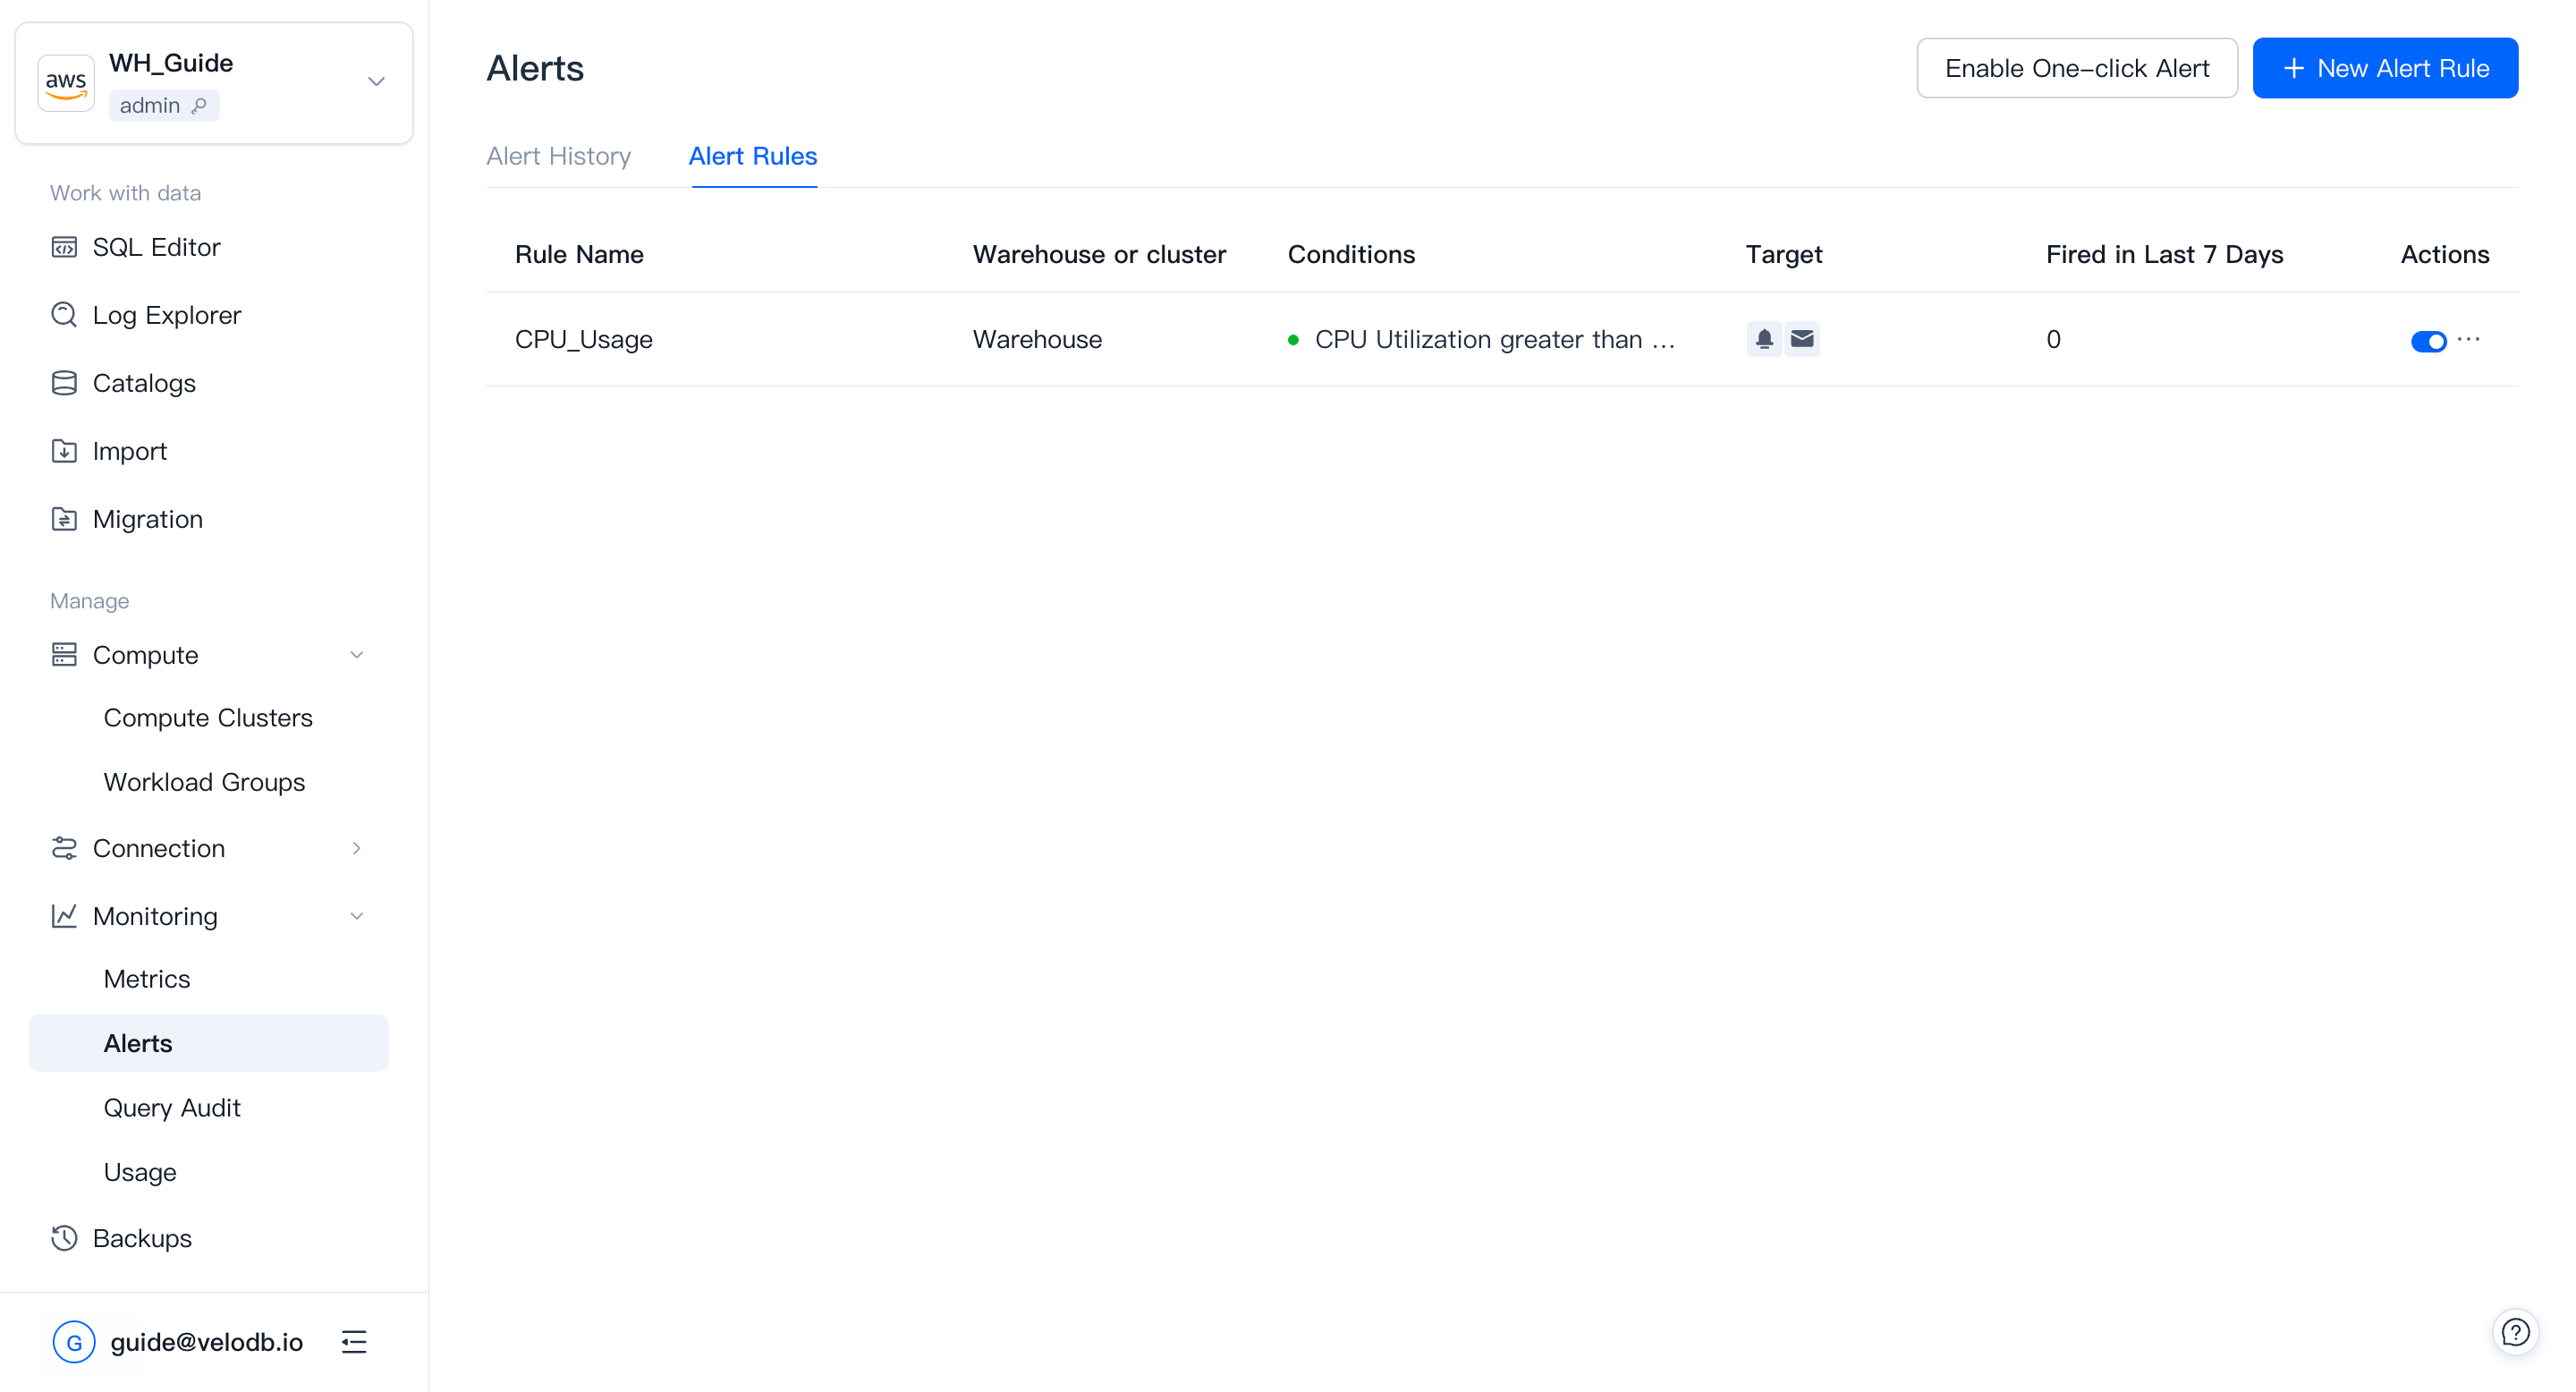
View alert rules
The Alerts list shows existing alert rules and their current alerting status: a red dot means the rule is firing; a green dot means the rule is not triggered.
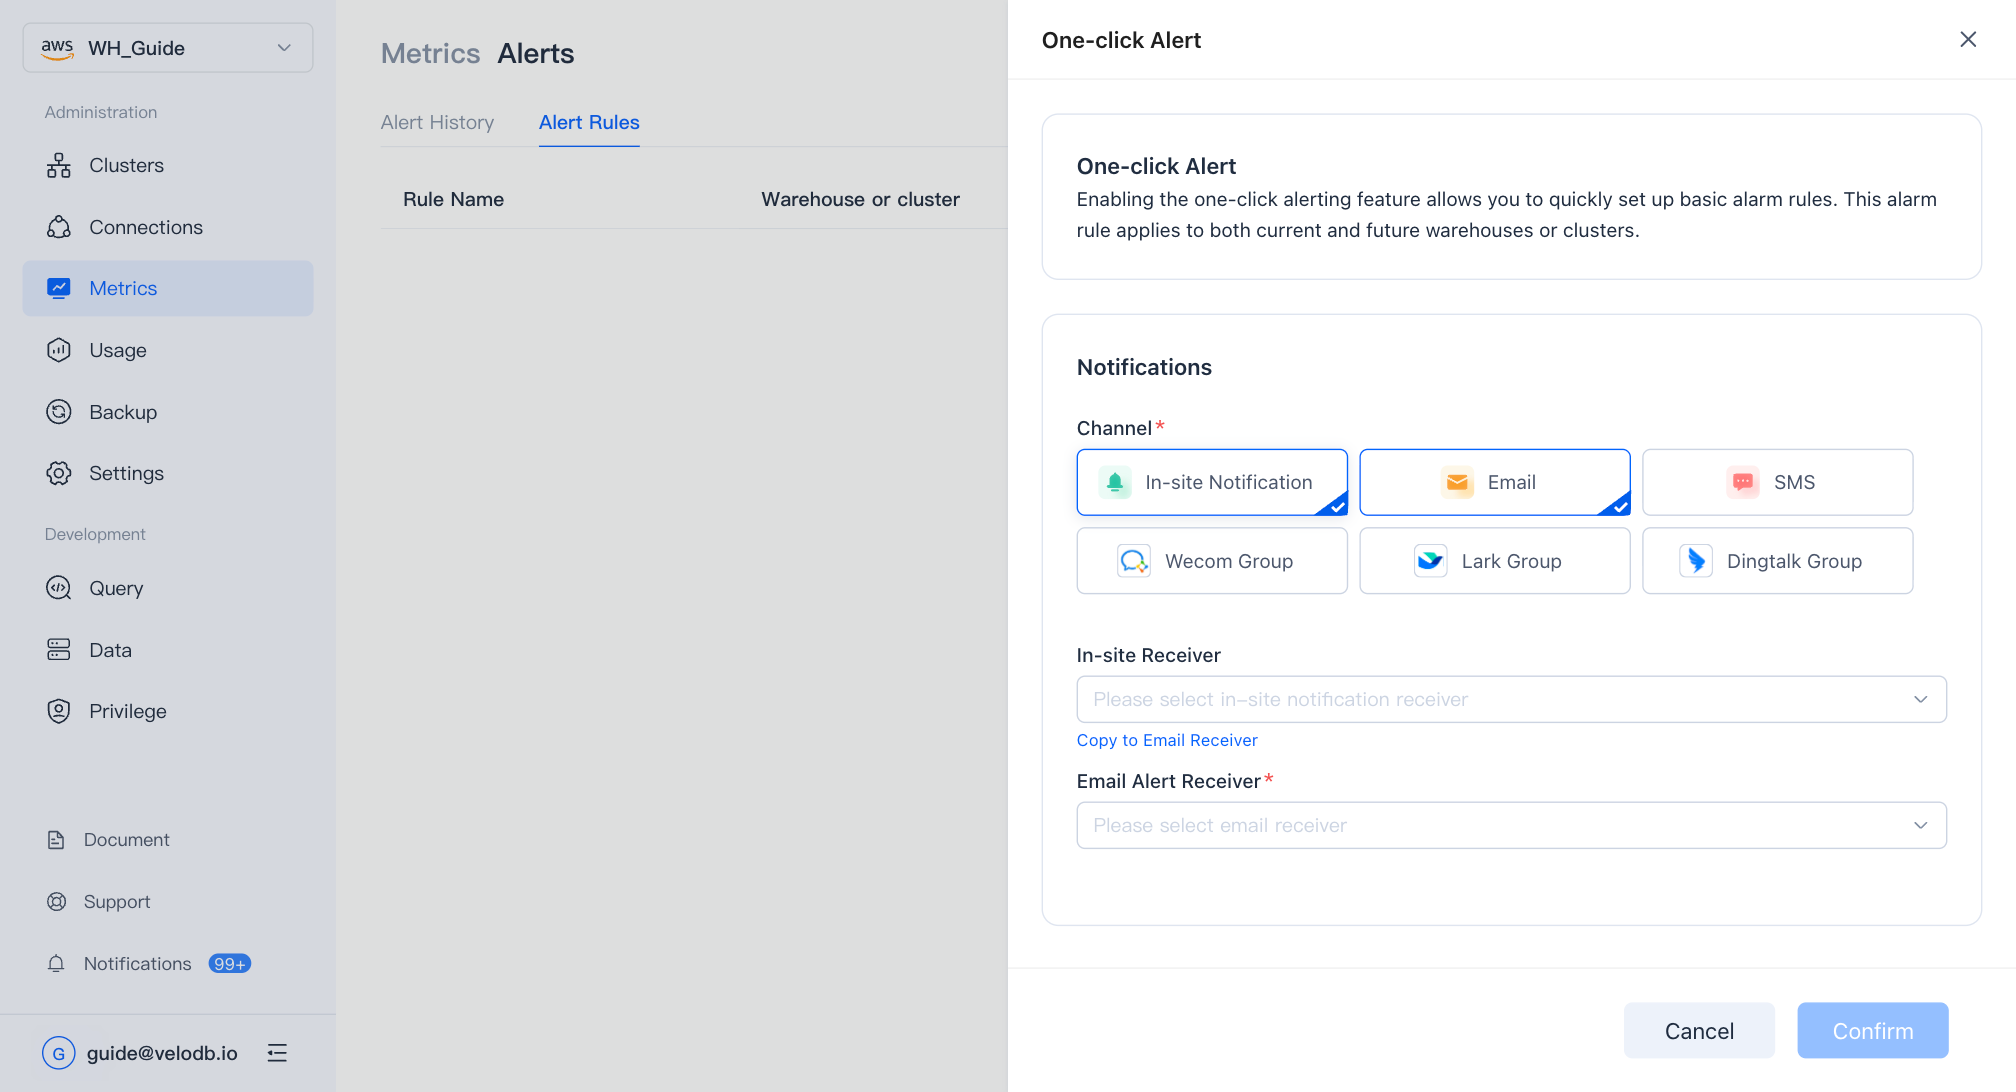
One-click alerts
Click Enable One-Click Alert to set up a basic rule set automatically. The rule set applies to both current warehouses and clusters and any you create later.
Create or edit an alert rule
Click New Alert Rule or copy an existing rule.
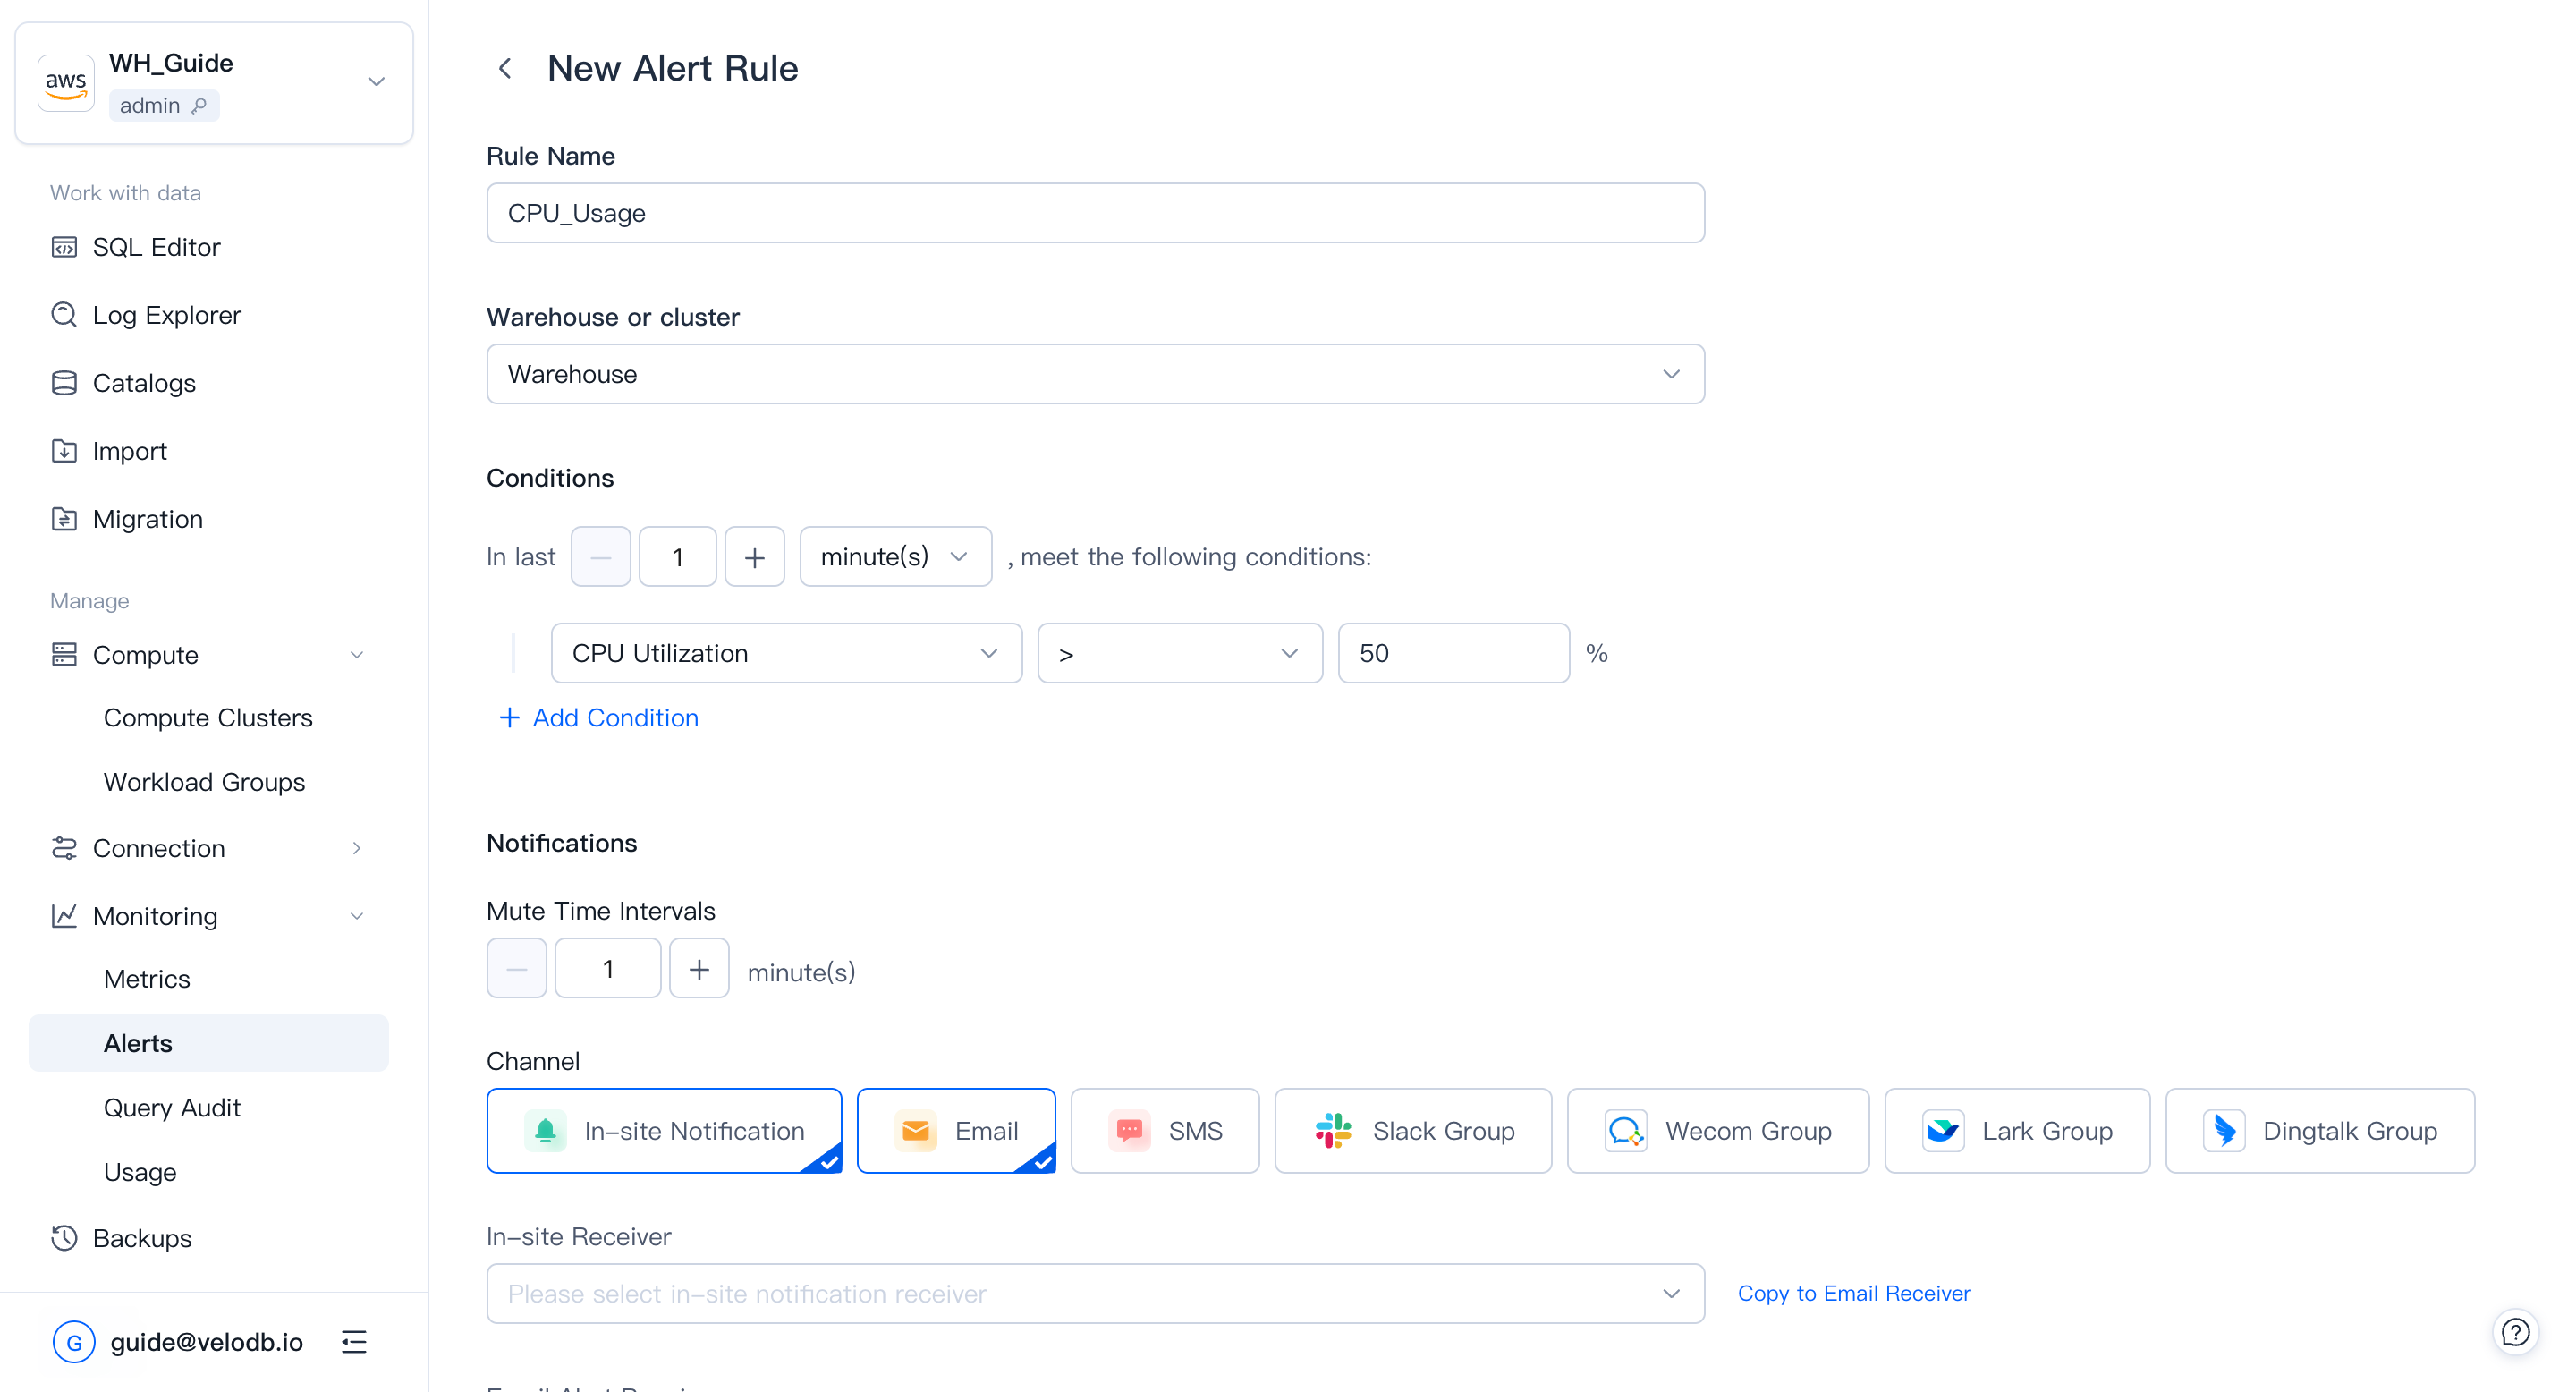
An alert rule has four parts:
| Part | Description |
|---|---|
| Rule Name | A name unique within the warehouse. |
| Cluster | Clusters the rule applies to. When a cluster is deleted, its rules are not deleted, but they are invalidated. |
| Conditions | One or more metric thresholds, combined with and / or. |
| In Last | How long the conditions must hold before the rule fires. Balance timeliness and noise. |
Notification channels
Every alert rule can push to one or more channels; each channel pushes the alert message independently.
In-site notification and Email — pick the users to notify.
SMS — pick users or enter phone numbers directly.
Slack Group — paste one or more Slack robot webhook URLs (separate multiple URLs with a semicolon ;).
- In Slack, open Apps and search for Incoming WebHooks, then click Add to Slack.
- Choose the channel that should receive alerts and click Add Incoming WebHooks Integration.
- Copy the webhook URL into the alert channel configuration.
Note To restrict message sources, configure a webhook IP allowlist. The VeloDB Cloud server IP is
3.222.235.198.
Webhook — paste a URL to forward alert payloads to any external system that accepts HTTP callbacks. VeloDB Cloud sends a POST request with a JSON body to the URL when an alert fires. Your endpoint must respond with HTTP 200; otherwise the delivery is retried.
PagerDuty — route alerts directly into PagerDuty incidents using a service integration key.
- In PagerDuty, go to Services → Service Directory and open the target service (or create a new one).
- Click the Integrations tab → Add Integration.
- Search for and select Events API V2, then click Create Service.
- Copy the Integration Key shown on the integration detail page.
- Paste the integration key into the alert channel configuration in VeloDB Cloud.
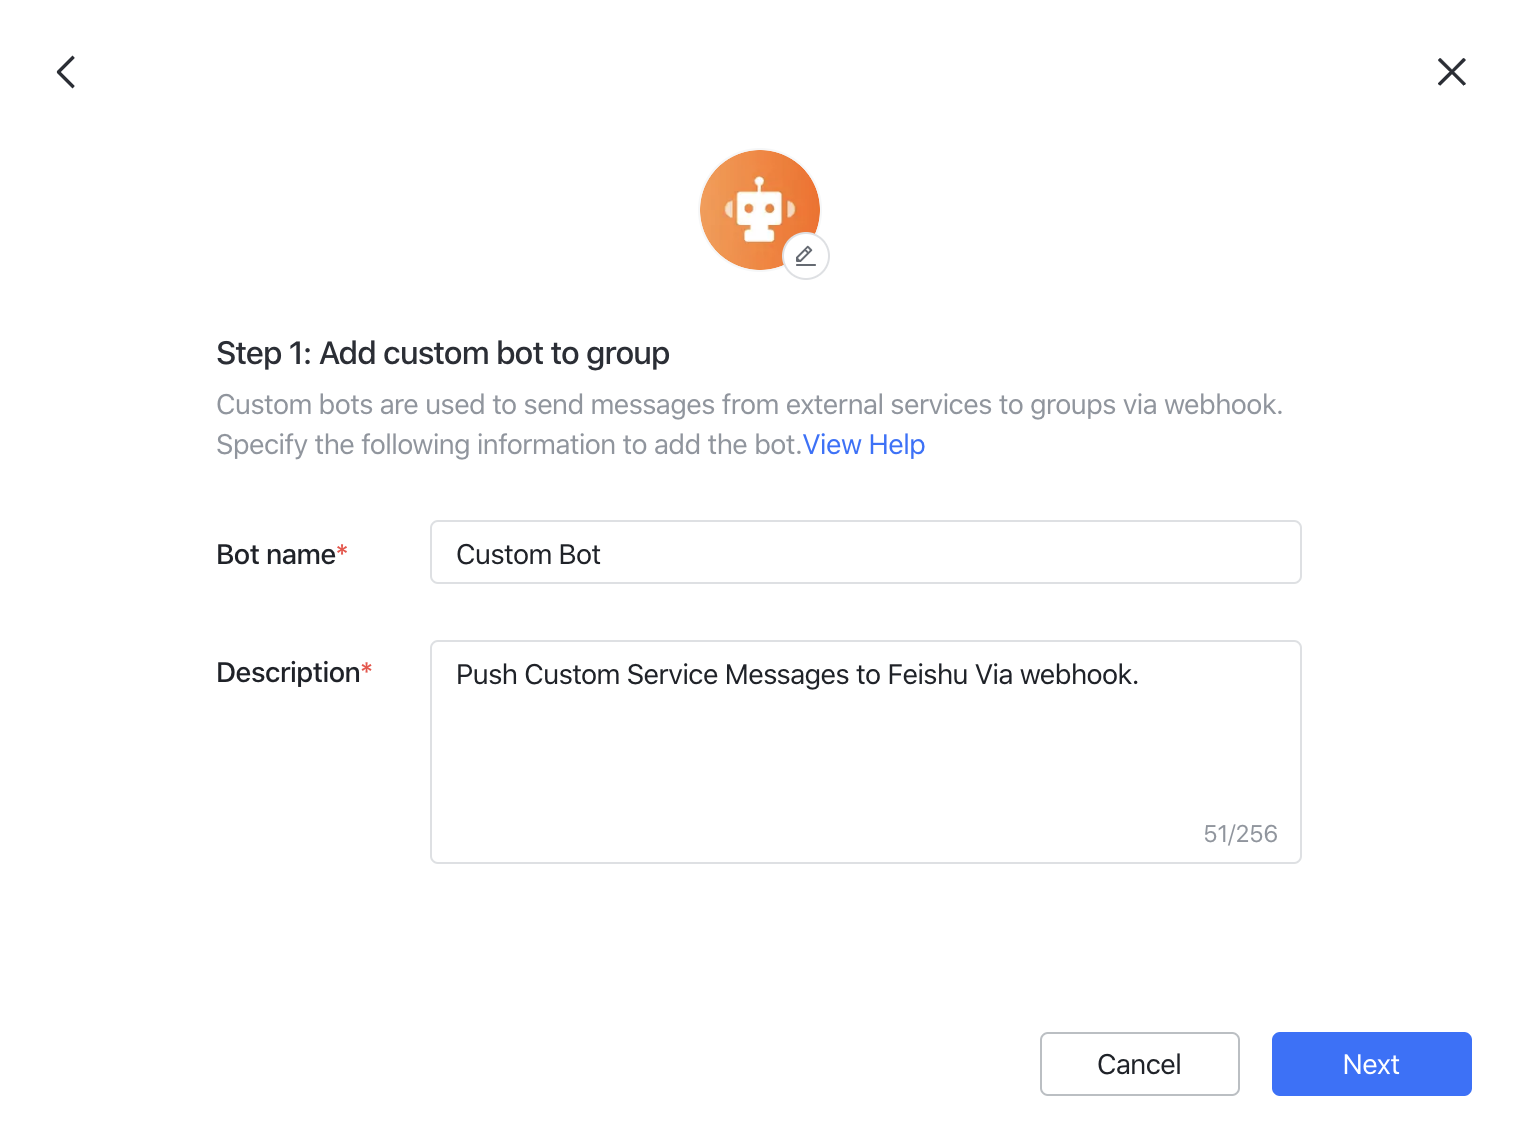
Lark — add a custom bot and paste its webhook URL.
- In the target group, click Settings → BOTs → Add Bot → Custom Bot.
- Give the bot a name and description, click Next.
- Copy the webhook URL into the alert channel configuration.
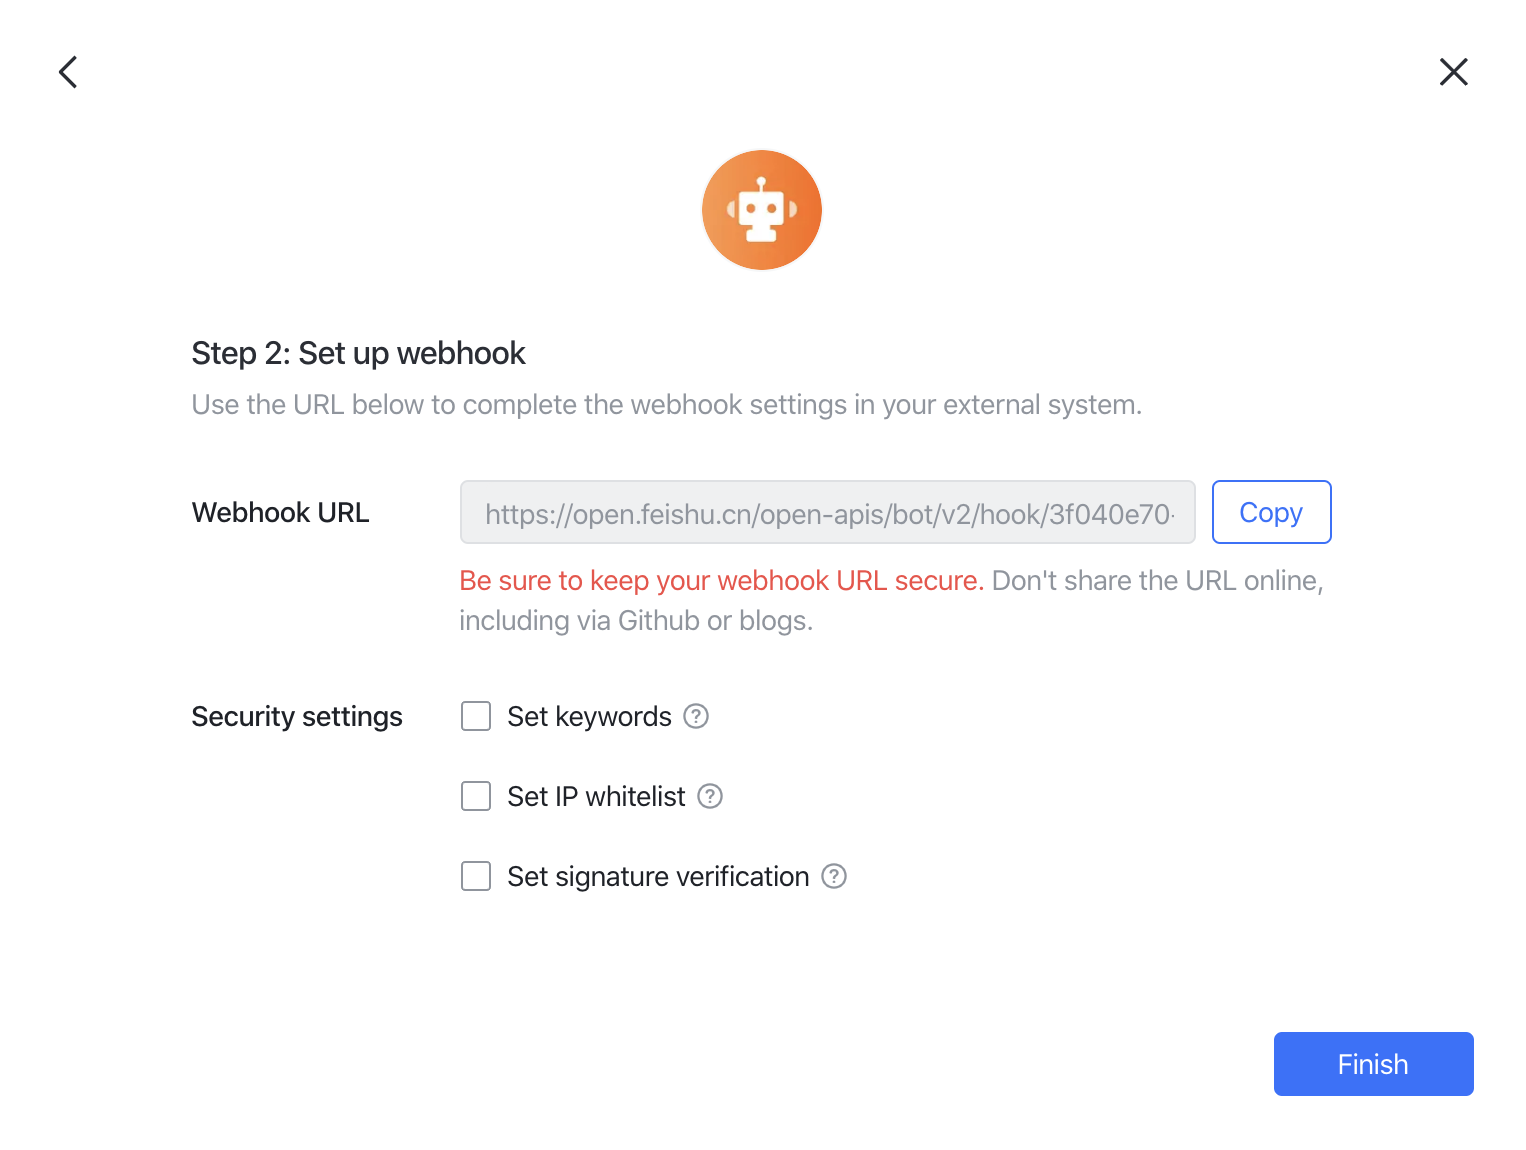
Note To restrict message sources, configure a webhook IP allowlist. The VeloDB Cloud server IP is
3.222.235.198.
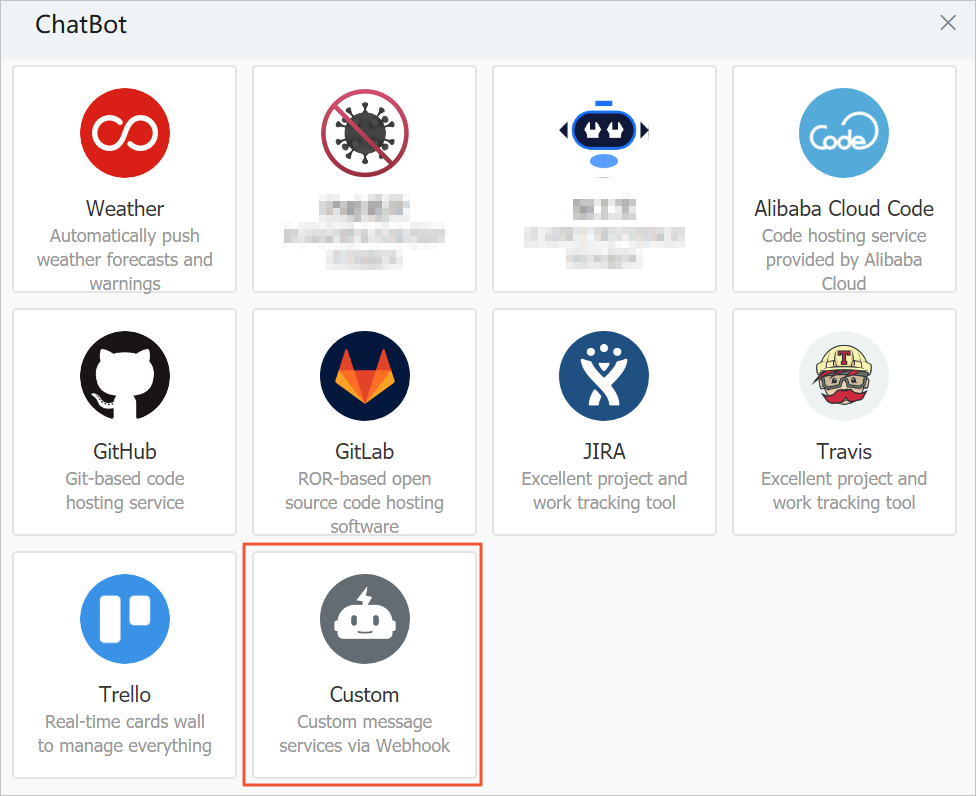
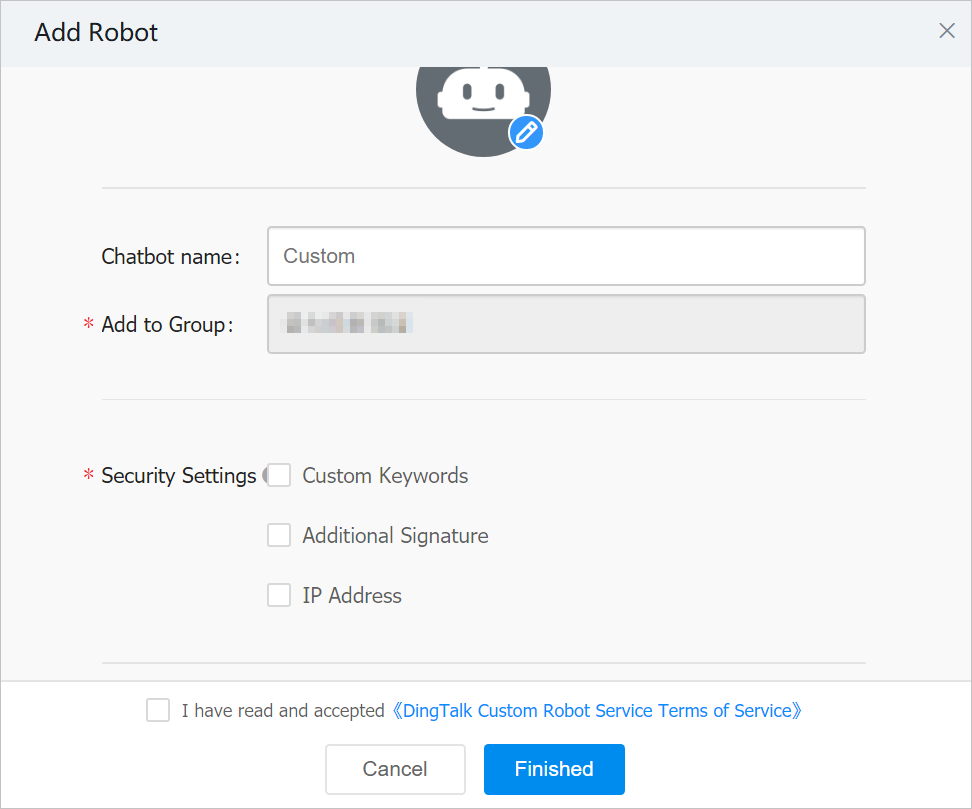
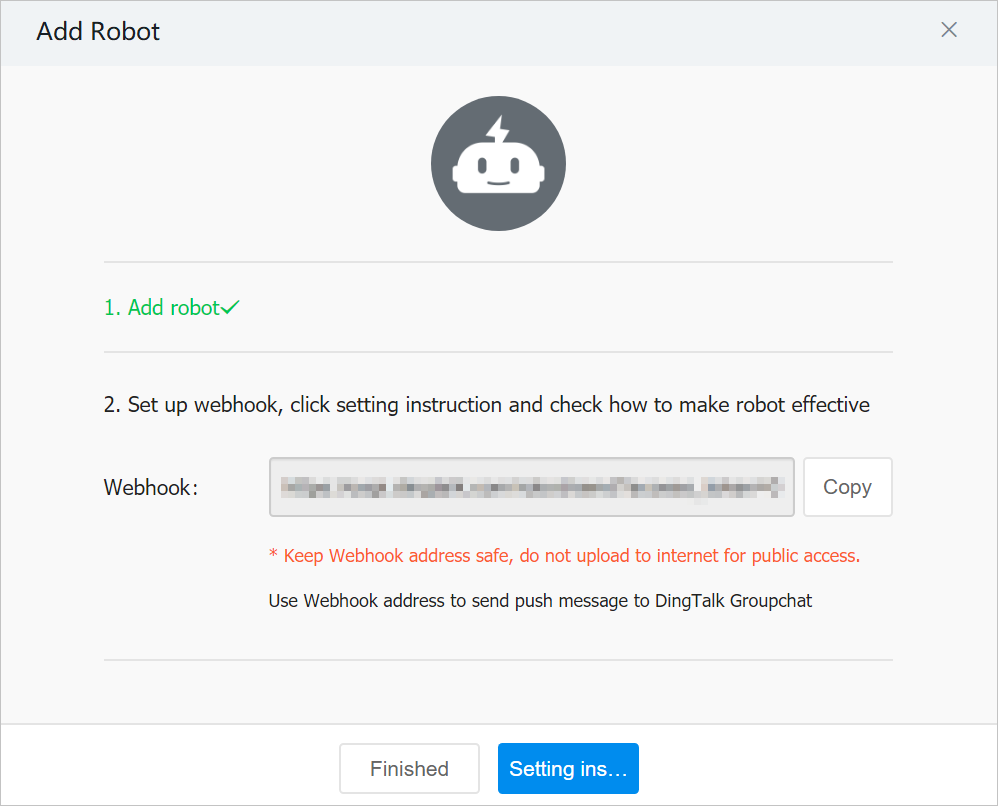
DingTalk — add a custom robot and paste its webhook URL. See DingTalk's guide for the full procedure. In summary:
- In the target DingTalk group, open Group Settings → Group Assistant → Add Robot → Custom.
- Set a profile picture, name, and security settings (use Custom Keywords and enter
alert). - Accept the terms and click Finished.
- Copy the webhook URL into the alert channel configuration.
Note To restrict message sources, configure a webhook IP allowlist. The VeloDB Cloud server IP is
3.222.235.198.
Alert history
You can view the alert firing history on the Alerts page and filter it by time, rule, or cluster.
Query Audit
Query Audit is a one-stop tool for auditing and analyzing queries that have run in the warehouse. Use it to find poor-performing queries, investigate trends, and diagnose individual problems.
Filter historical queries in the list view, and use the List Selection to add more dimensions to your filter.
Click a Query ID to open the query detail page. If profile capture was enabled, the profile is available there.
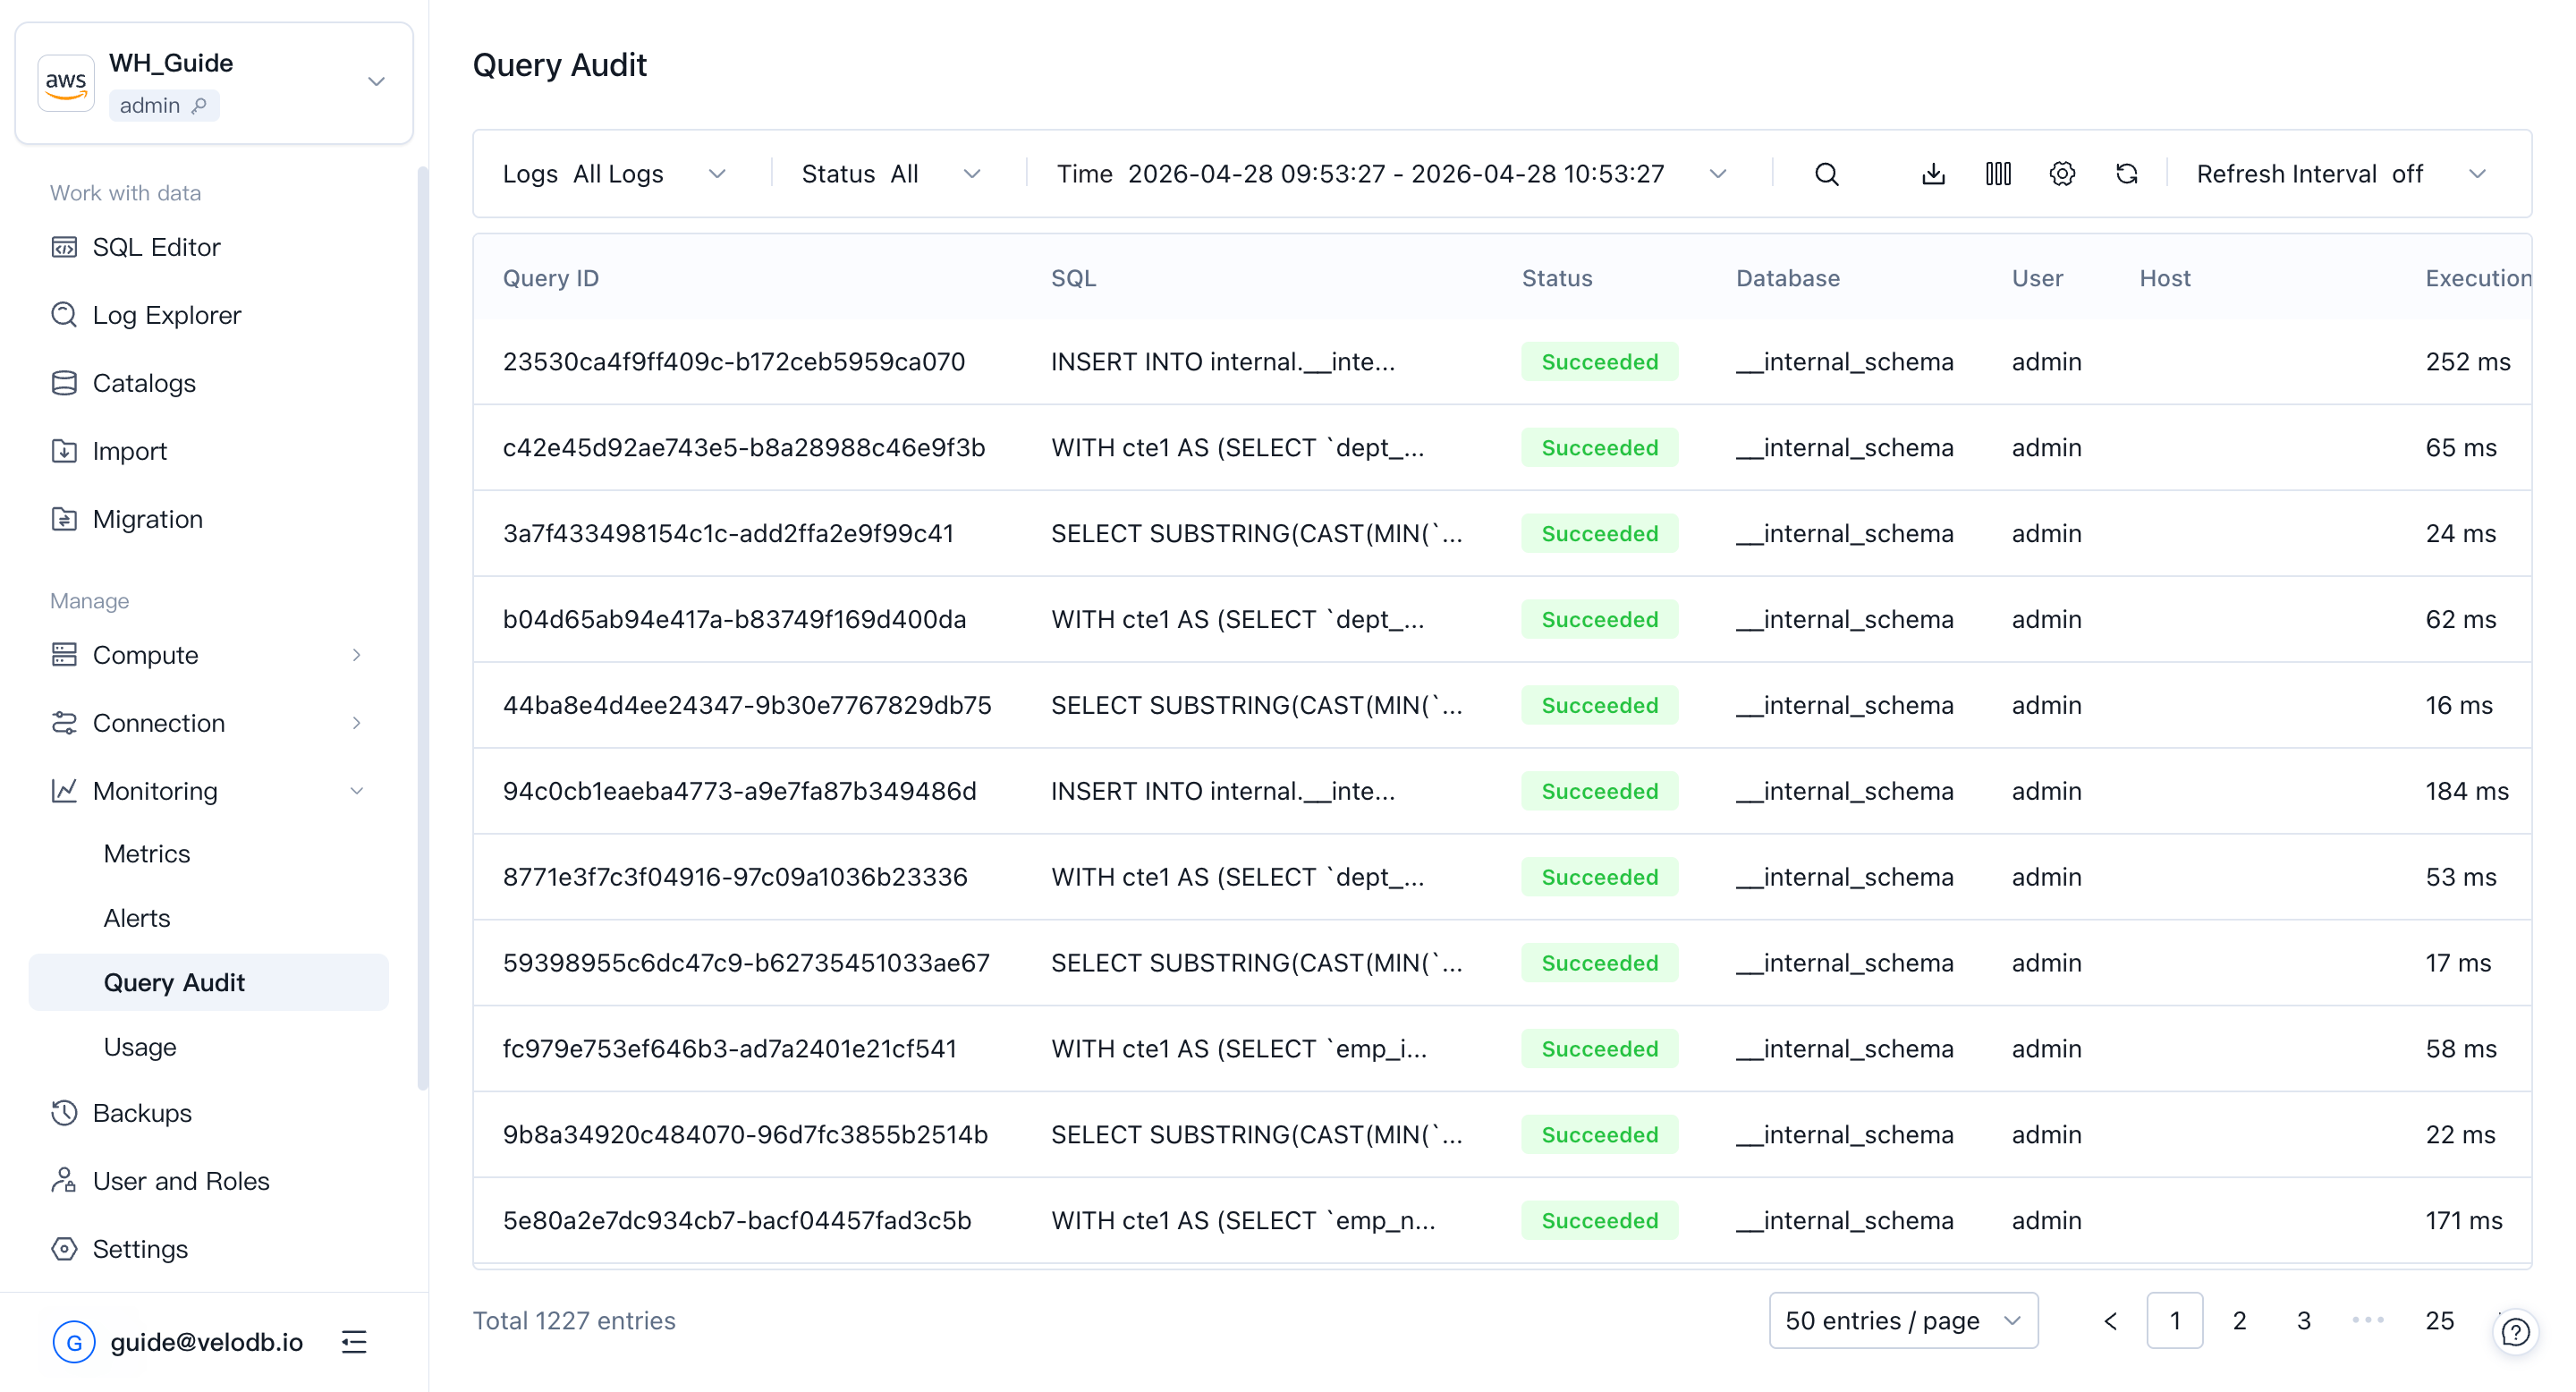
Note Non-query statements and failed statements do not have a Query ID.
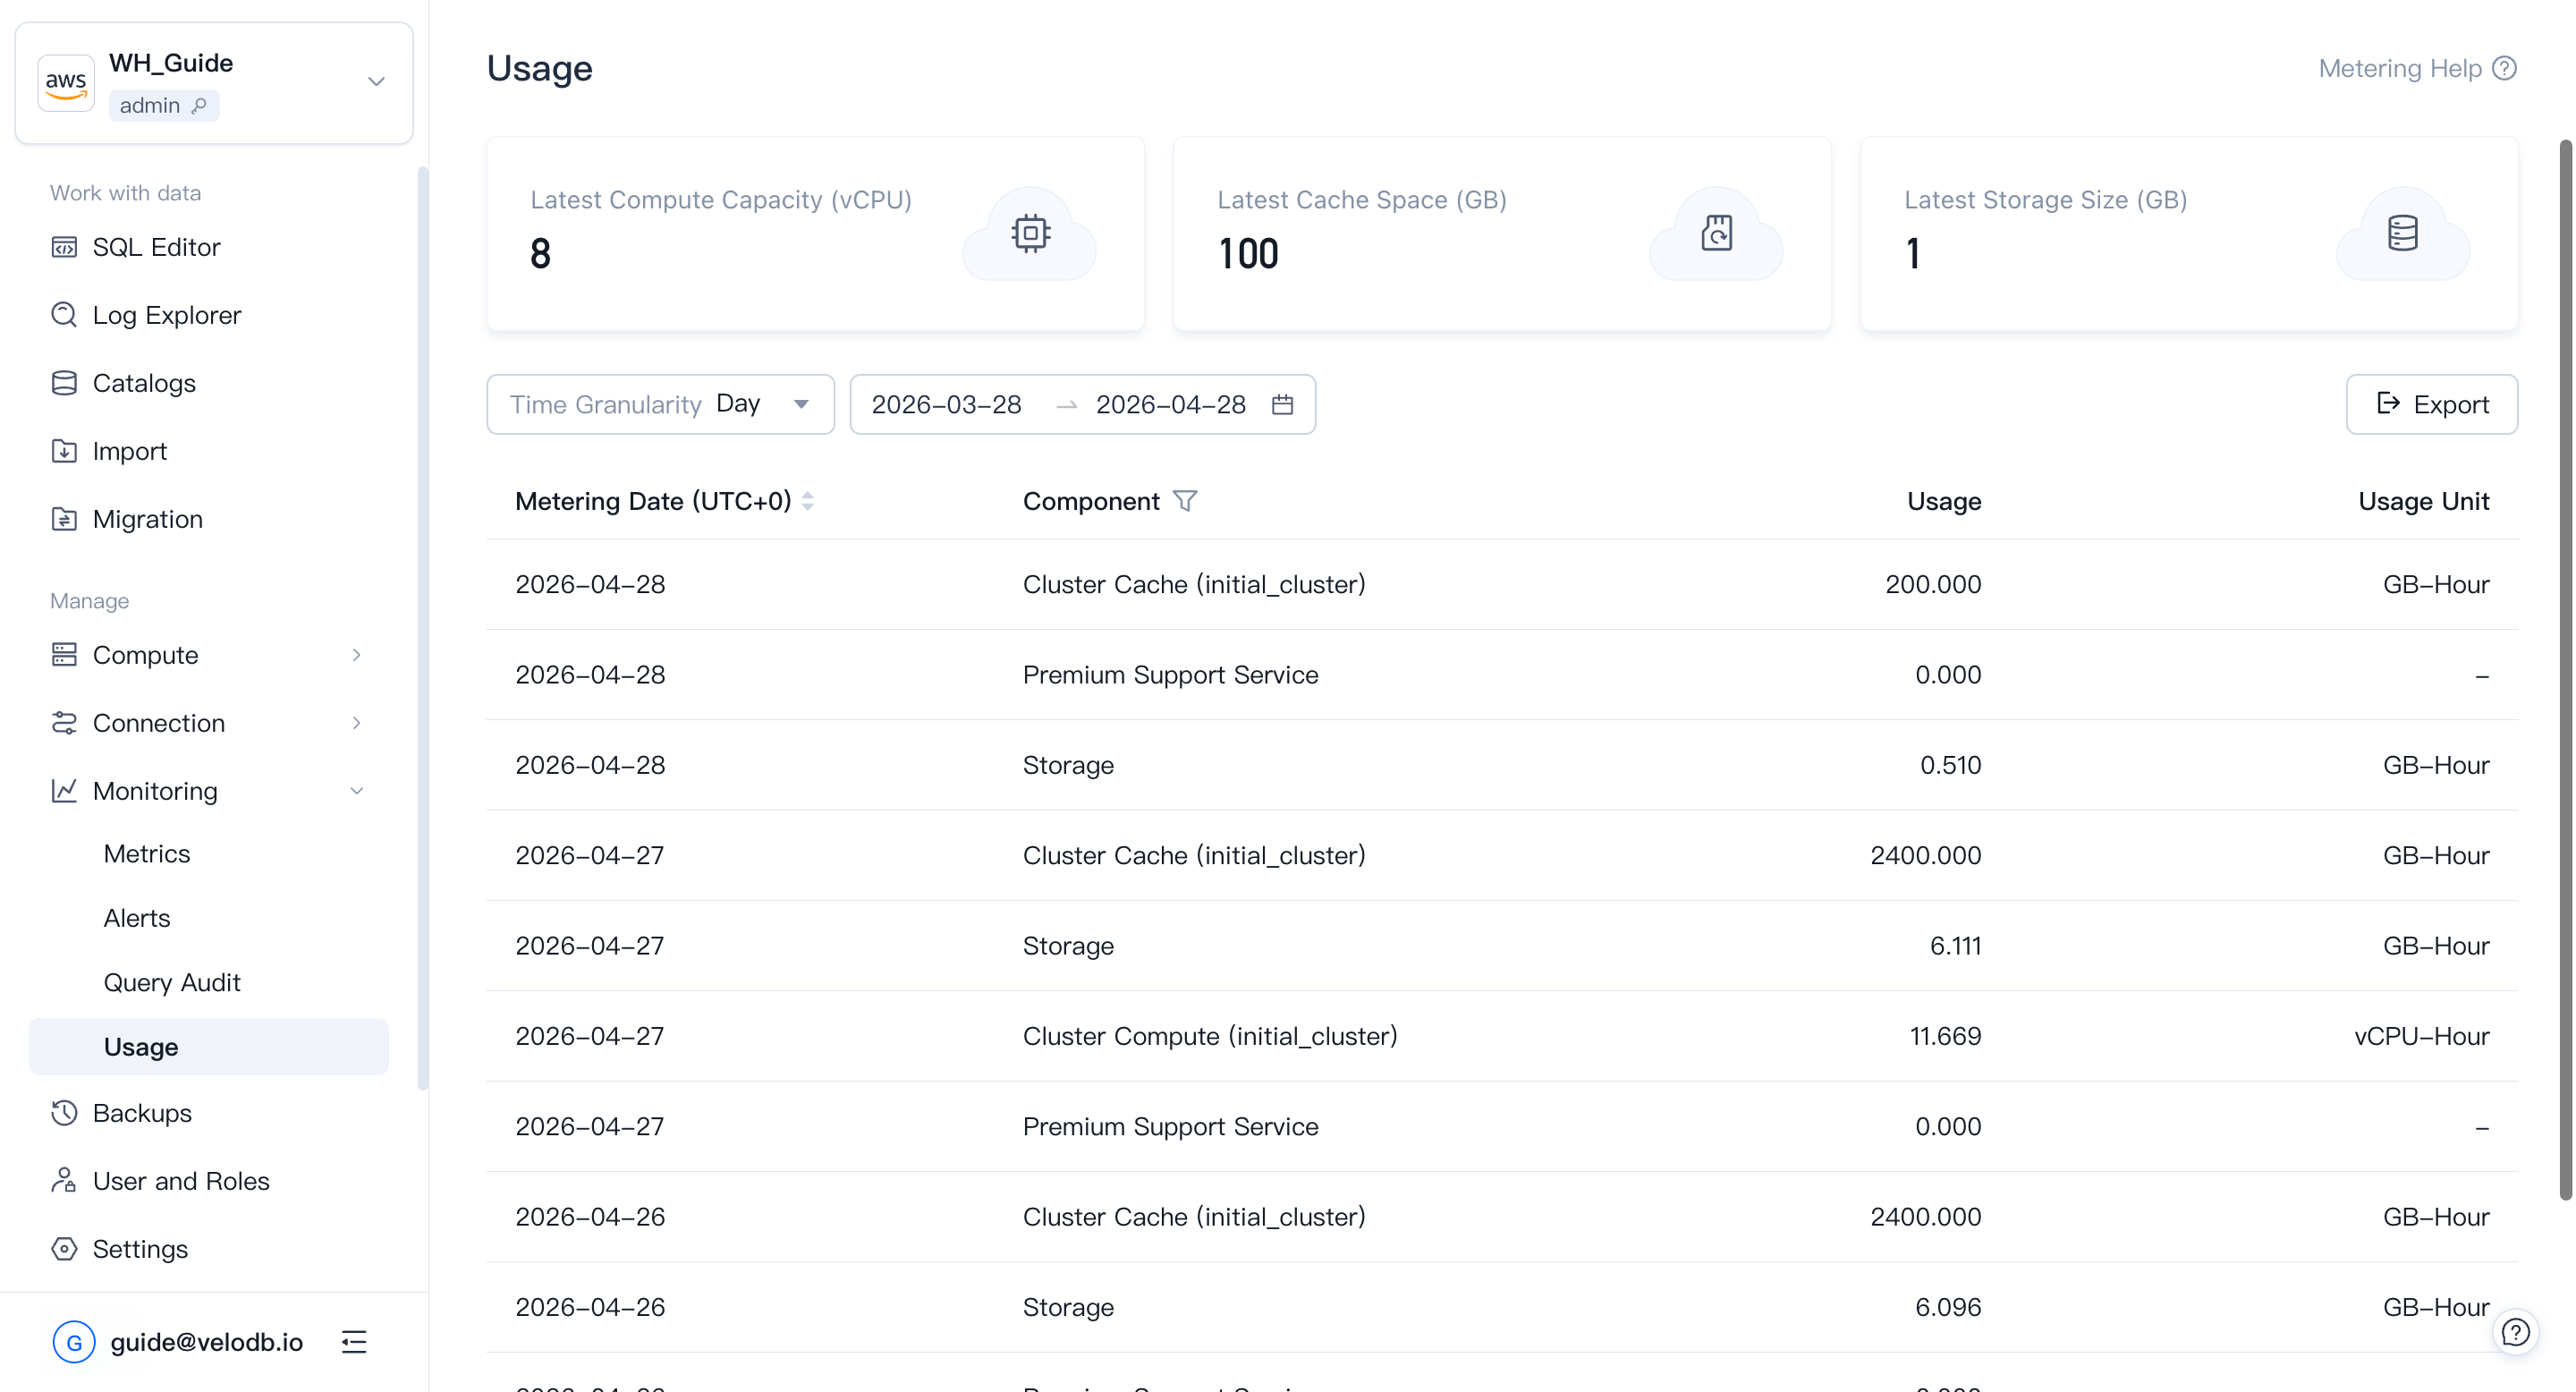
Usage
Usage shows how compute, cache, and storage are being consumed inside the current warehouse, so you can see where the cost is going.
Open Monitoring → Usage from the left navigation.
For organization-level billing and payment channels, see Billing.