Custom Observability
Use VeloDB Cloud as the storage and SQL analysis layer for application logs and distributed traces. Keep your existing collectors, define tables that match your telemetry, and query the data with SQL or a visualization tool such as Grafana.
Choose this approach when you need control over collection, transformation, table design, or visualization. For a walkthrough that combines a collector, VeloDB Cloud, and Grafana, start with DOG Stack.
Architecture and responsibilities
A custom observability pipeline has three layers:
Applications and infrastructure
            |
            v
Collectors and preprocessing that you operate
(OpenTelemetry Collector, Logstash, Filebeat, or Fluent Bit)
            |
            | Stream Load
            v
VeloDB Cloud warehouse
(log and trace tables, indexes, SQL queries)
            |
            | MySQL protocol
            v
Visualization tools that you operate
(Grafana dashboards, trace views, and alerts)
| Layer | Your choices and responsibilities |
|---|---|
| Collection and preprocessing | Instrument applications, deploy collectors, parse logs, choose trace sampling, protect credentials, and monitor delivery failures. |
| Storage and analysis | Create tables, choose indexed fields, set retention, load telemetry, and size warehouse compute for your workload. VeloDB Cloud manages the database service. |
| Visualization and alerting | Configure a SQL-compatible data source, dashboards, trace views, access control, and alert rules. These tools run outside the warehouse. |
This architecture applies to SaaS and BYOC warehouses. The network path and endpoints depend on the deployment. Follow Connect to a Warehouse before configuring a collector or visualization tool.
Note:
These guides describe telemetry from applications and infrastructure that you operate. They do not provide access to the managed warehouse's FE or BE hosts, configuration files, or host log directories.
Choose a collection path
| Source or requirement | Collection path | Start here |
|---|---|---|
| Applications instrumented with OpenTelemetry | Send OTLP to an OpenTelemetry Collector that includes the Doris exporter. | OpenTelemetry integration |
| Existing Logstash pipelines | Keep your inputs and filters, then configure the Doris output plugin to use the warehouse Stream Load endpoint. | Logstash integration |
| File-based logs with Filebeat | Use a Filebeat build that includes the Doris output plugin. Standard Filebeat distributions do not include this output. | Filebeat integration |
| Existing Fluent Bit deployment | Check the Doris output build and its endpoint and TLS compatibility before using it. | Fluent Bit integration |
| Logs already in Kafka | Use Routine Load when the warehouse can reach the Kafka brokers and authenticate to them. | Routine Load |
| A custom collection application | Send batches to Stream Load and inspect the result of every load. | Log storage and analysis |
Plugin names such as doris and output.doris identify Apache Doris-compatible integrations. Keep those configuration names when connecting to VeloDB Cloud.
Design tables for your queries
Start with the fields that you filter or aggregate most often:
- Time: Partition by event time to limit scans and manage retention. Align collector timestamps, the table's partition time zone, and dashboard time ranges.
- Service or host: Keep frequently filtered identifiers in typed columns. A sort key can improve locality for common query patterns.
- Log text: Add an inverted index with a text parser for token and phrase searches.
- Trace identifiers: Store trace and span identifiers so that you can find a complete request and correlate it with logs.
- Variable attributes: Use
VARIANTfor attributes whose keys change between events. Keep stable fields that are important to queries in explicit columns.
Each index consumes storage and adds work during ingestion. Index fields that your workload uses, then measure load throughput, query latency, and storage growth with representative data. See Log storage and analysis and Trace storage and analysis for schema examples.
Evaluate capacity and cost
Use your own workload to compare alternatives. Results depend on event size, retention, indexing, query concurrency, sampling, batch size, and warehouse compute. Upstream Apache Doris benchmark results do not establish performance or cost for your VeloDB Cloud warehouse.
| Measure | How to use it |
|---|---|
| Average and peak ingestion rate | Include bursts and collector retry traffic when sizing compute. |
| Compressed table and index size | Estimate retained storage from a representative sample. Include indexes in the measurement. |
| Time until events become queryable | Measure the complete path, including collection, batching, transmission, and publication. |
| Query latency and concurrency | Test keyword searches, recent-event queries, aggregations, and trace lookups while ingestion is running. |
| Collector queue growth and failures | Check whether collectors can absorb an outage and recover without exceeding the warehouse's capacity. |
Retention and trace sampling determine how much data you store. Shorter batches can improve freshness but increase request overhead. Larger batches use more collector memory and can increase delay. Select settings from measured behavior rather than treating a fixed batch size as a universal recommendation.
Warehouse compute and storage are billable. Collectors, visualization tools, and network transfer can incur separate costs in your cloud account. Review Billing, set a retention policy before continuous ingestion, and remove test data and unused resources after a trial.
Query and visualize telemetry
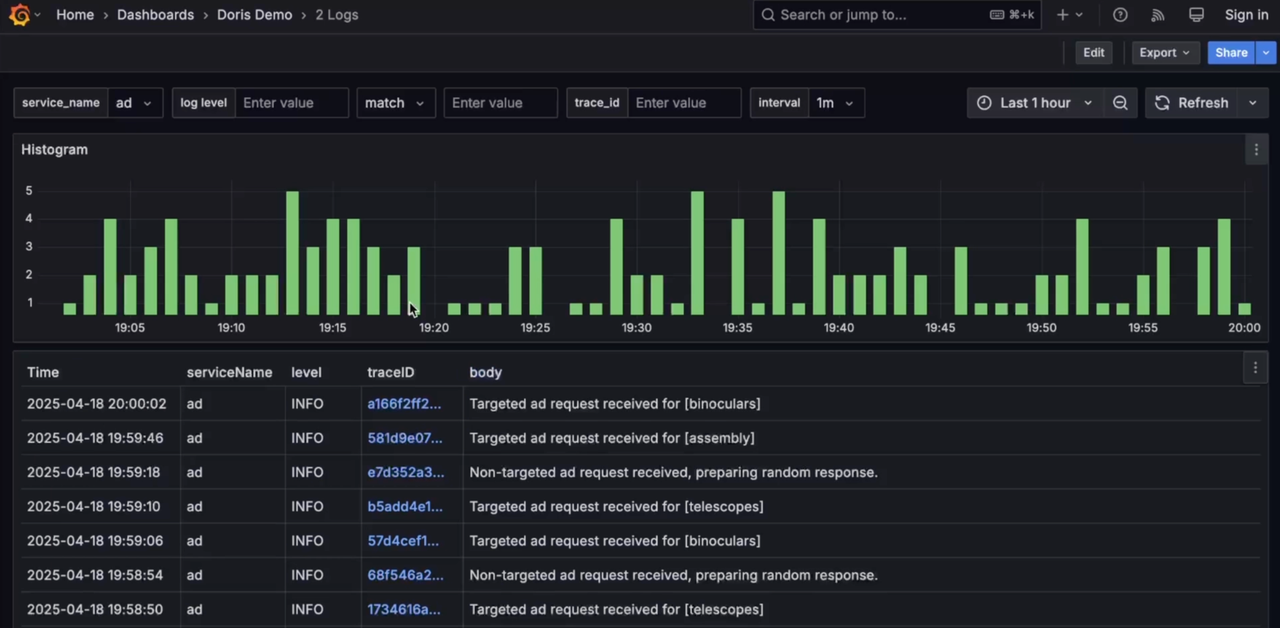
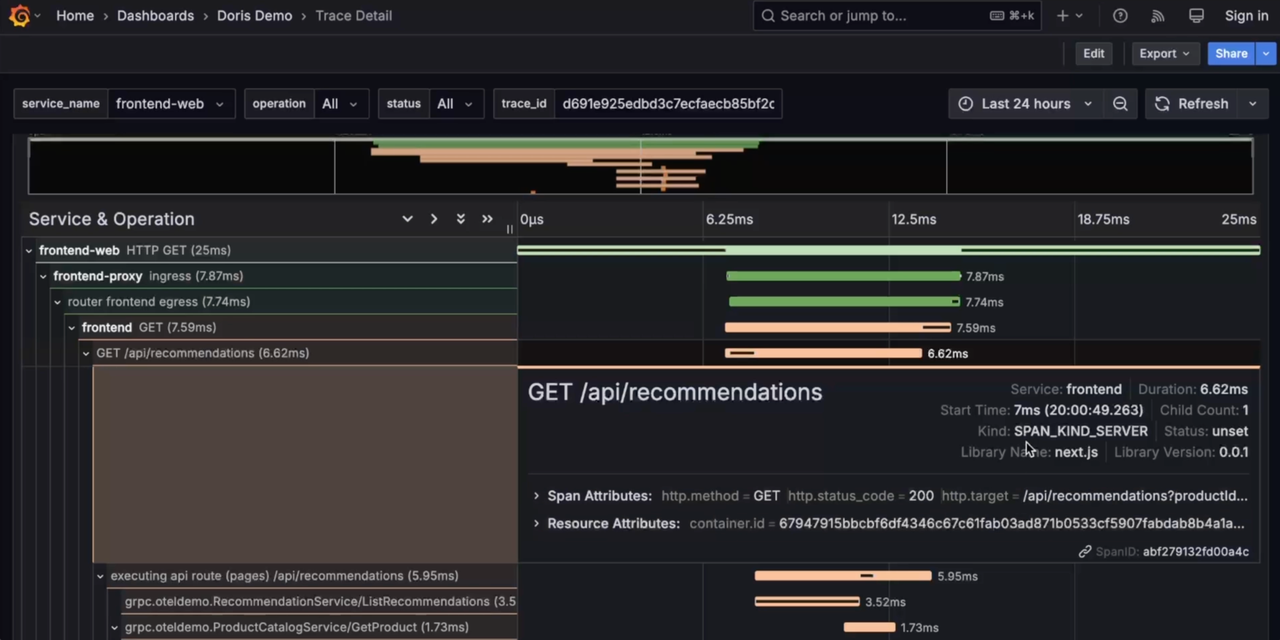
Use SQL to search log text, aggregate events over time, and join telemetry with other data in the warehouse. Grafana can query the warehouse through a compatible data source. Trace views require queries and field mappings that match your trace schema.
The following screenshots illustrate log and trace analysis. The exact controls depend on the visualization tool and plugin version that you deploy.
OpenTelemetry also defines metrics. Before adding a metrics pipeline, verify the exporter's supported metric types and the target schema for the Collector version you use. The guides in this section focus on logs and traces.