Observability Quickstart
Experience a complete observability stack - logs, traces, and metrics - all powered by VeloDB.
Prerequisites
- Docker and Docker Compose installed
- VeloDB Cloud account - Sign up free and follow the Quick Start Guide to create a warehouse
- MySQL client - For creating the database
Finding Your VeloDB Connection Details
After creating your warehouse in VeloDB Cloud:
- Go to your warehouse in the VeloDB Console
- Click Connection to find:
- Host - Your cluster endpoint (e.g.,
xxx.velodb.io) - MySQL Port - Usually
9030 - HTTP Port - Usually
8080
- Host - Your cluster endpoint (e.g.,
- Click Settings to get or reset your
adminpassword
What You'll Experience
Search Logs Like Kibana
 Full-text search with Lucene-like syntax, histogram visualization, and field analysis
Explore Distributed Traces
 See all traces across your microservices, filter by duration, service, or status
Drill Into Any Request
 Full waterfall view showing every service hop with timing breakdown
Quick Setup (5 minutes)
1. Download
mkdir velodb-observability && cd velodb-observability
curl -O https://raw.githubusercontent.com/velodb/velodb-tutorials/main/observability/docker-compose.yaml
This single file includes everything - the Grafana image has dashboards and the Doris App plugin pre-packaged.
2. Configure
Create a .env file (copy-paste and edit):
VELODB_HOST=your-cluster.velodb.io
VELODB_USER=admin
VELODB_PASSWORD=your-password
VELODB_DATABASE=observability
VELODB_MYSQL_PORT=9030
VELODB_HTTP_PORT=8080
VELODB_TIMEZONE=America/Los_Angeles
DATA_RETENTION_DAYS=7
REPLICATION_NUM=1
Set VELODB_TIMEZONE to your local timezone (America/New_York, Europe/London, Asia/Tokyo, etc.) to ensure correct time display in Grafana.
3. Create Database
source .env && mysql -h $VELODB_HOST -P ${VELODB_MYSQL_PORT:-9030} -u $VELODB_USER -p -e "CREATE DATABASE IF NOT EXISTS $VELODB_DATABASE"
4. Start
docker compose --profile demo up -d
This starts the demo e-commerce app with 15+ microservices plus Grafana.
5. Verify It's Working
Wait 1-2 minutes for services to start, then check:
# Check all containers are running
docker compose --profile demo ps

# Verify data is flowing to VeloDB
docker logs otel-collector 2>&1 | grep -E "LOG|METRIC"
You should see output like:
[LOG] total 0 MB 1234 ROWS, total speed 0 MB/s 41 R/s
[METRIC] total 0 MB 567 ROWS, total speed 0 MB/s 18 R/s
Part 1: Explore the Demo Store
Open http://localhost:8080 to see the e-commerce storefront:
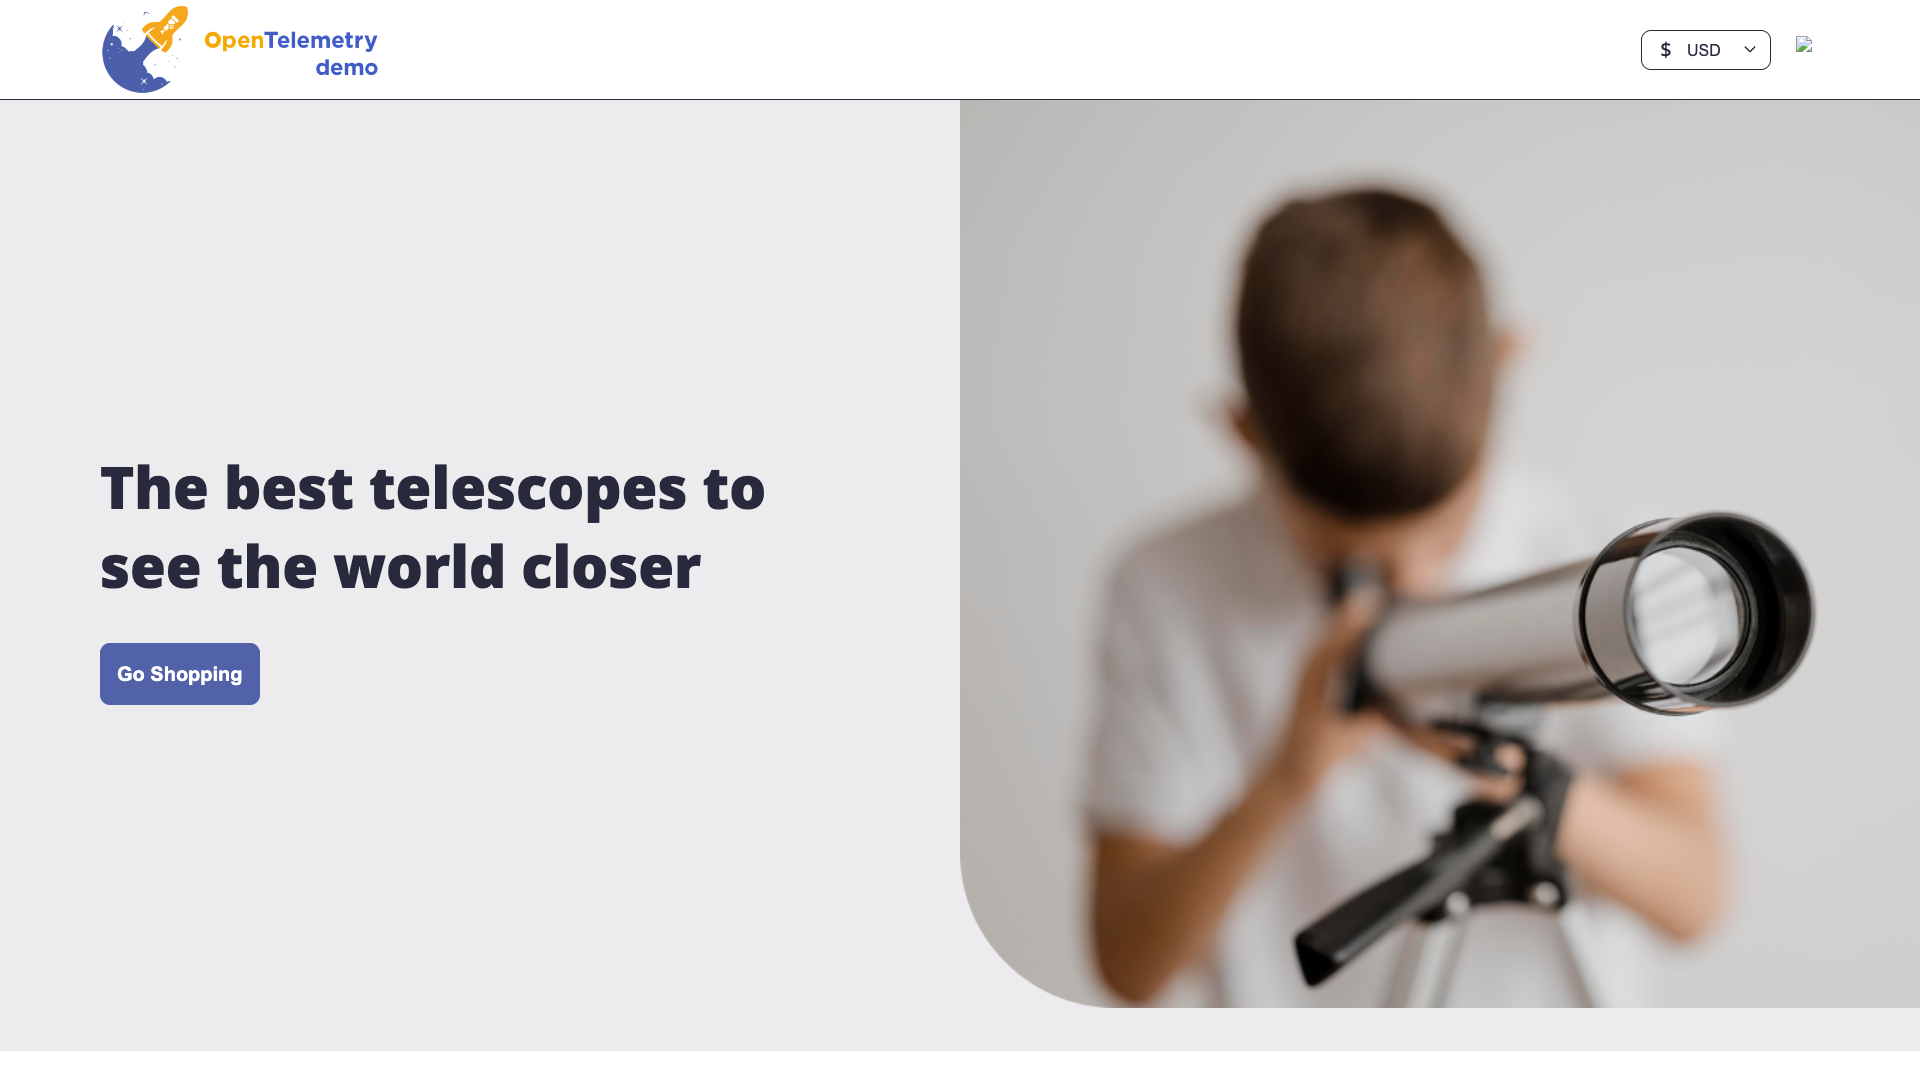
Try these actions to generate telemetry:
- Browse product categories
- Add items to your cart
- Go through checkout
- Search for products
Every click generates logs, traces, and metrics that flow into VeloDB.
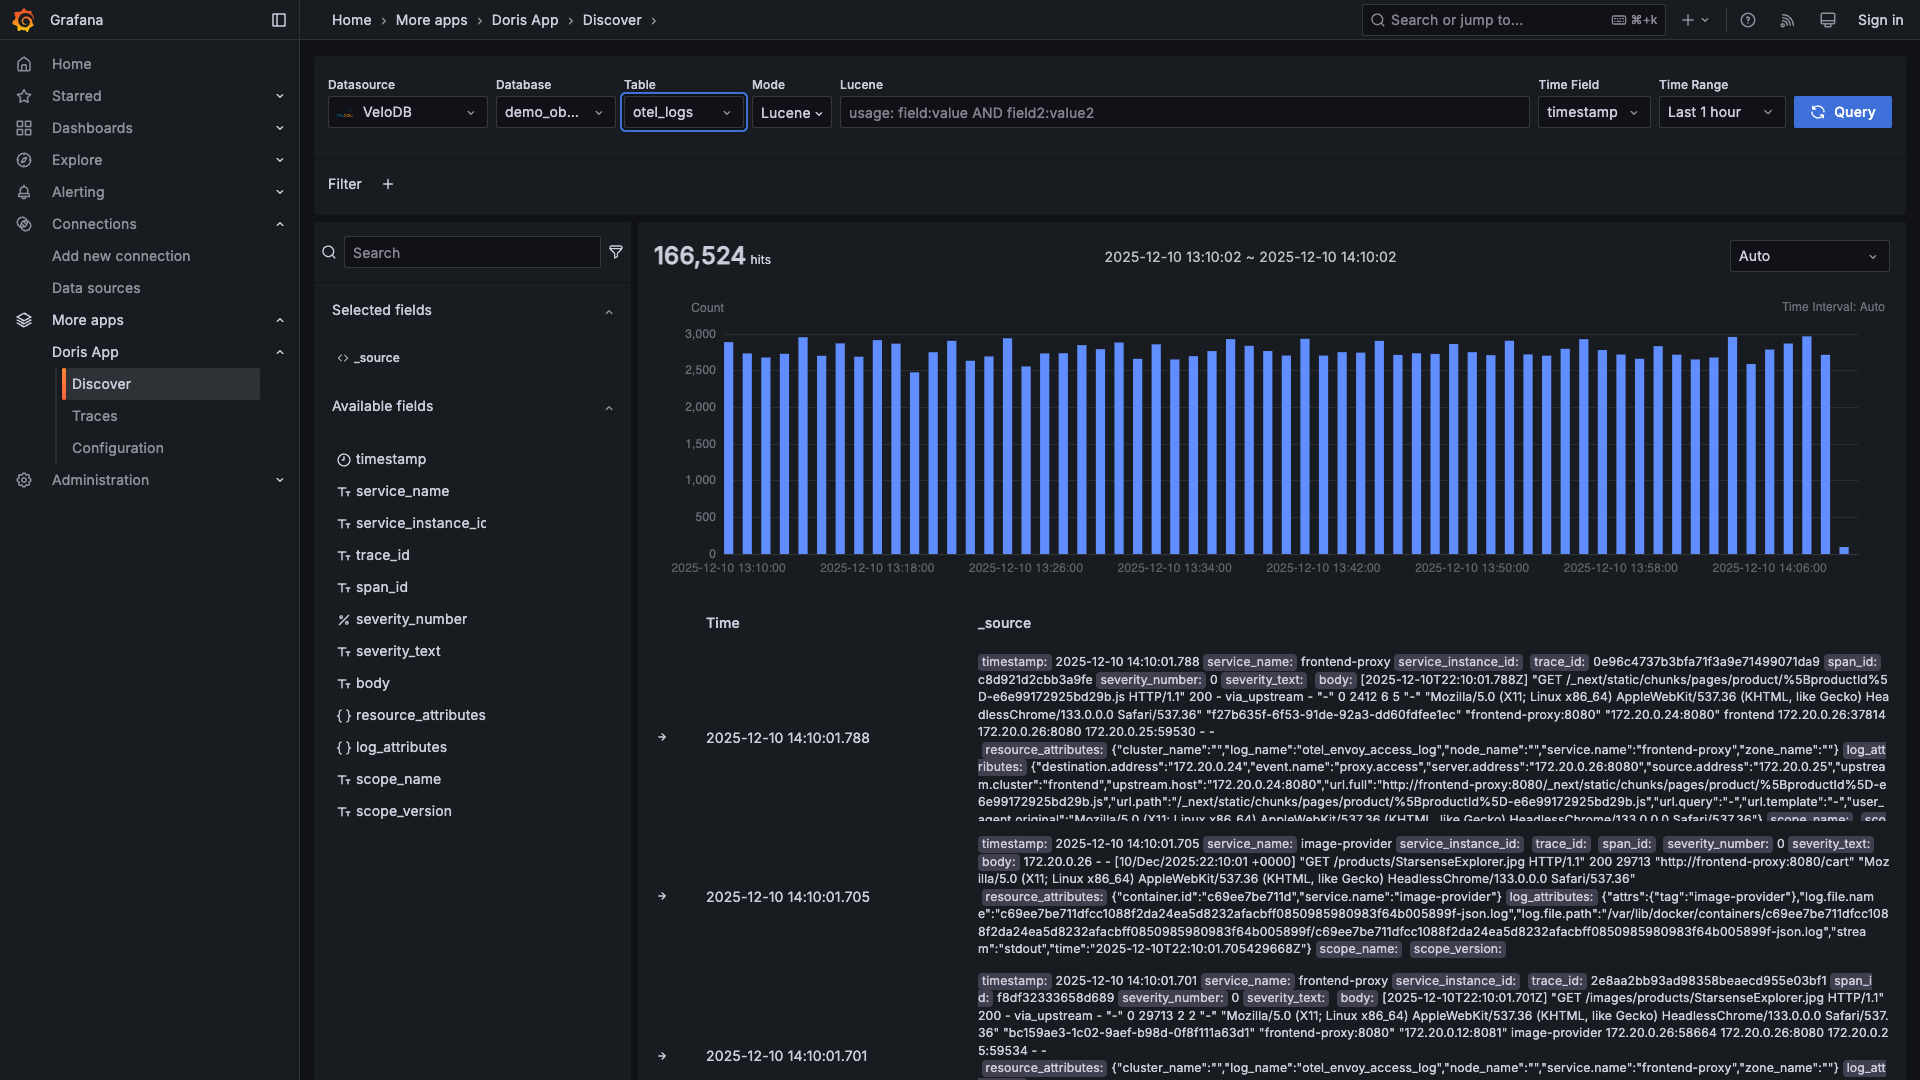
Part 2: Discover Logs
Open http://localhost:3000 → Apps → Doris App → Discover
If you see "0 hits", wait 30 seconds after browsing the store for telemetry data to flow into VeloDB.
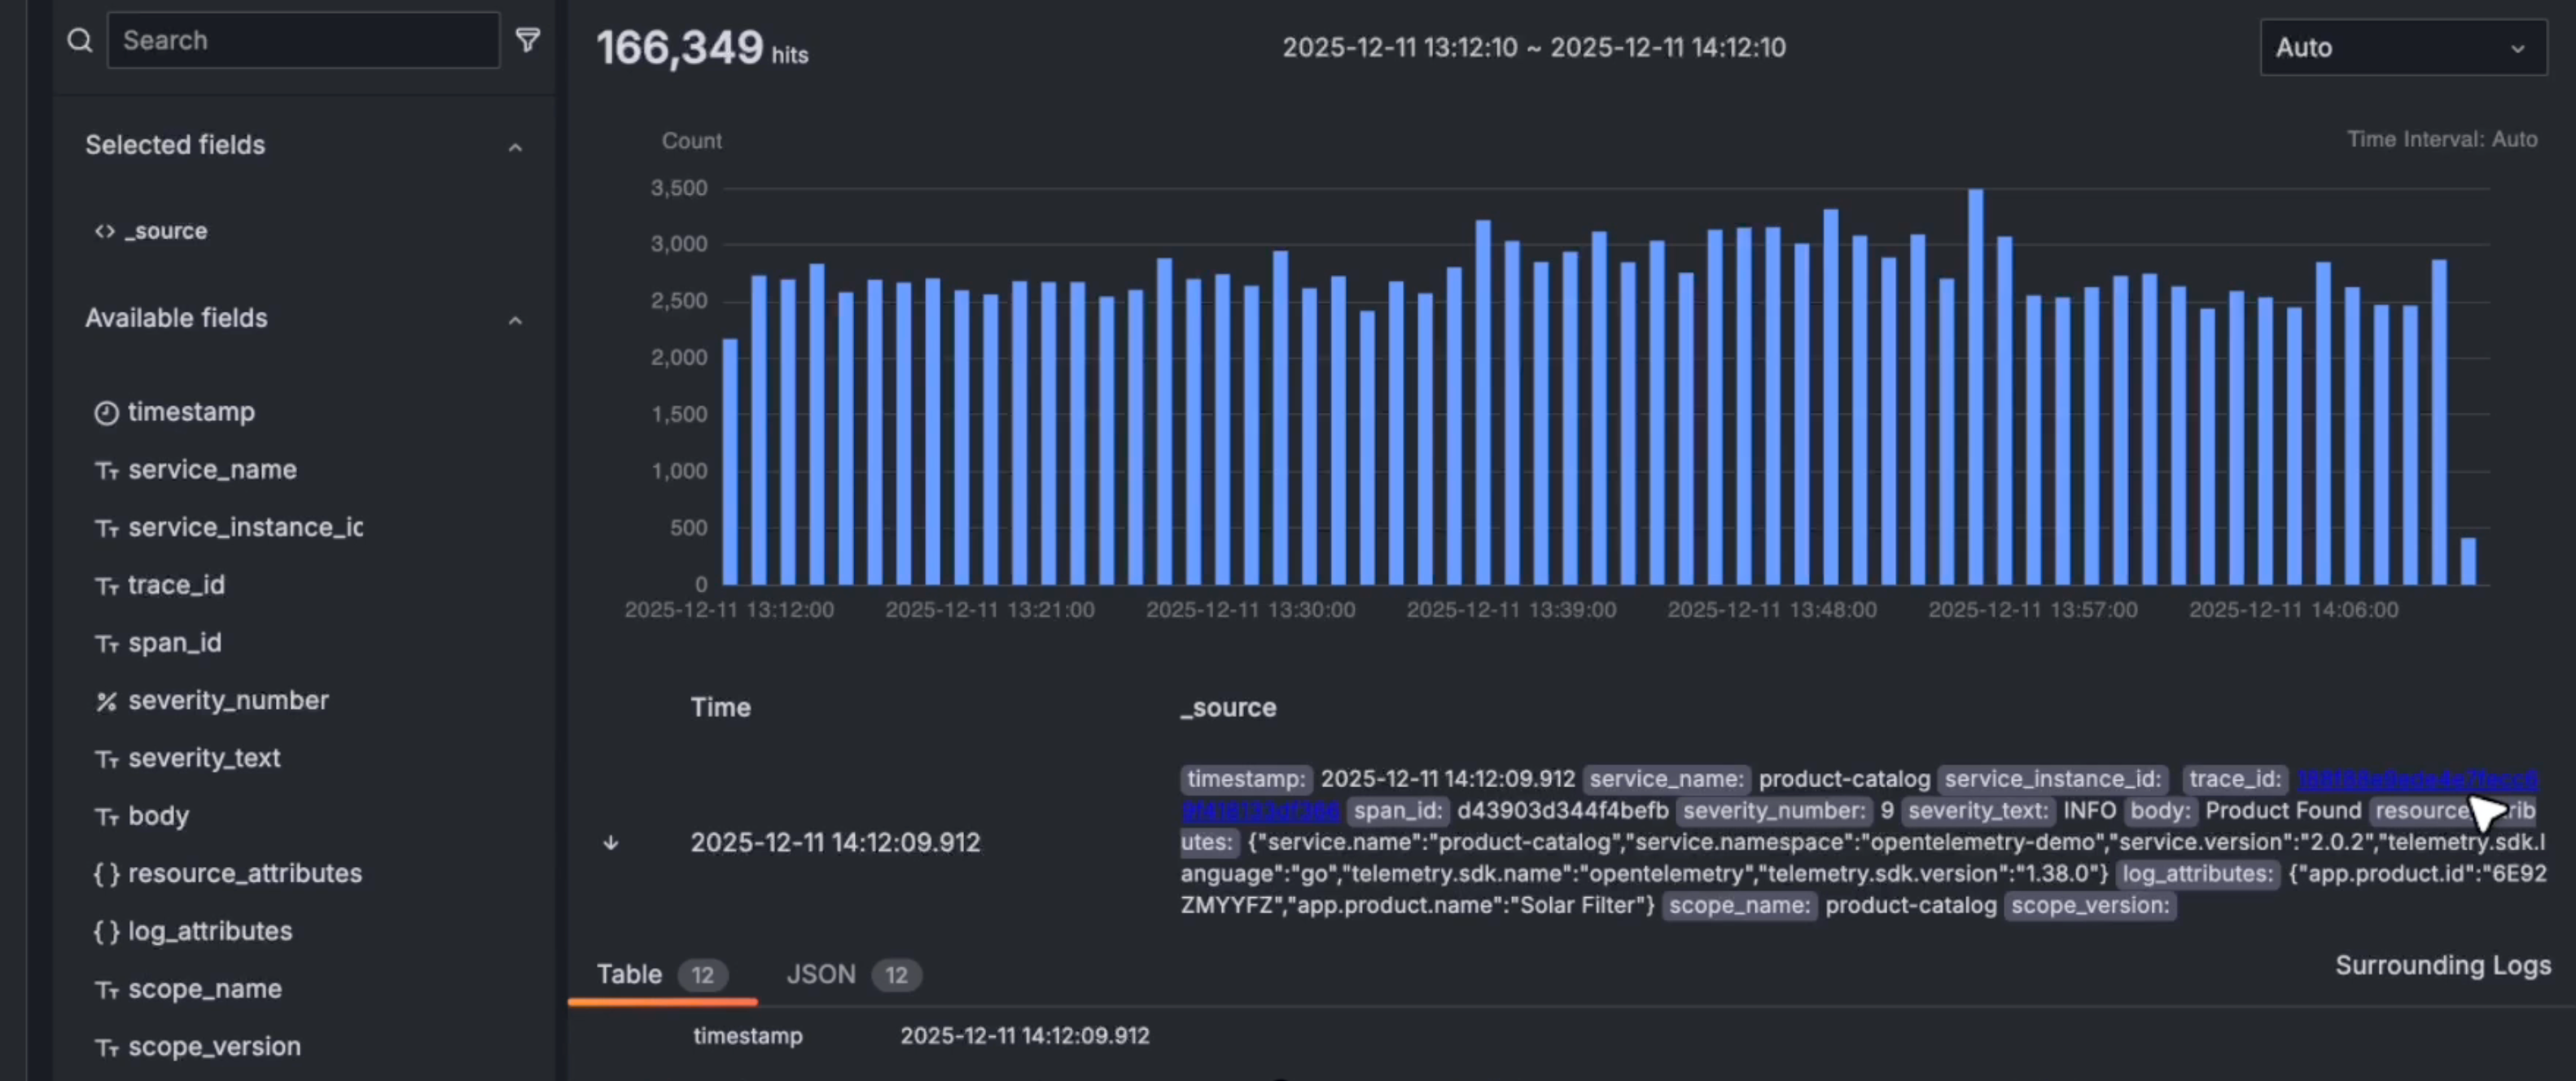
See Your Logs
Select your database and otel_logs table. You'll see a histogram of log volume over time:
Search with Full-Text Queries
Type queries in the search bar - supports Lucene-like syntax:
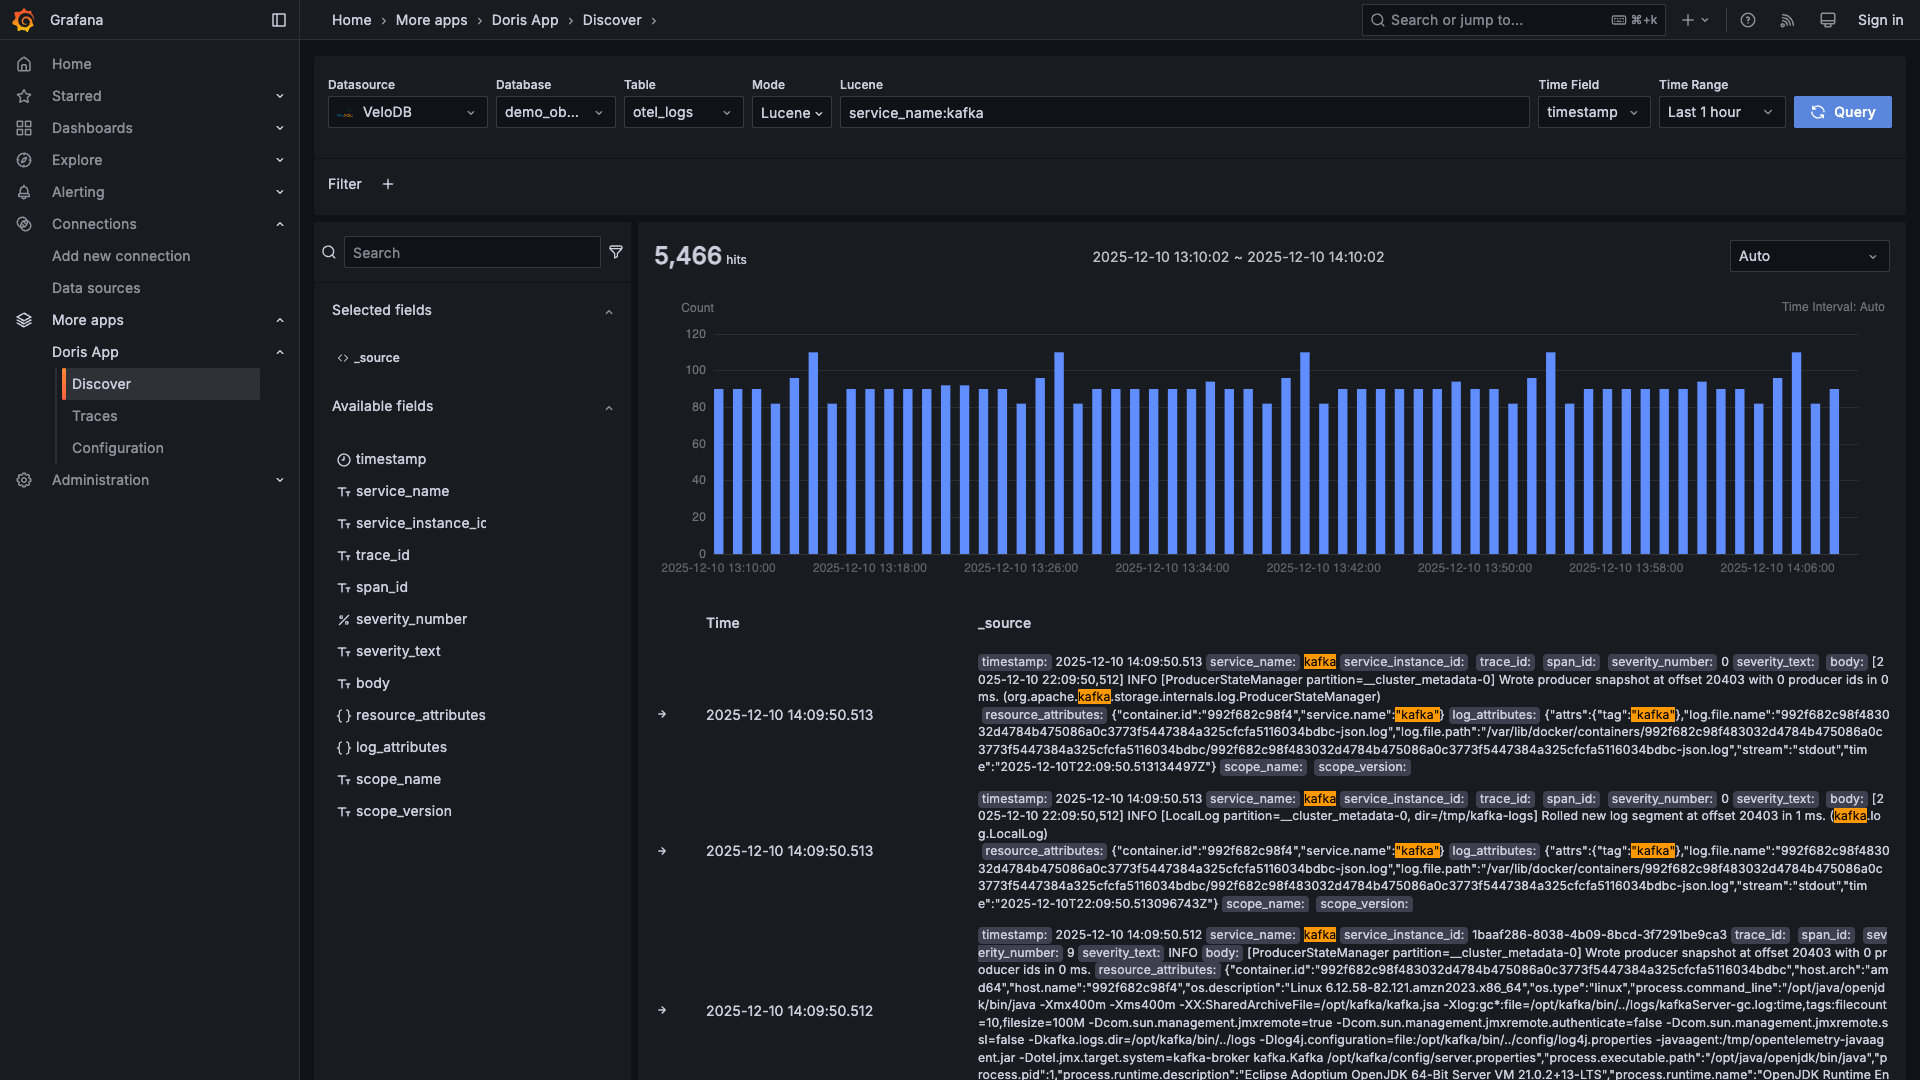
Try these queries:
| Query | What it finds |
|---|---|
severity_text:ERROR | All errors |
service_name:frontend | Frontend service logs |
"failed to connect" | Exact phrase match |
status_code:[500 TO 599] | Server errors |
service_name:cart AND severity_text:WARN | Cart warnings |
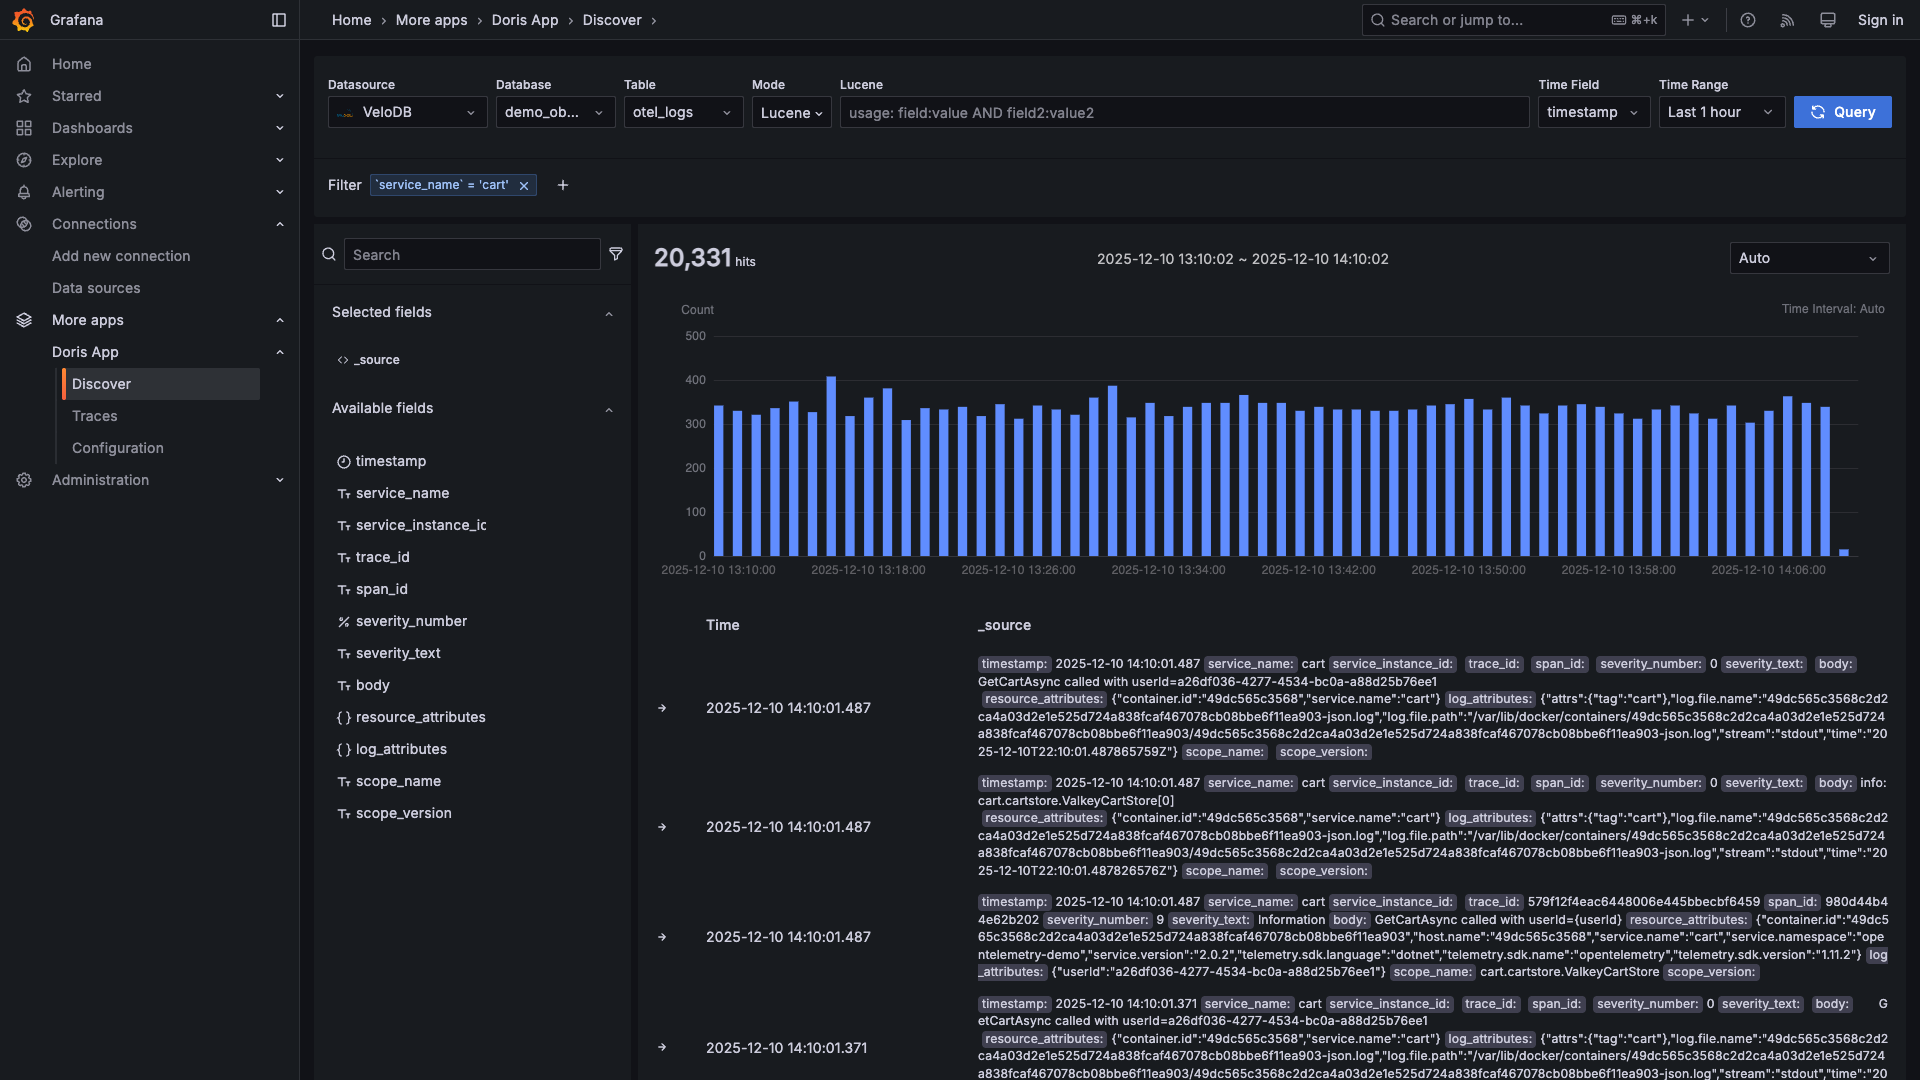
Filter by Clicking
Click any field value to instantly filter:
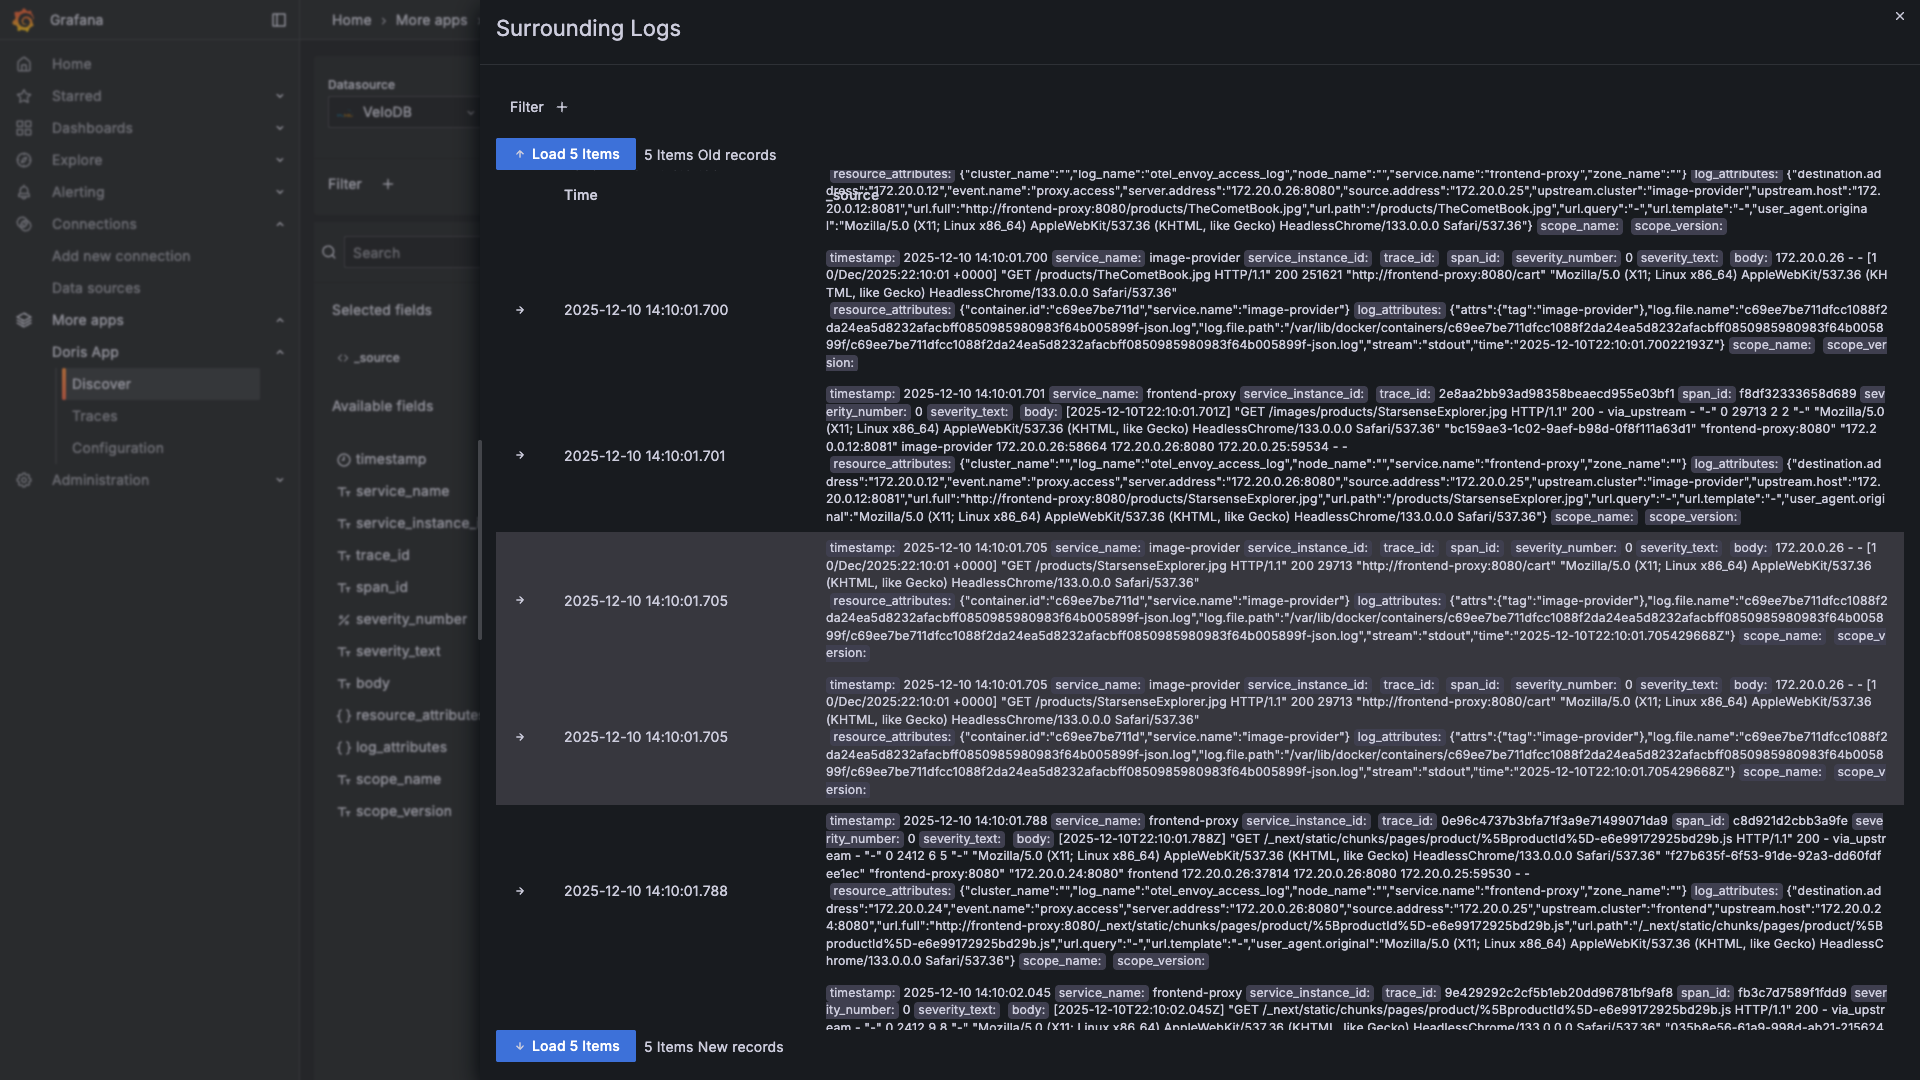
Expand Log Details
Click any log to see all fields and surrounding context:
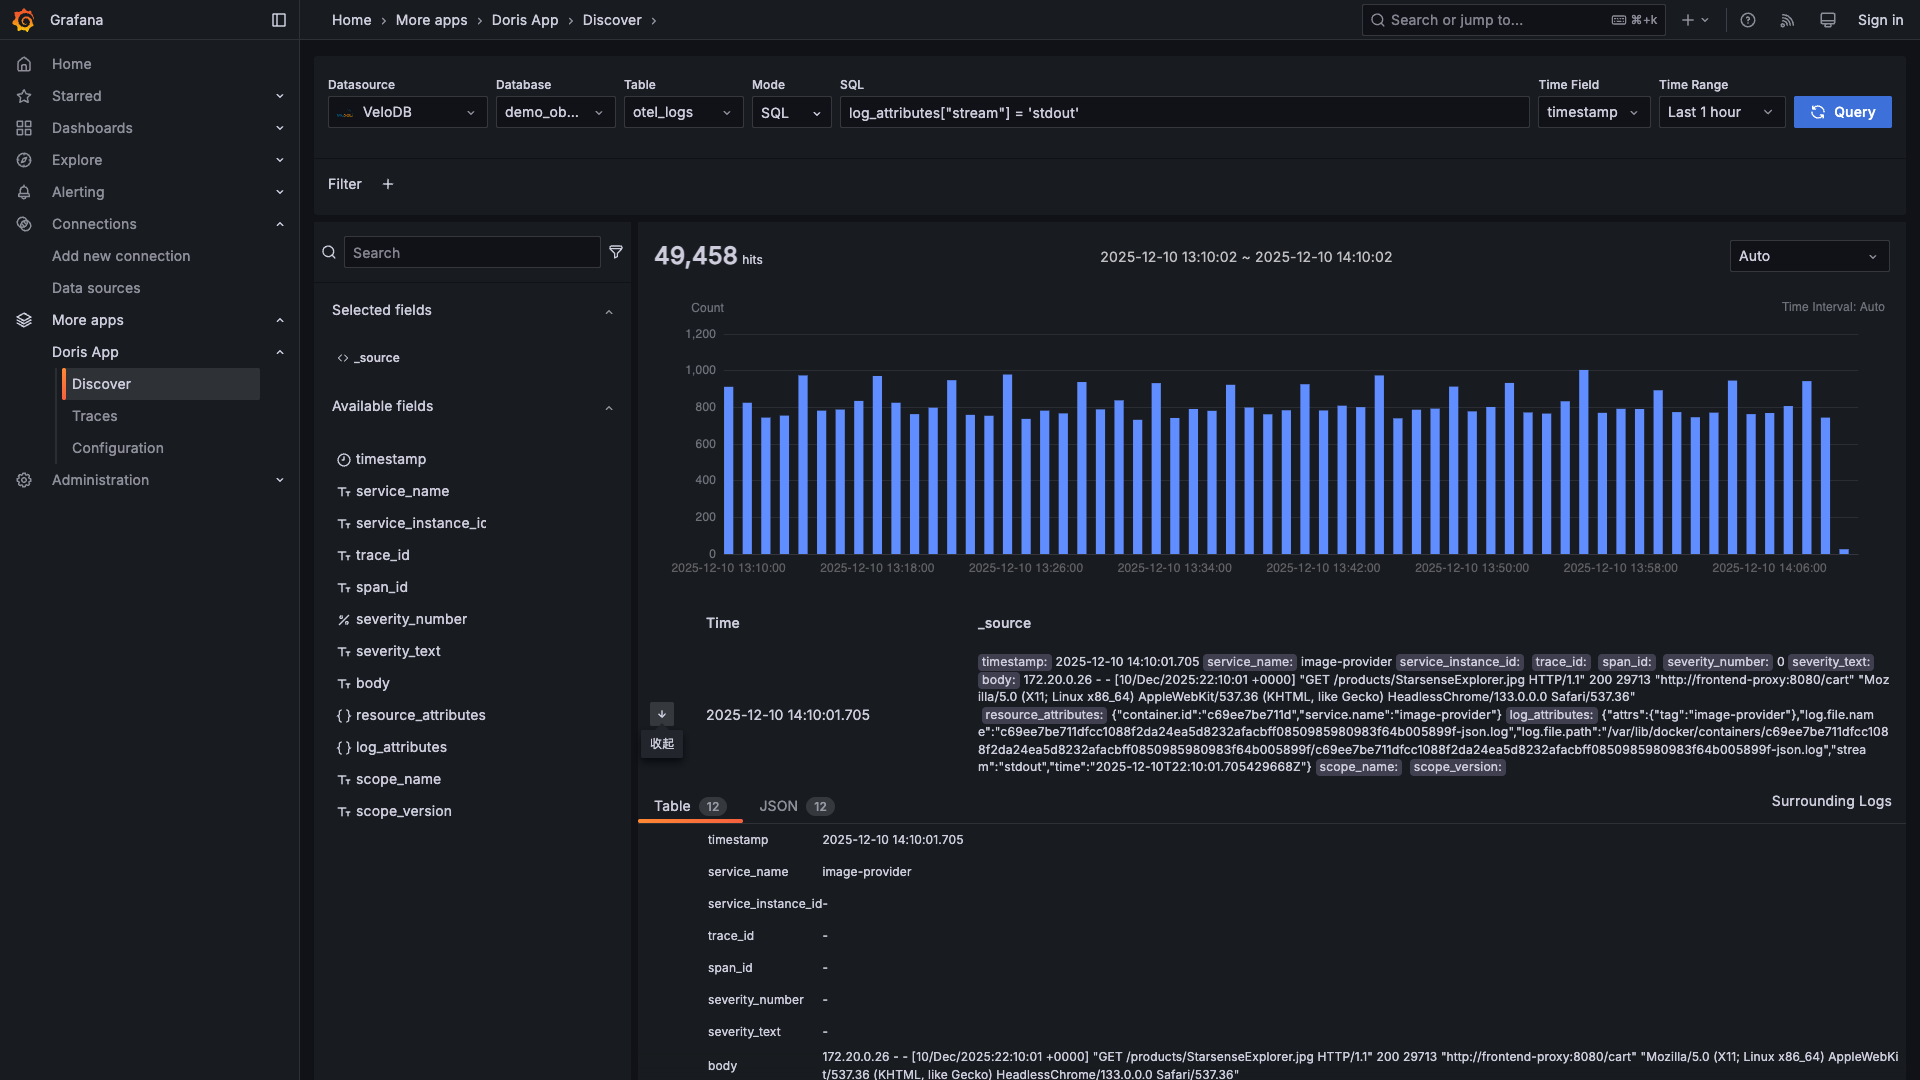
Switch to SQL
Prefer SQL? Toggle to SQL mode for complex queries:

Find Trace IDs in Logs
Logs and traces are connected by trace IDs. When you find an interesting log, use the trace ID to see the complete request flow across all services.
Click the trace ID to copy it, then search for it in the Traces page (Part 3).
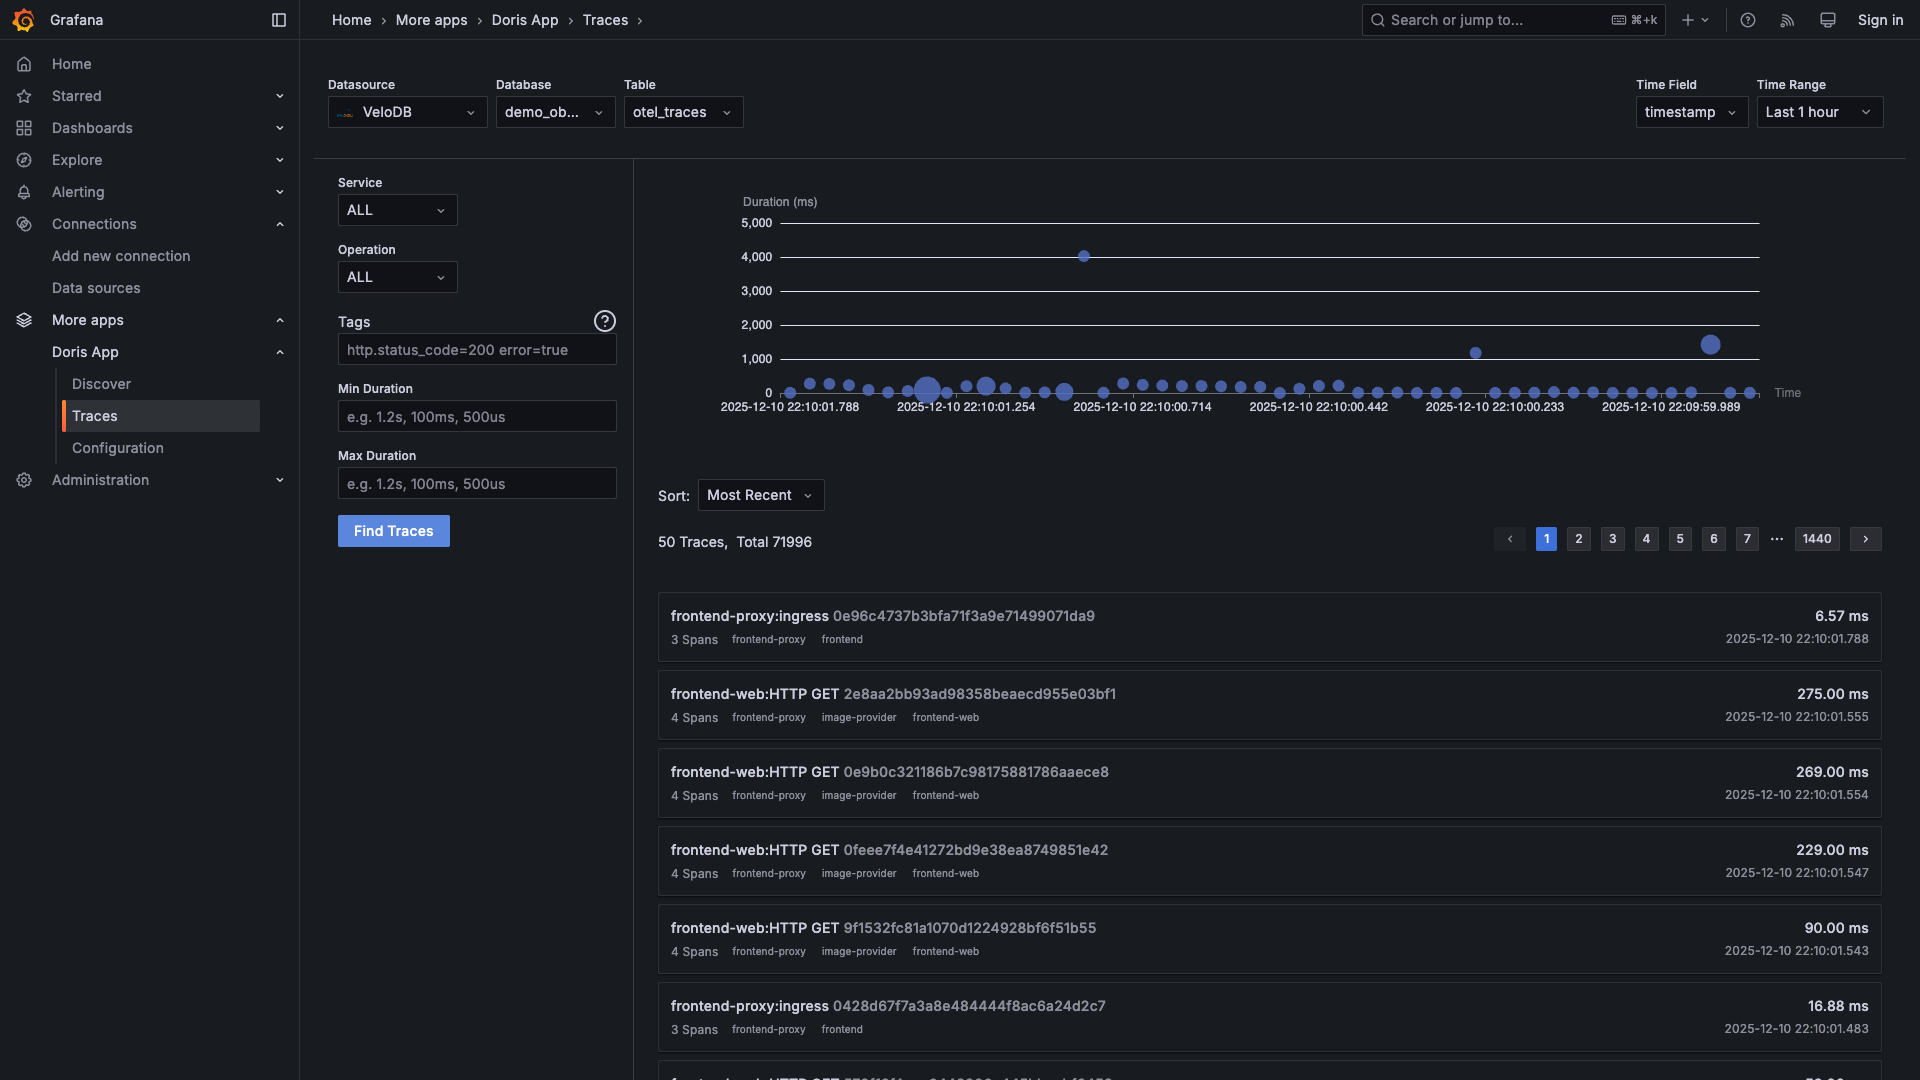
Part 3: Explore Traces
Go to Apps → Doris App → Traces
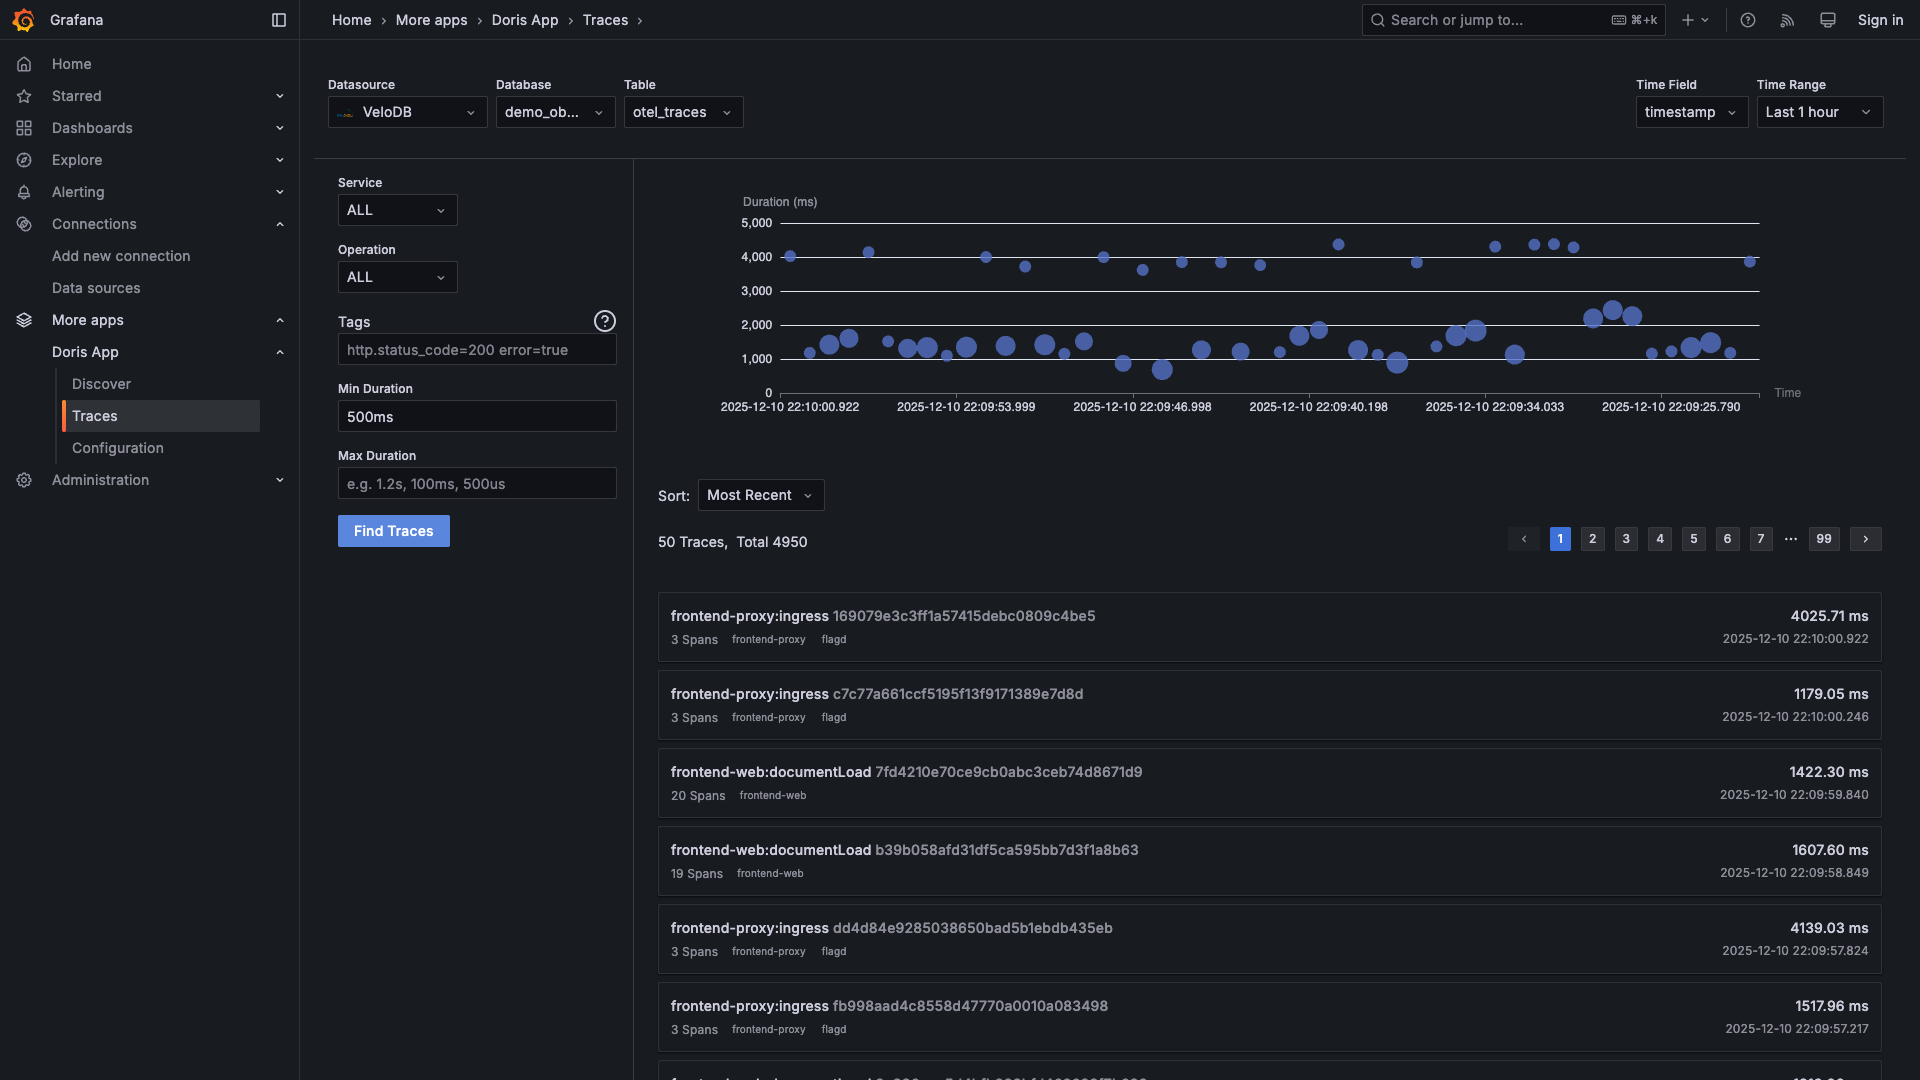
View All Traces
See every request flowing through your system:
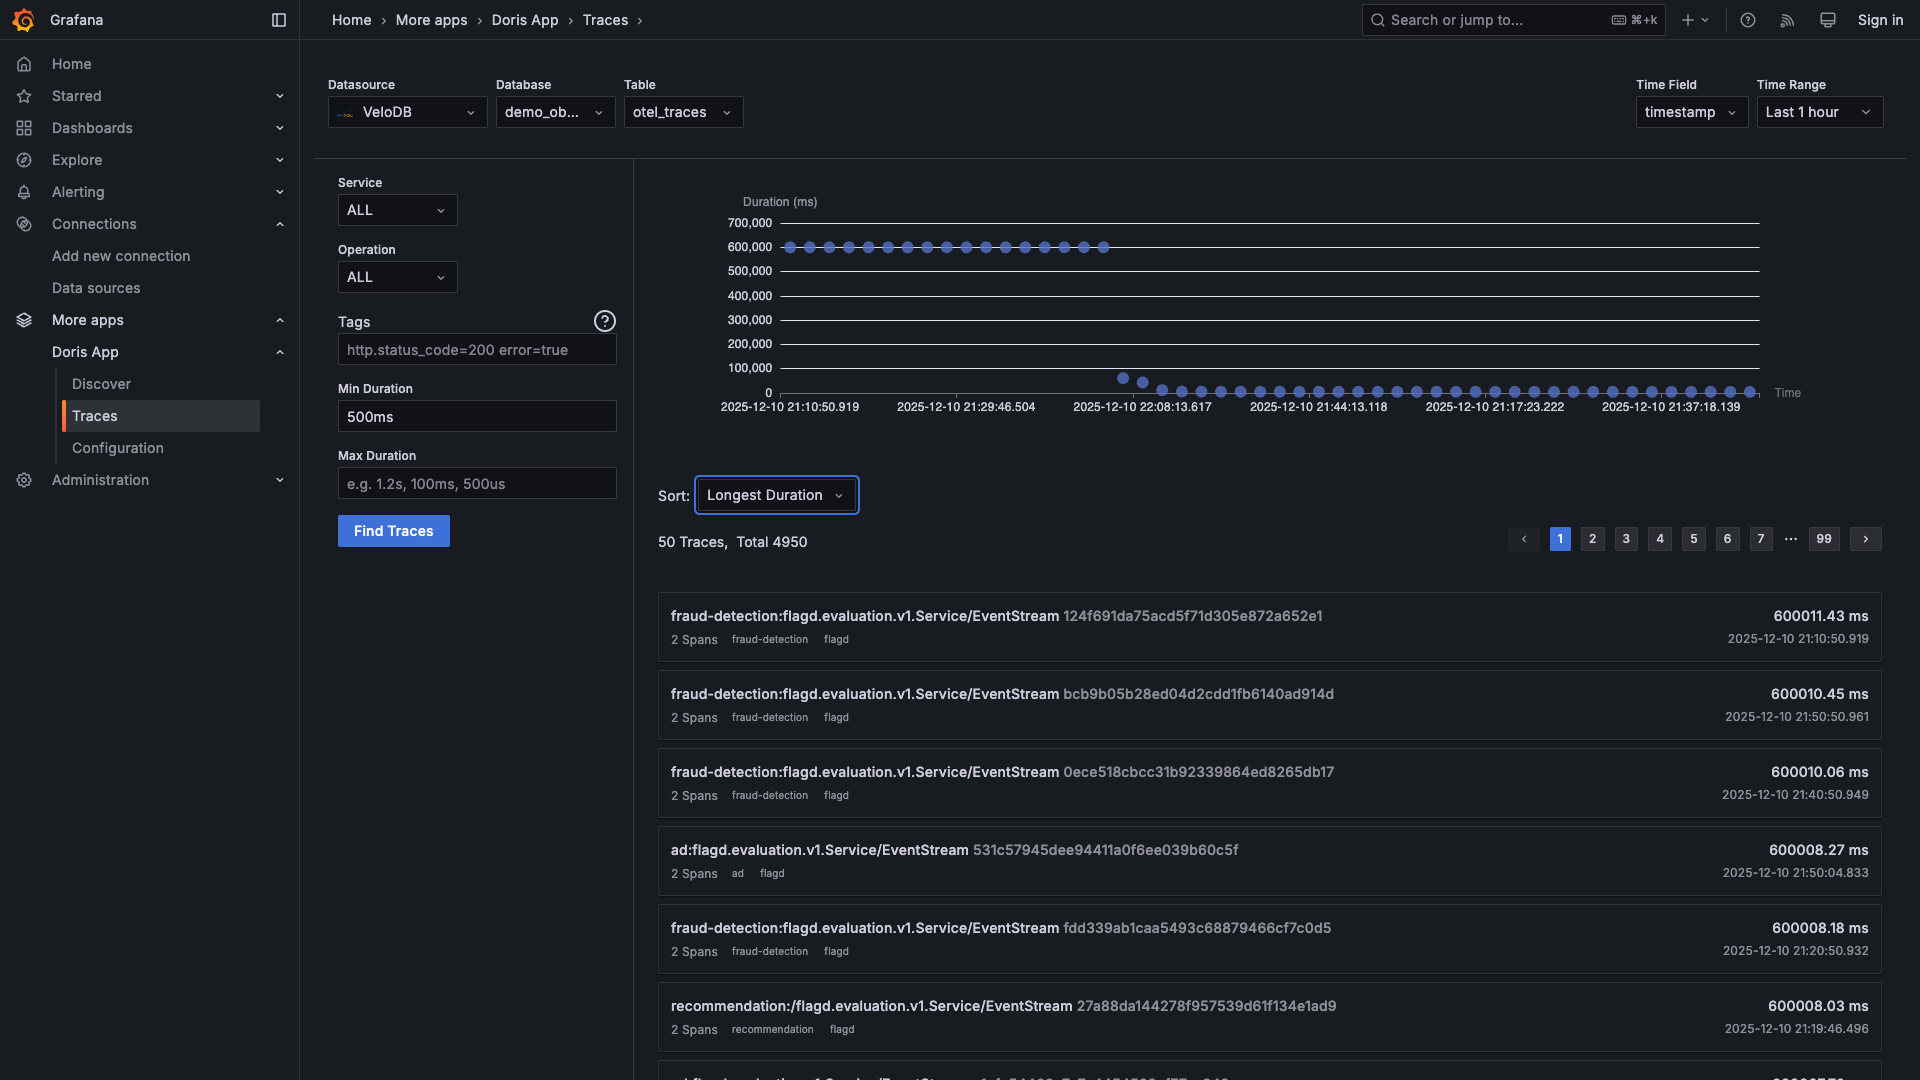
Find Slow Requests
Filter by minimum duration to find performance issues:
Sort by duration to see the slowest requests first:
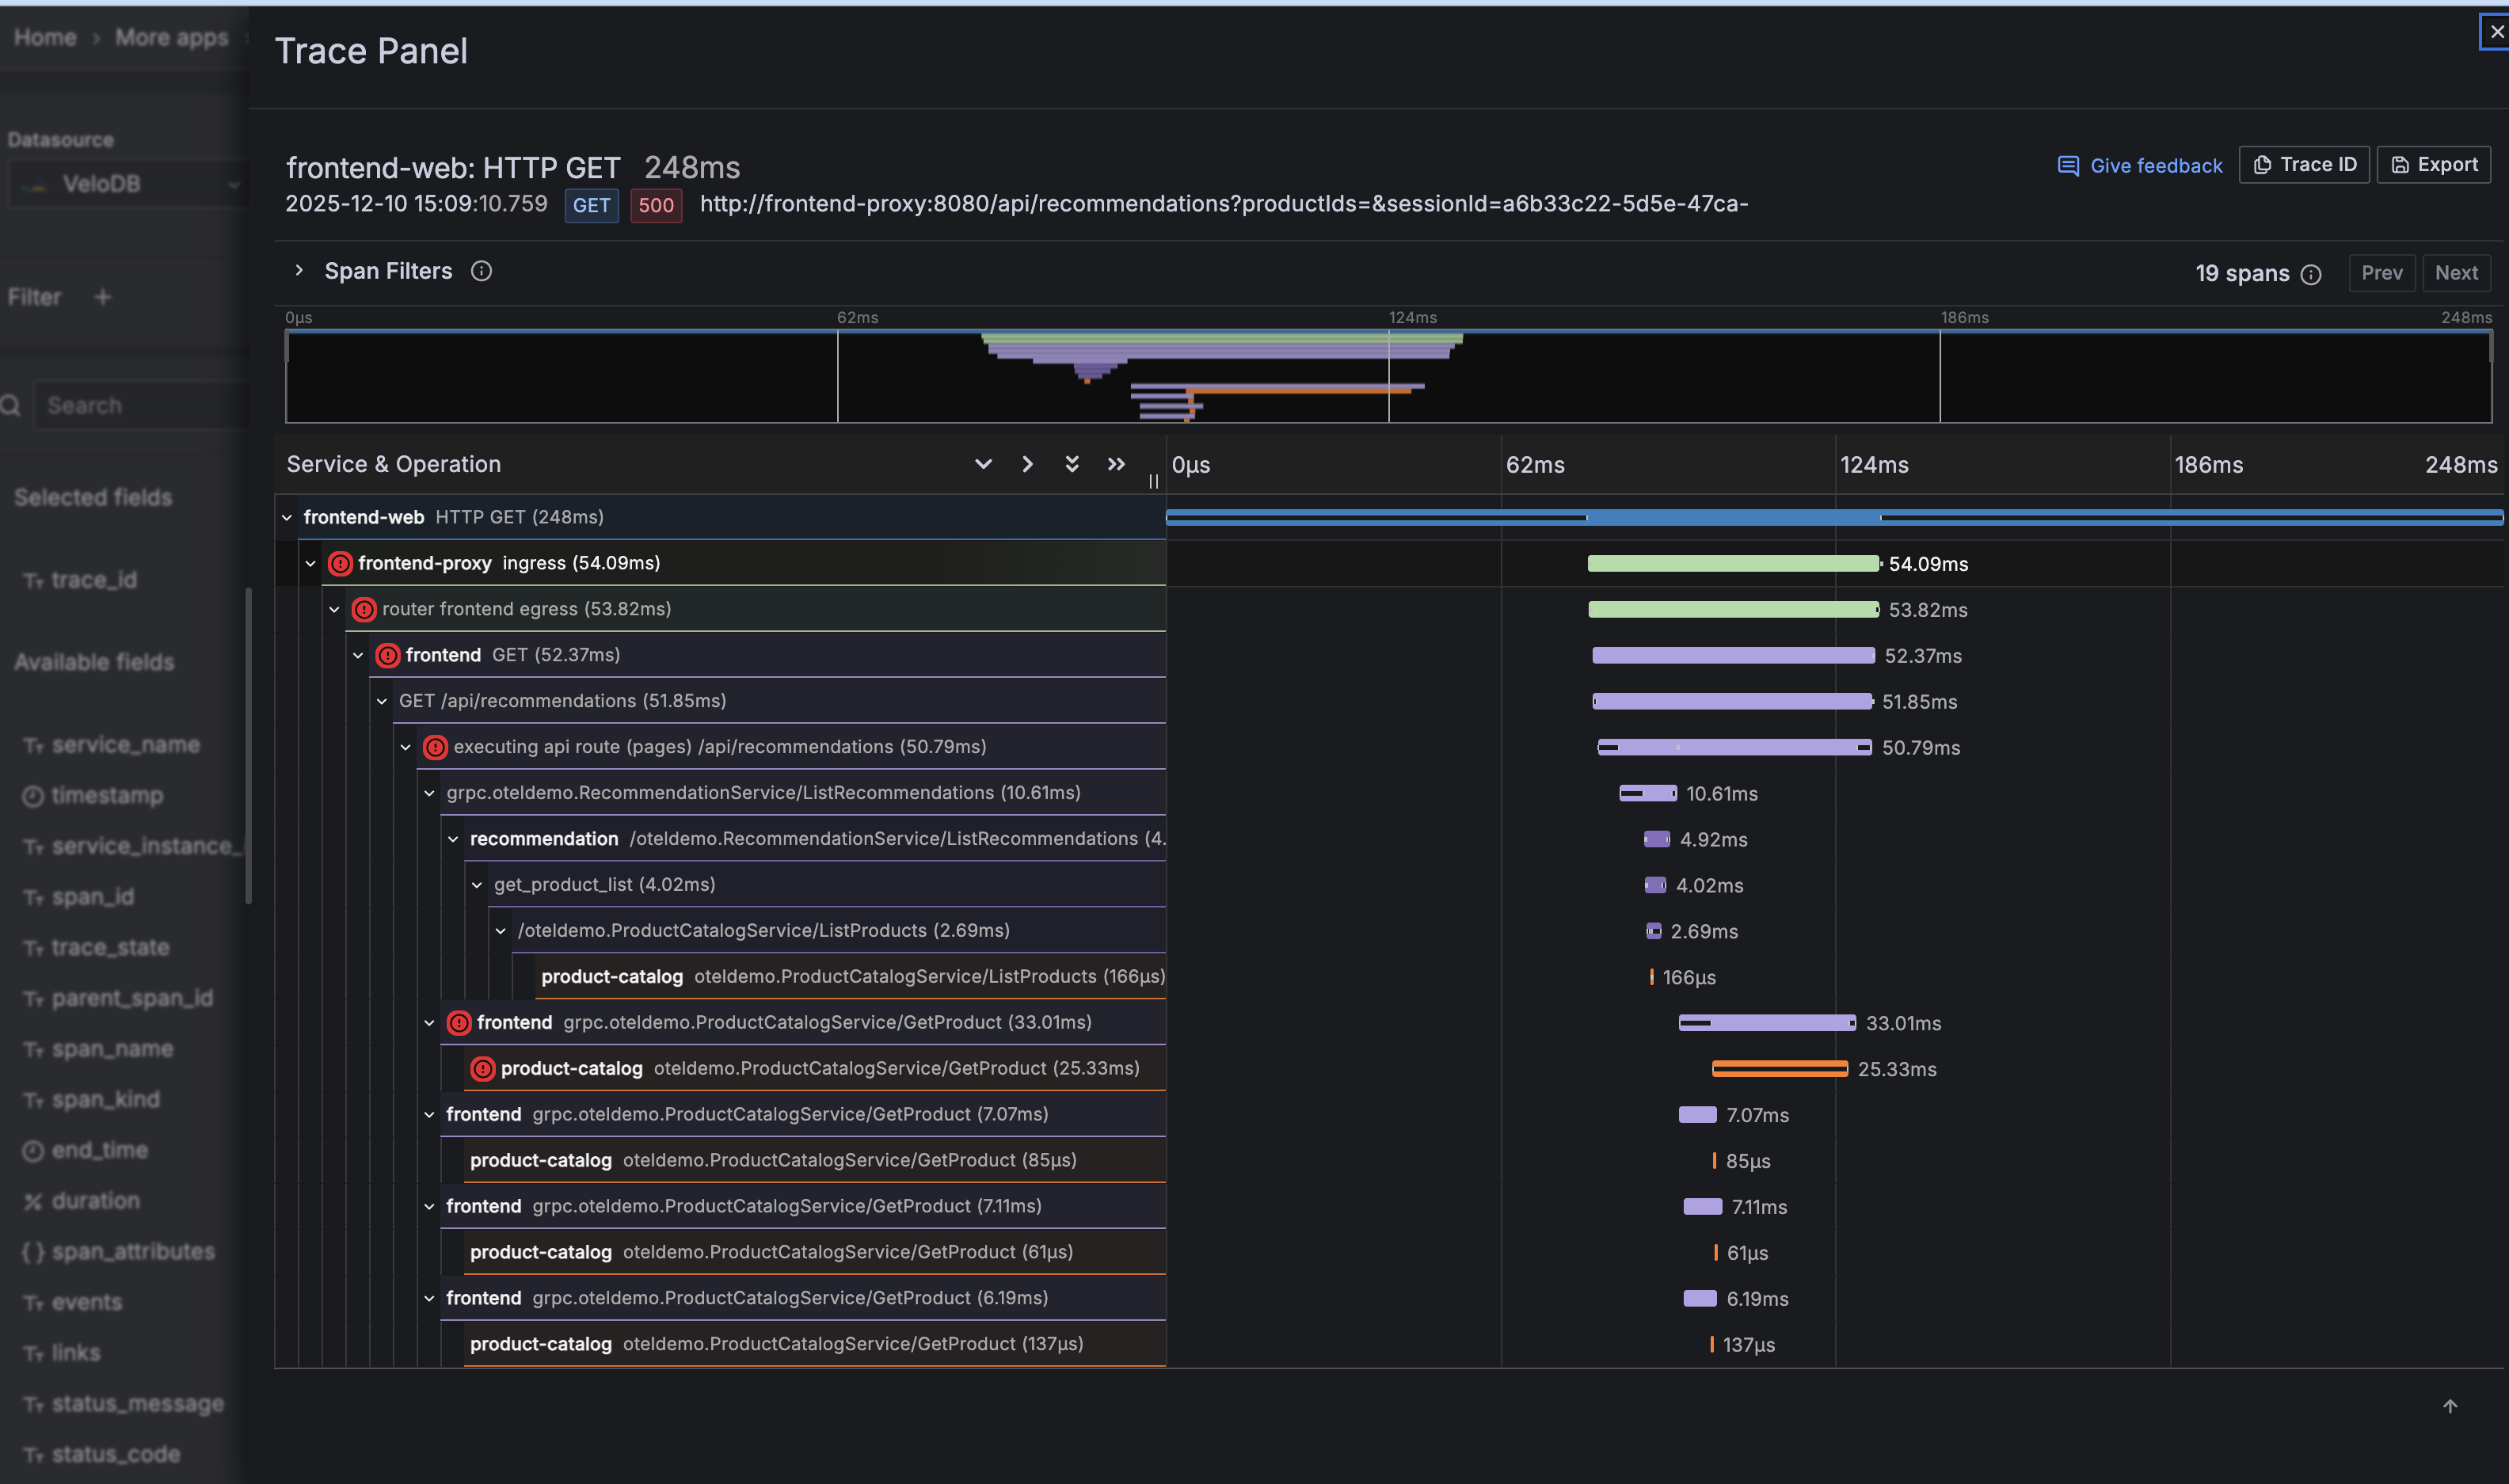
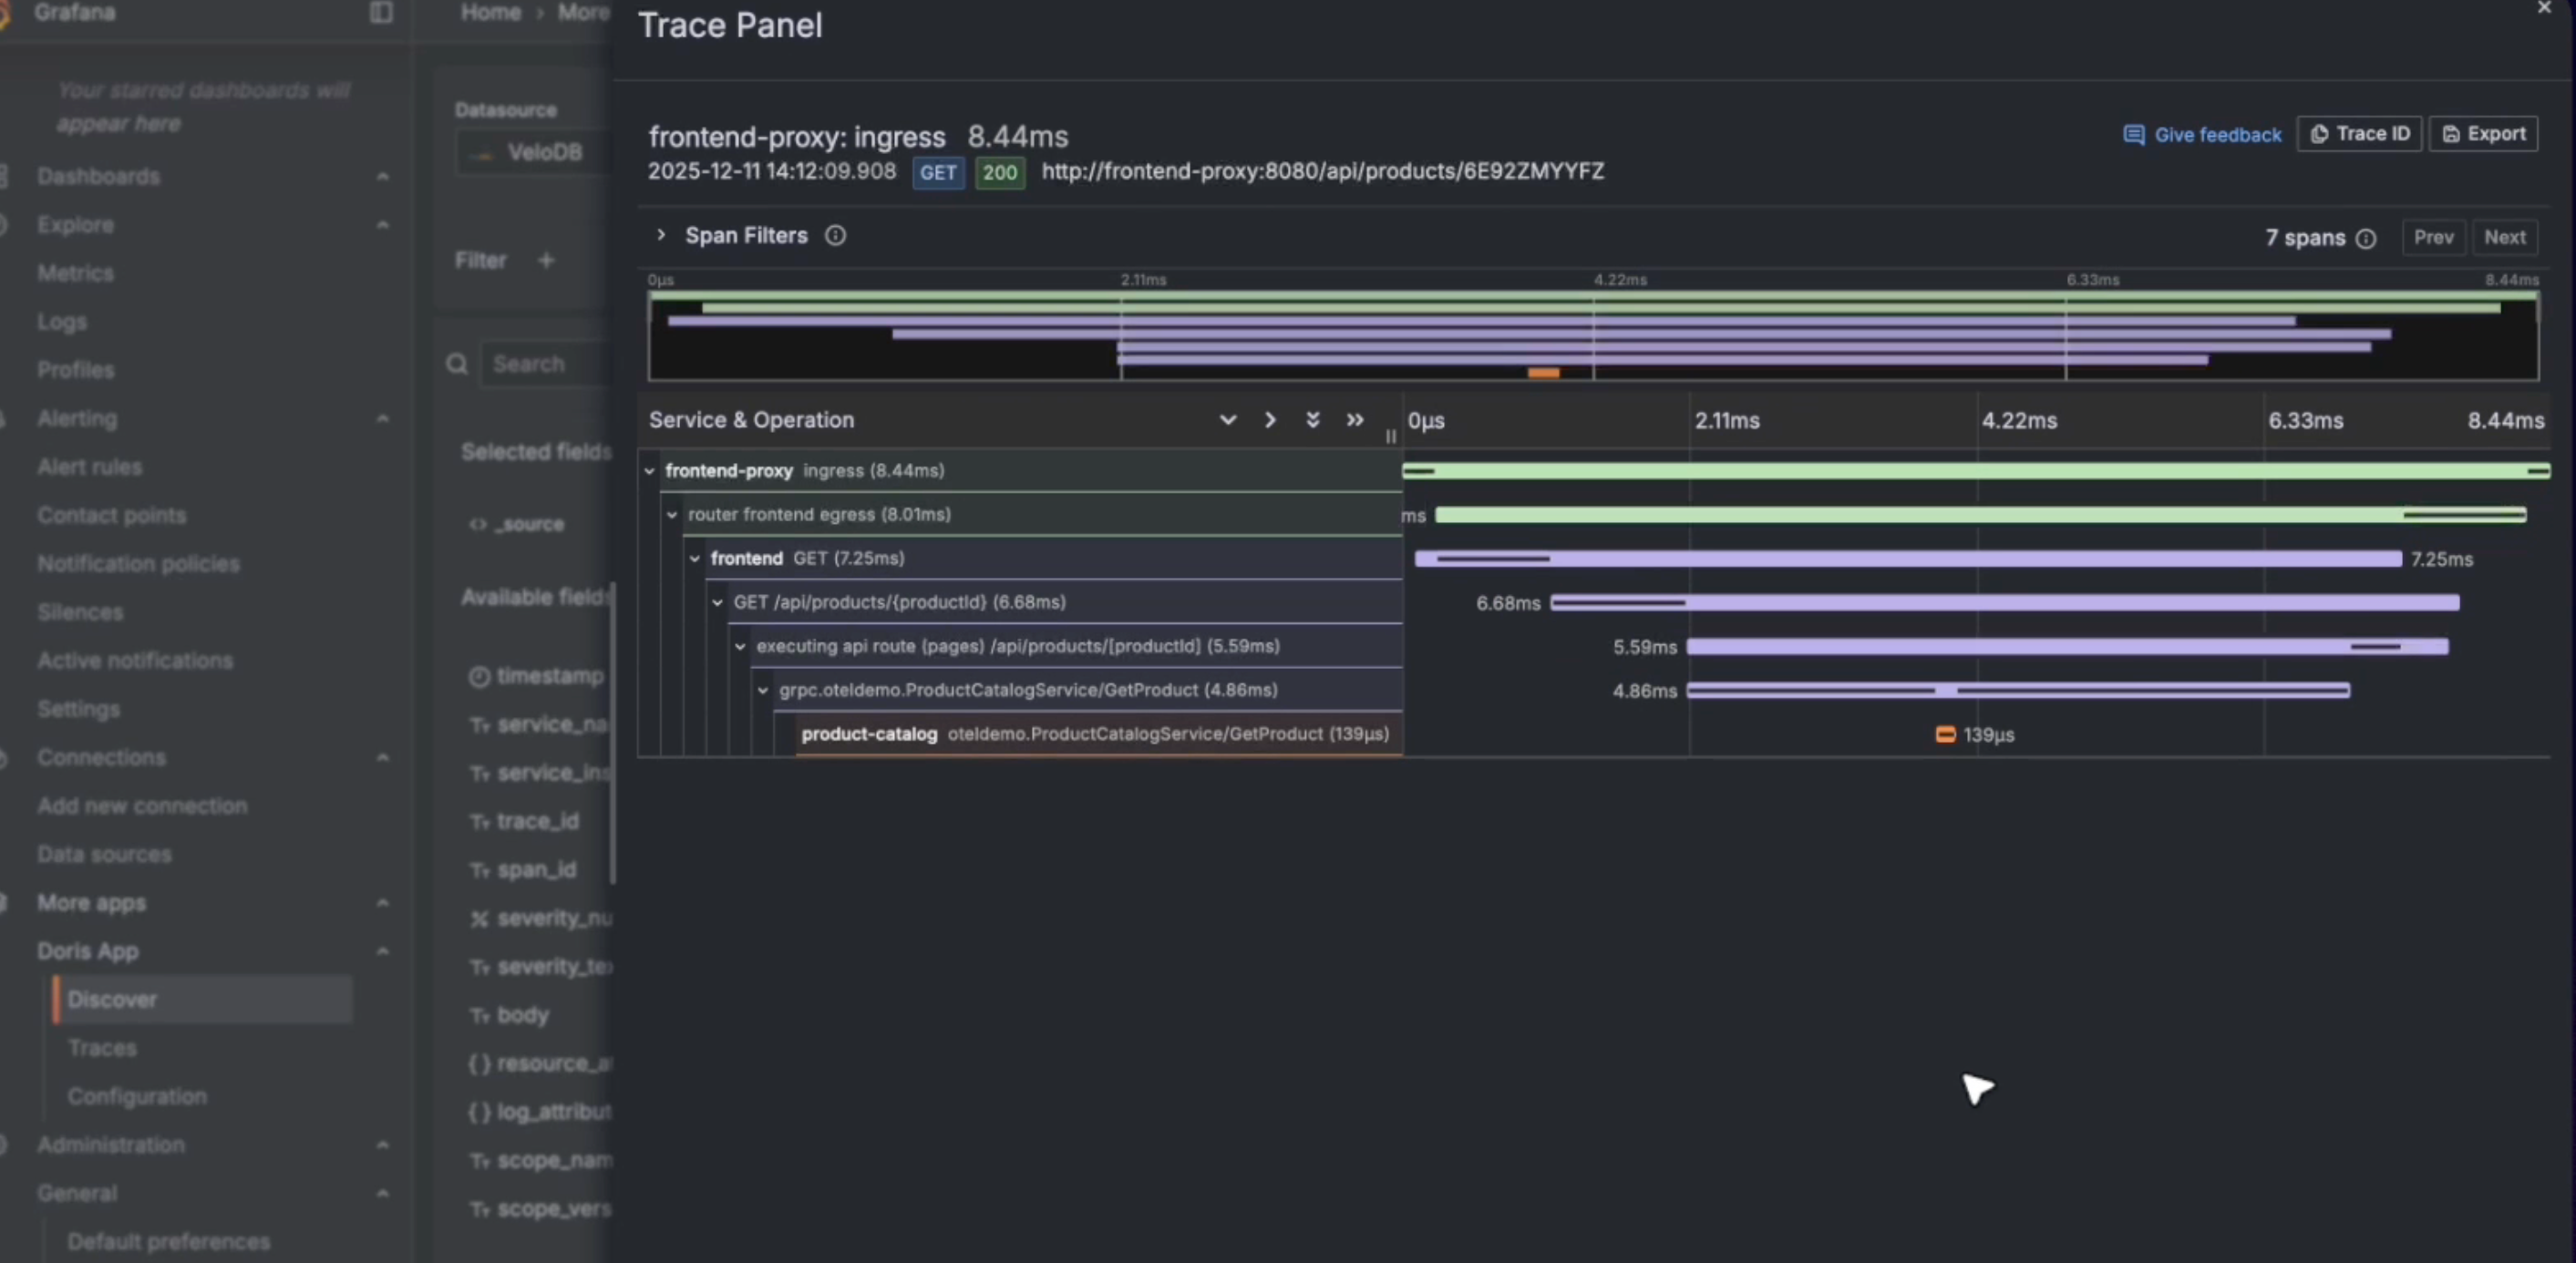
Drill Into a Trace
Click any trace to see the full waterfall view:
You can see:
- Every service involved in the request
- Time spent in each service
- Parent-child relationships between spans
- Error status on any span
Part 4: Explore Metrics
Go to Dashboards → VeloDB OTEL → 1 Metrics to see pre-built metric visualizations:
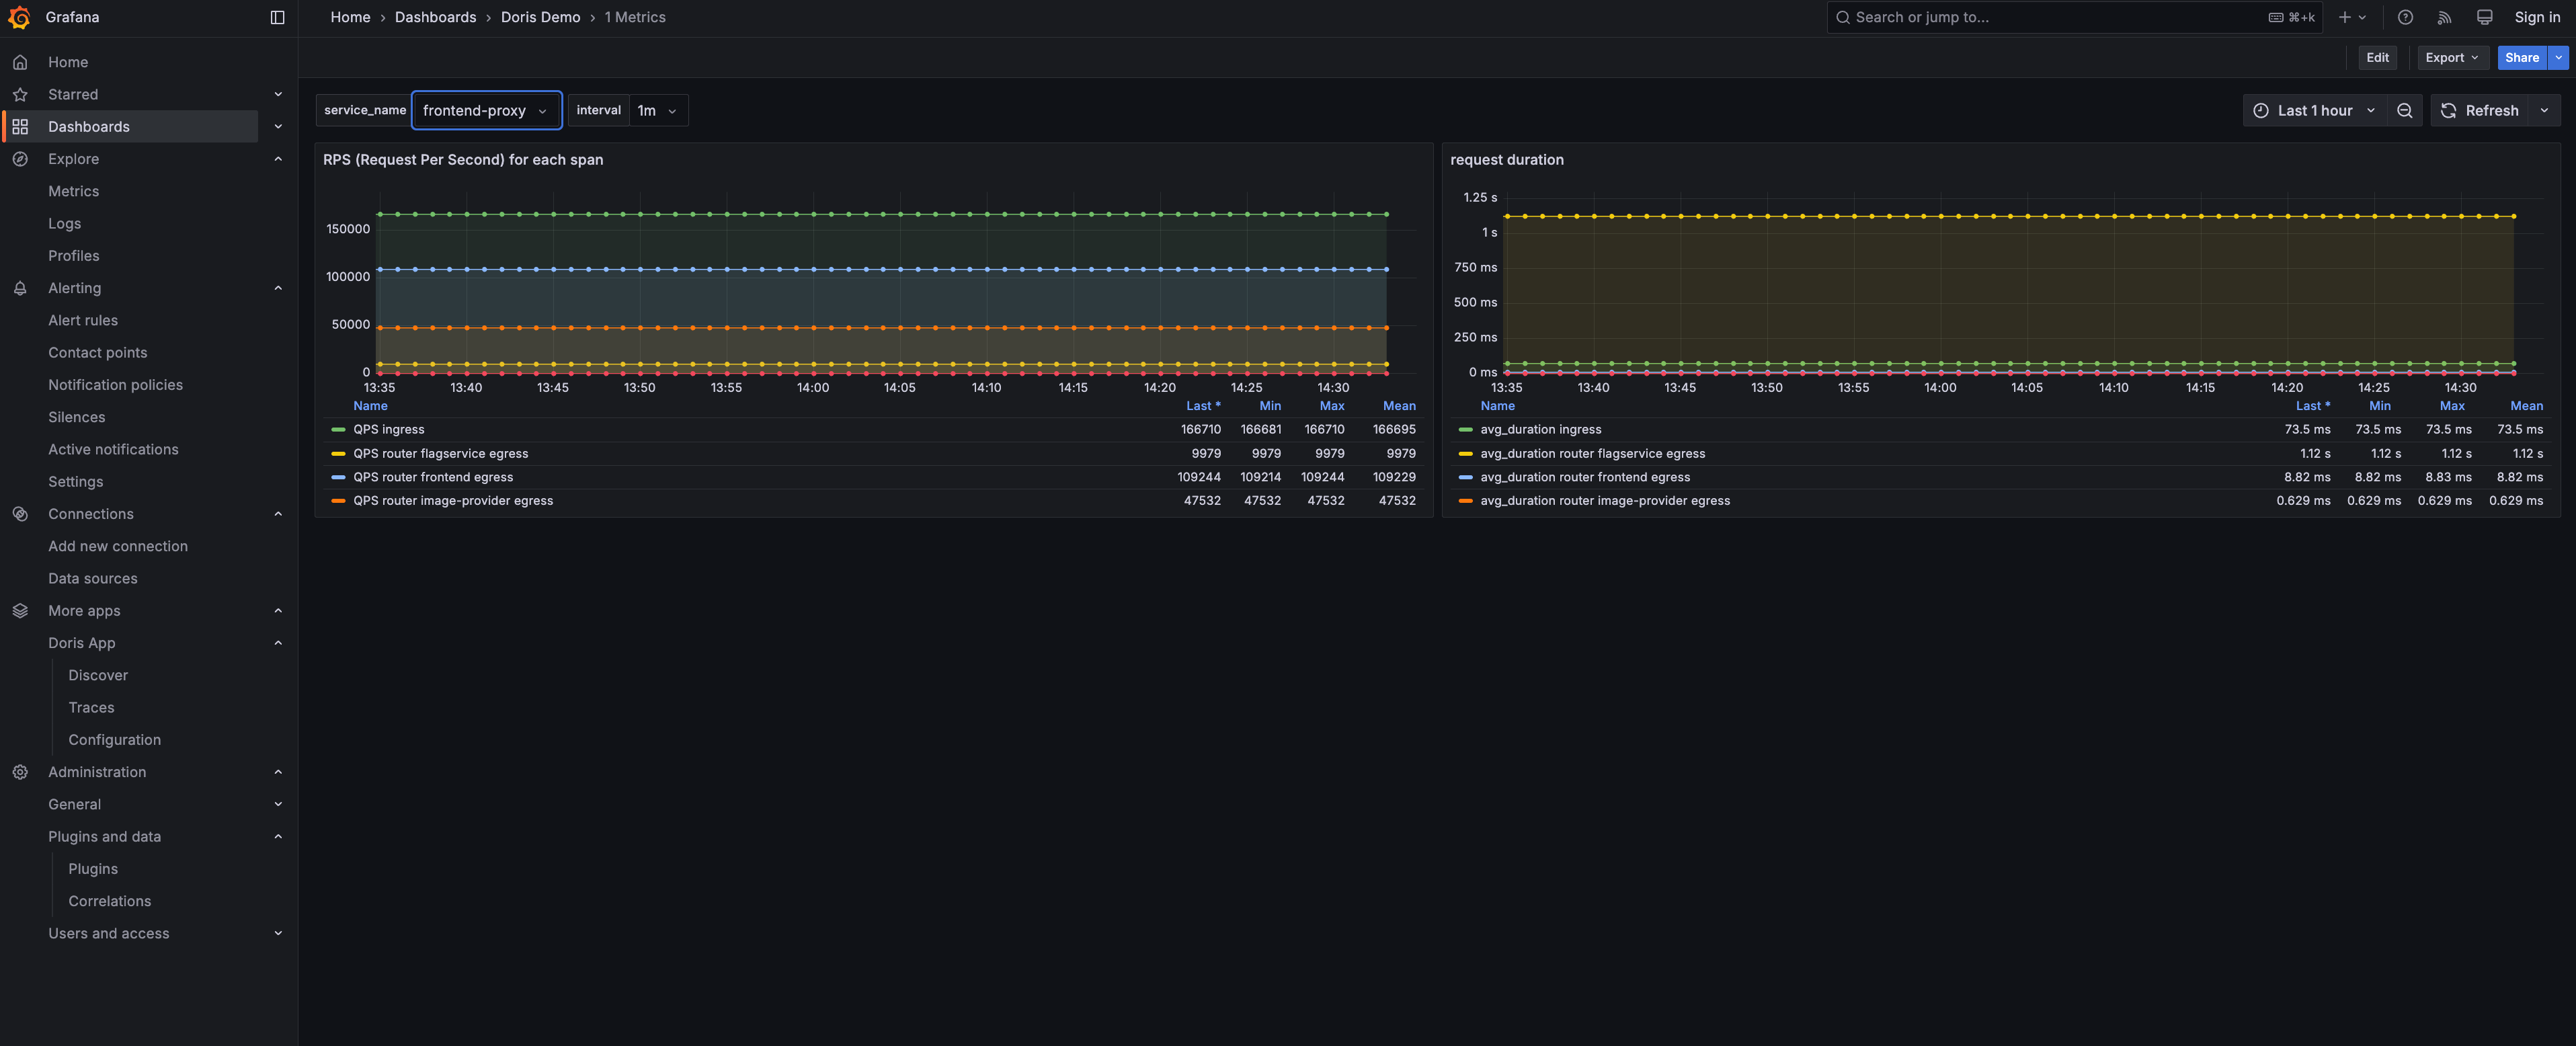
The dashboard shows key metrics from your microservices:
- RPS (Requests Per Second) - Request throughput for each service
- Request Duration - Latency percentiles across services
You Did It!
You now have a complete observability stack powered by VeloDB:
- Logs - Searchable with full-text queries or SQL, just like Kibana
- Traces - Distributed tracing across all your microservices
- Metrics - Query performance metrics with SQL
- Correlation - Jump from logs to traces with trace IDs
All your observability data lives in one place - queryable with standard SQL, with 10x storage compression and real-time ingestion.
Ready for more? Check out the Observability Overview for architecture details and production deployment guides.
Cleanup
docker compose --profile demo down -v
Troubleshooting
"0 hits" in Grafana but data exists?
First, confirm data exists in VeloDB:
source .env && mysql -h $VELODB_HOST -P ${VELODB_MYSQL_PORT:-9030} -u $VELODB_USER -p$VELODB_PASSWORD $VELODB_DATABASE -e "SELECT COUNT(*) FROM otel_logs"
If data exists but Grafana shows "0 hits", update VELODB_TIMEZONE in .env to match your browser timezone, then restart containers.
Can't connect to VeloDB? → Verify host is reachable and ports 9030 + 8080 are open.
Collector not exporting?
→ Check docker logs otel-collector for connection errors.
Learn More
- Observability Overview - Why VeloDB for observability
- VARIANT Data Type - Semi-structured data type for logs and traces
- Inverted Index - How VeloDB powers fast full-text search