DOG Stack Overview
DOG Stack combines Doris, OpenTelemetry, and Grafana for observability. In VeloDB Cloud, your warehouse provides the storage and query engine. You run the telemetry collectors and Grafana, including the Doris App plugin, in your own environment.
Use this architecture when you want to search logs, investigate distributed traces, and build SQL dashboards over telemetry stored in a warehouse. The component names, exporter identifiers, and plugin names retain Apache Doris terminology because VeloDB Cloud uses the same integrations.
Architecture and responsibilities
Applications and infrastructure
    | logs, traces, and metrics
    v
Your OpenTelemetry Collector with the Doris exporter
    | Stream Load for telemetry; MySQL protocol for schema setup
    v
VeloDB Cloud warehouse
    ^ MySQL queries
    |
Your Grafana instance with Doris App
| Component | Responsibility | Managed by |
|---|---|---|
| Application instrumentation and collection tools | Produce telemetry and send it to a Collector. Select receivers for OTLP, files, host metrics, or Kubernetes metrics according to the data you need. | You |
| OpenTelemetry Collector with the Doris exporter | Receive, process, batch, and export telemetry to warehouse tables. | You |
| VeloDB Cloud warehouse | Store telemetry and execute search, aggregation, and join queries. | VeloDB Cloud for SaaS. For BYOC, resources run in your cloud account. |
| Grafana with Doris App | Query the warehouse and provide log exploration, trace analysis, dashboards, and alerts. | You |
The Collector needs network access to the warehouse ingestion endpoint and, when it creates tables, the MySQL endpoint. Grafana needs access to the MySQL endpoint. Applications send telemetry to your Collector rather than directly to Grafana. See Deployment for network, authentication, and deployment considerations.
Capabilities
| Task | What you can do | Guide |
|---|---|---|
| Collect telemetry | Use OpenTelemetry SDKs and Collector receivers to ingest application and infrastructure data. Configure each signal's receiver and pipeline explicitly. | Quick Start |
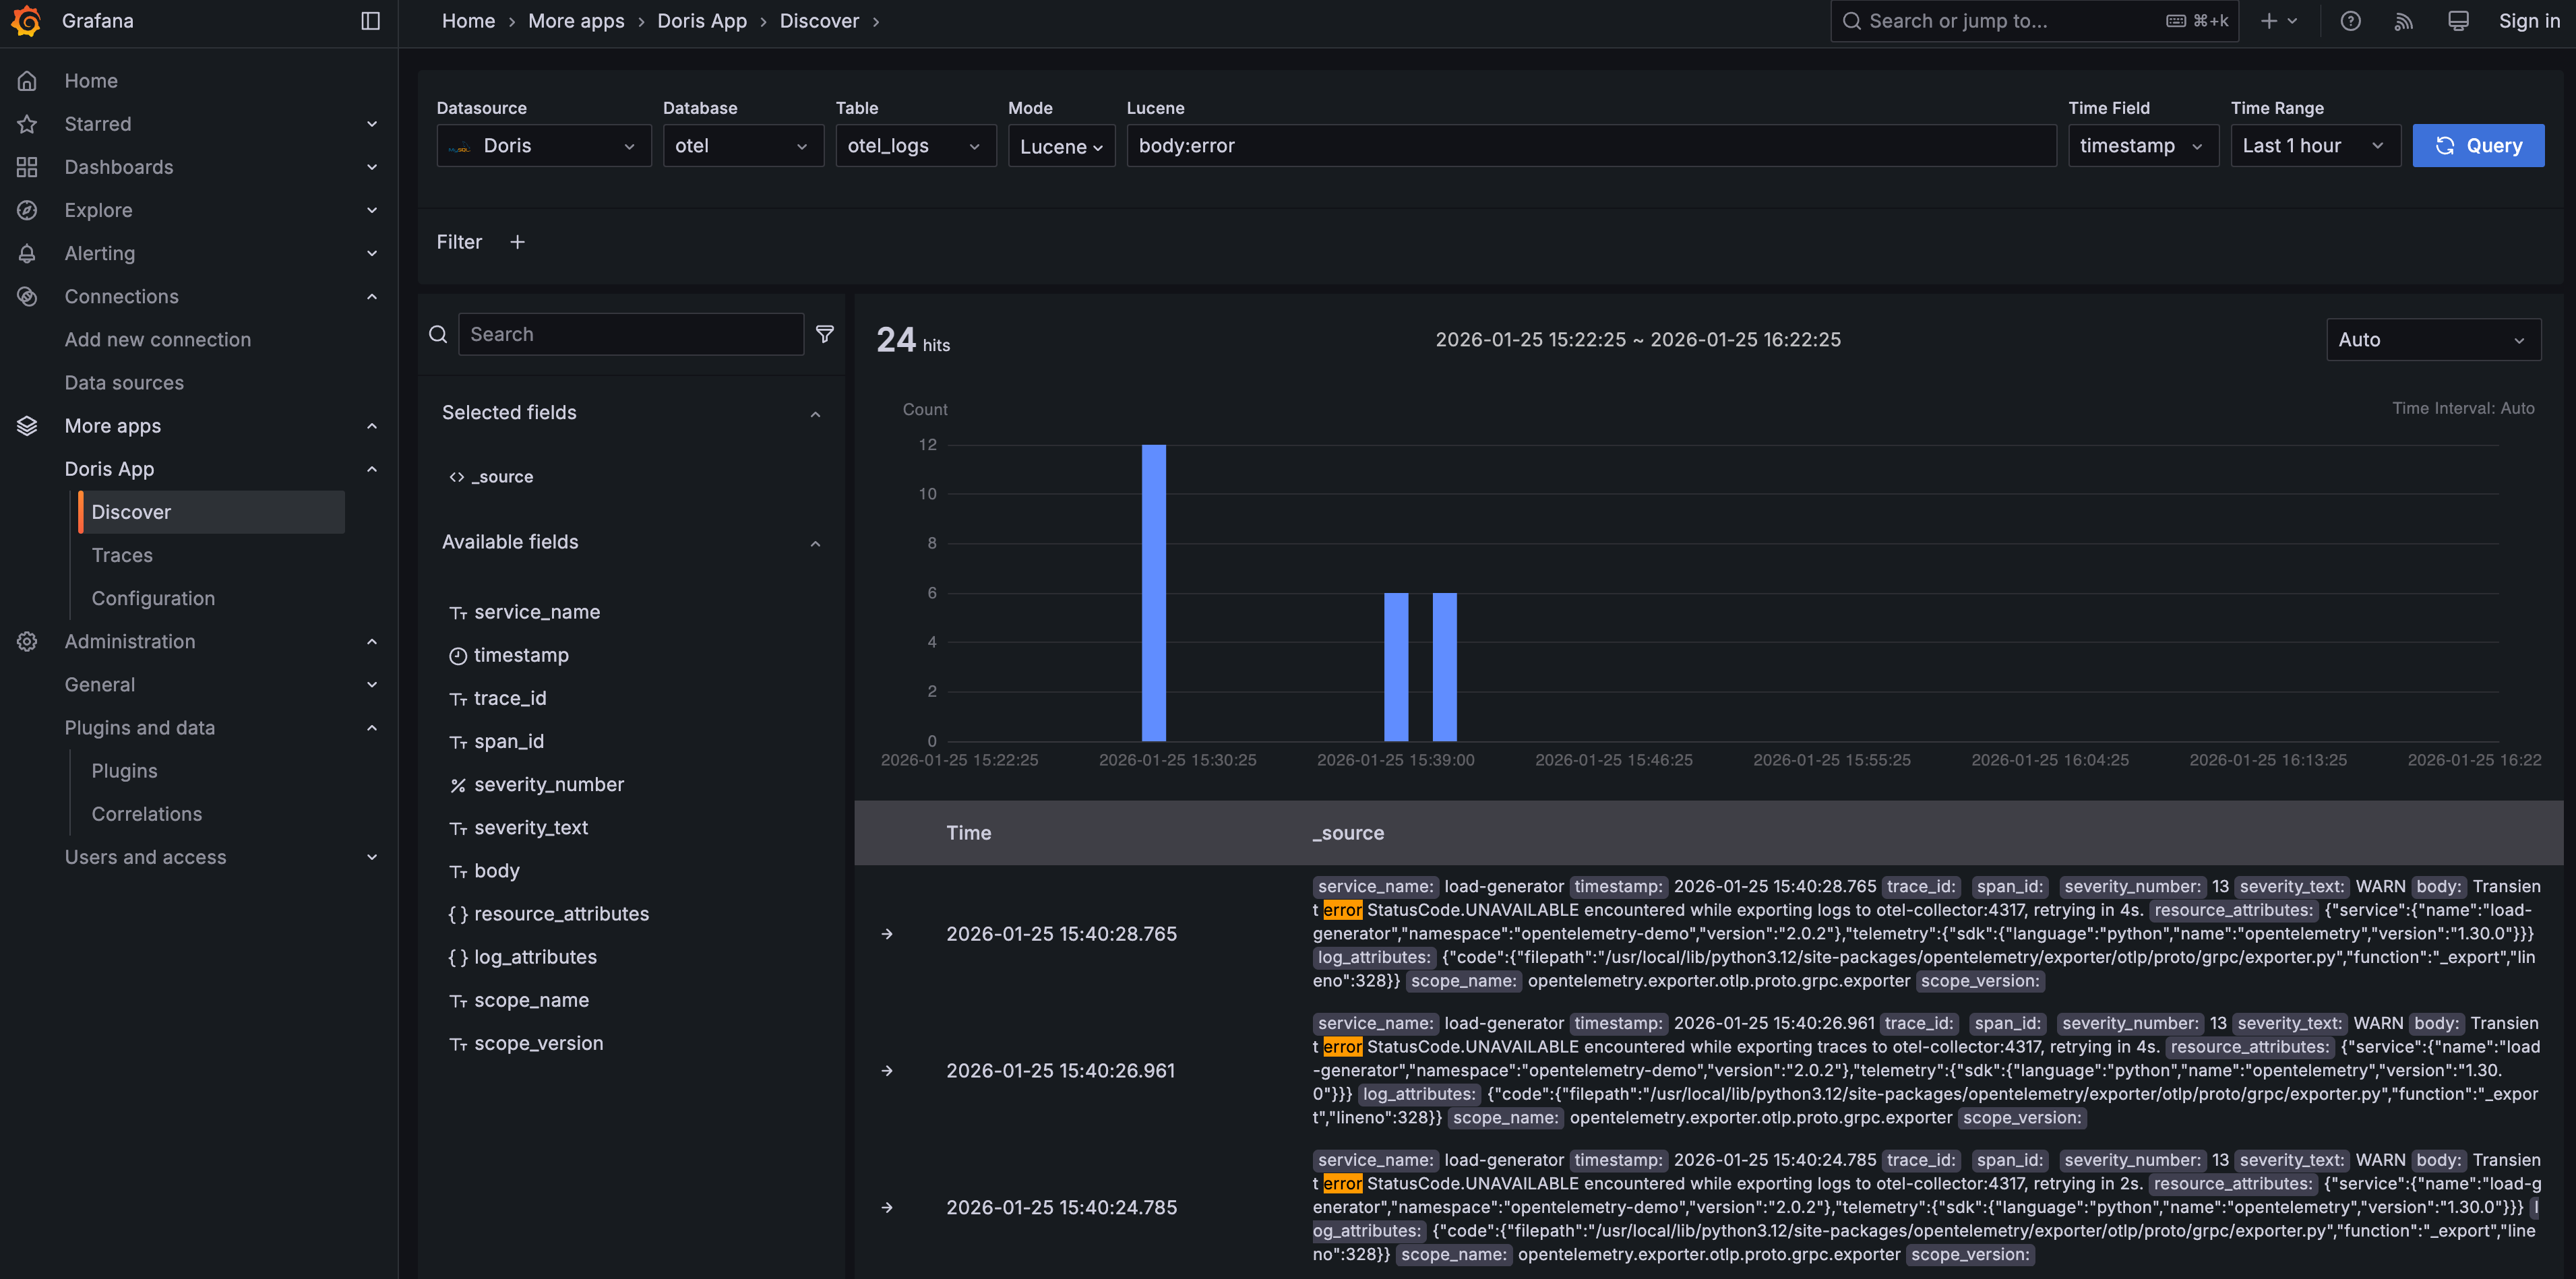
| Search logs | Use SQL predicates or the plugin's supported Lucene-style syntax, select fields, inspect surrounding records, and follow trace IDs. | Log Search |
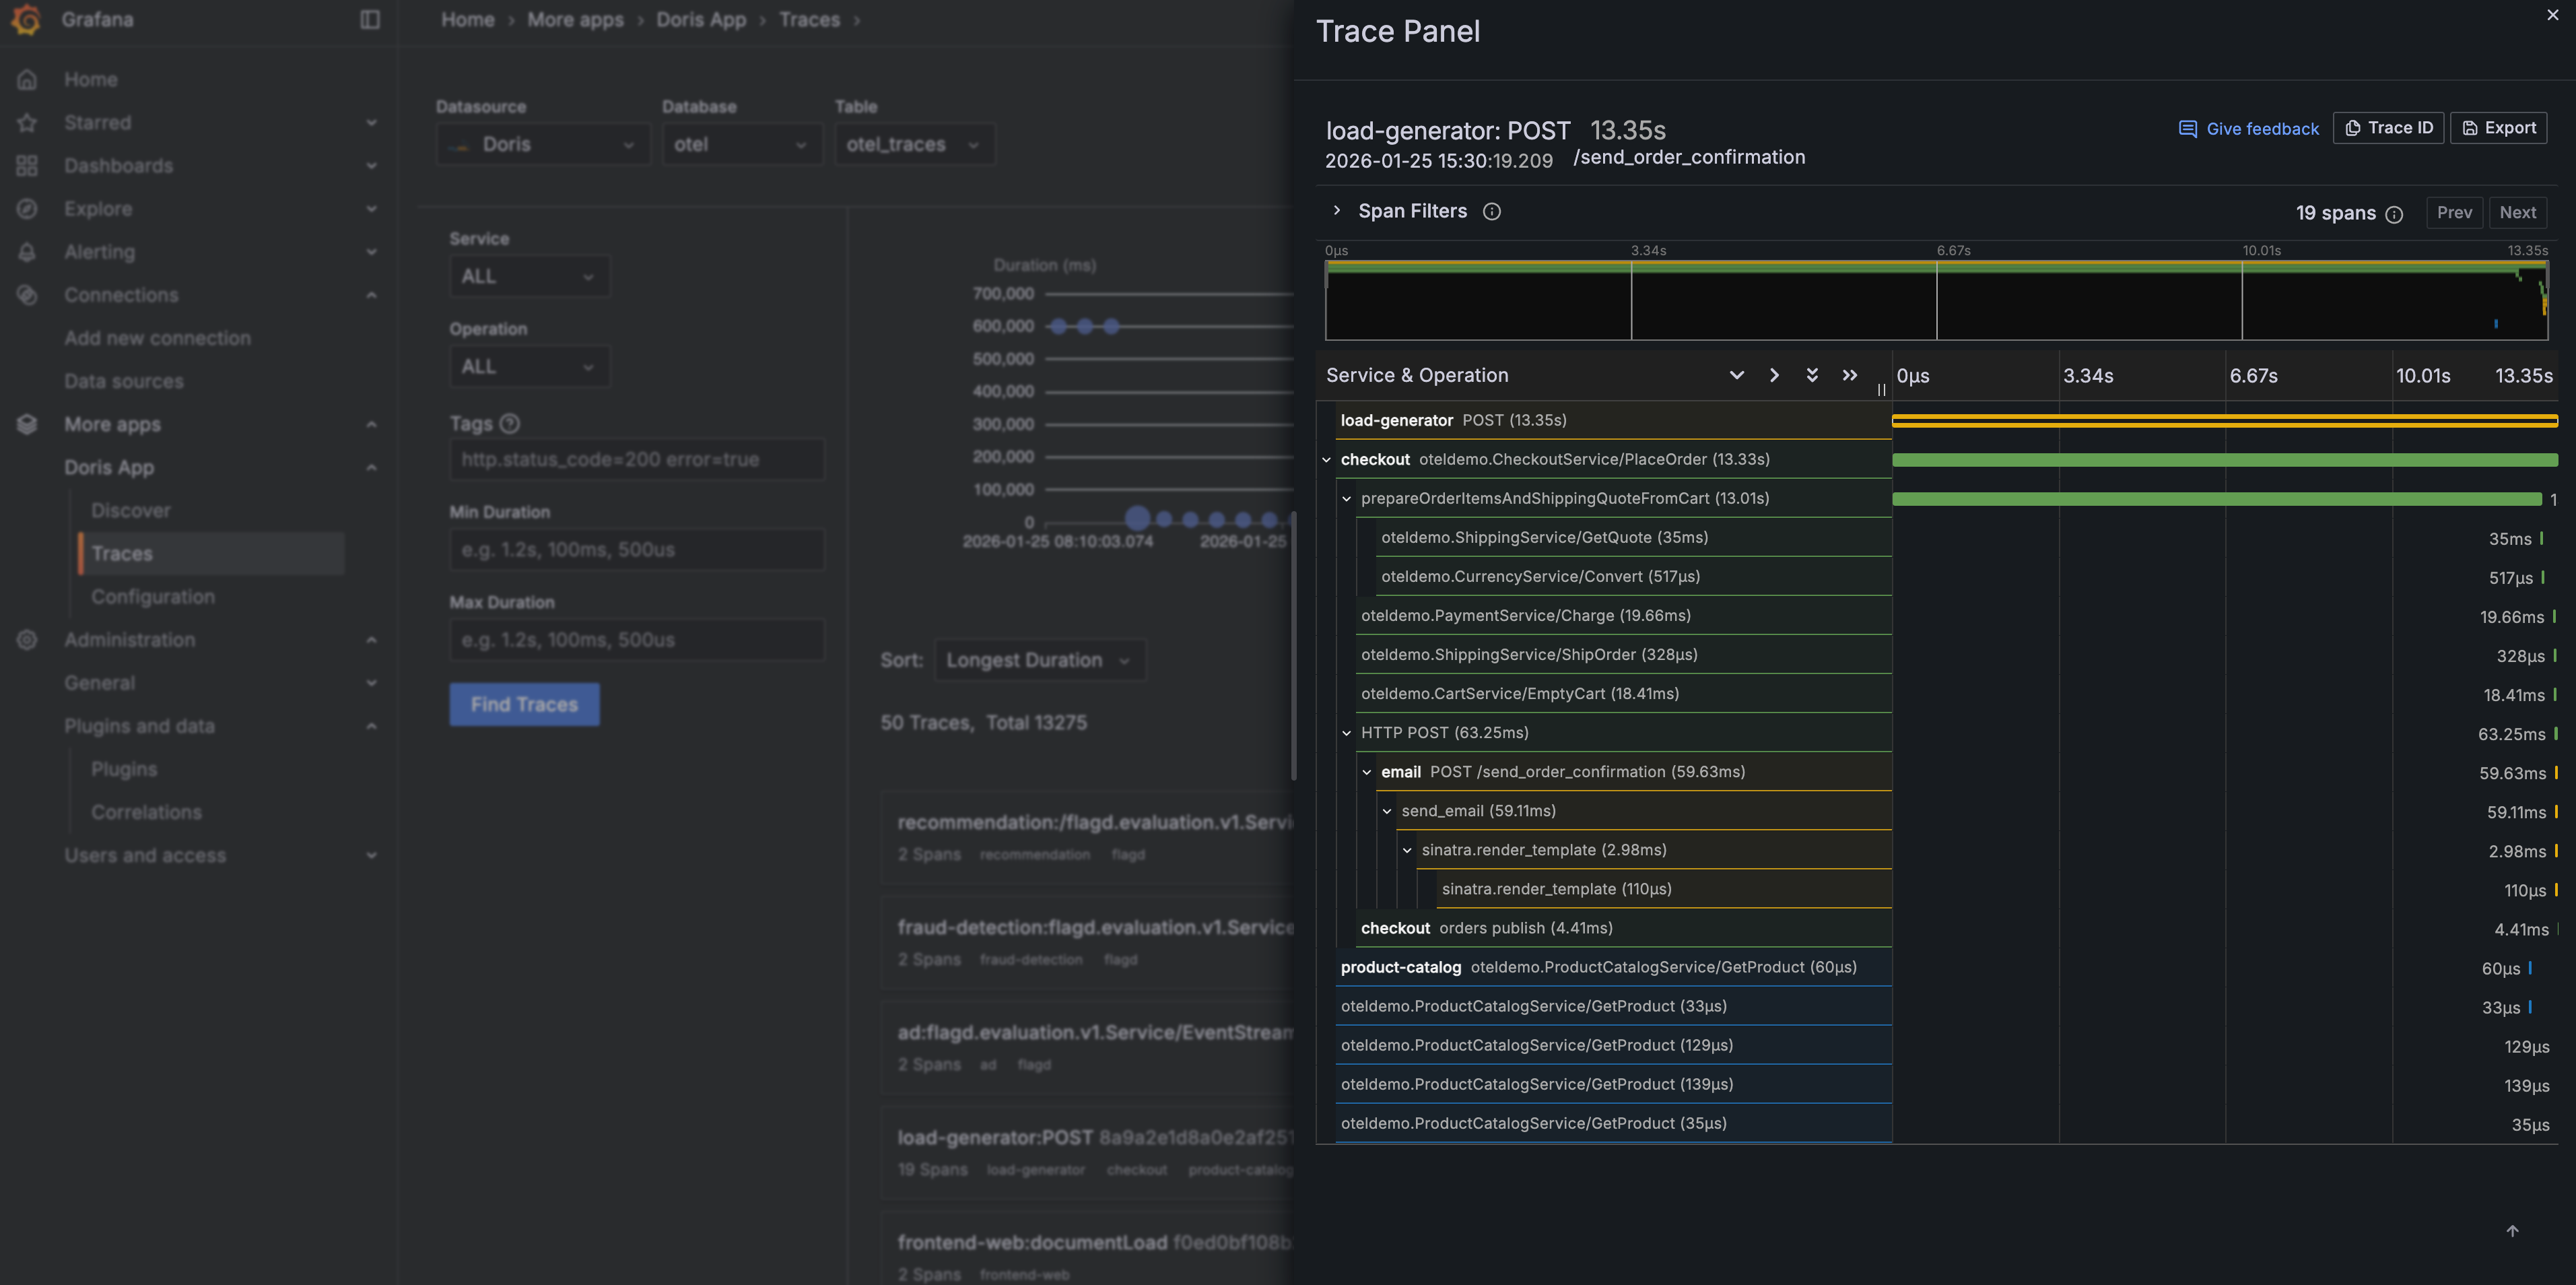
| Investigate traces | Filter by service, operation, attributes, and duration. Open a trace waterfall and inspect its spans. | Distributed Trace Analysis |
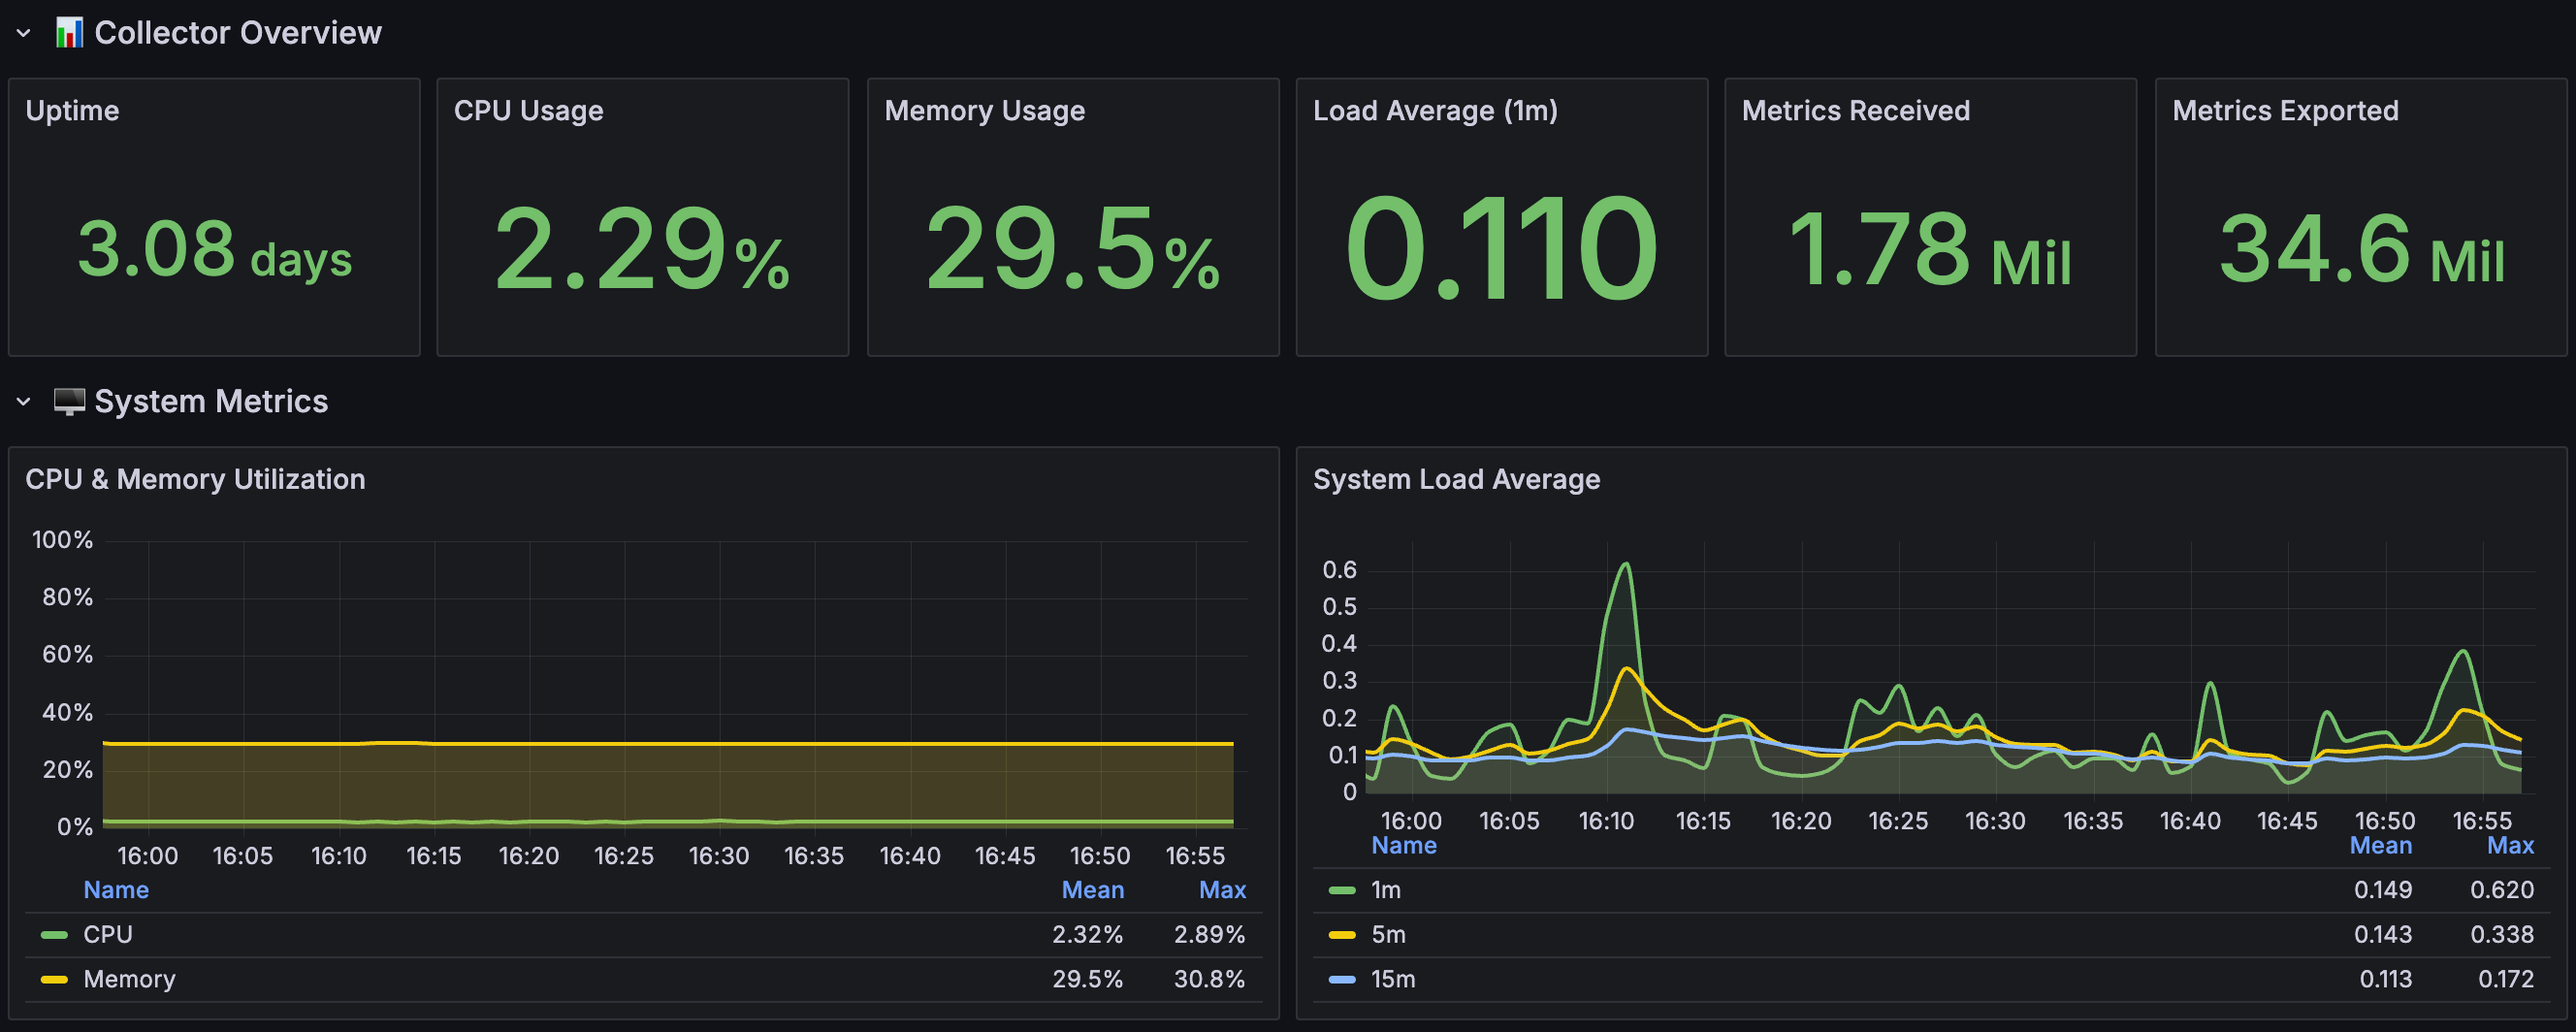
| Build dashboards | Query logs, traces, and metrics with SQL, add dashboard variables, and visualize results in Grafana panels. | Dashboards |
| Configure alerts | Evaluate SQL query results with Grafana Alerting and route notifications to configured contact points. | Alerting and Notification |
Log-to-trace correlation requires a populated trace ID in the log record, matching trace data in the warehouse, and a configured trace table in Doris App. Infrastructure dashboards also require the corresponding metrics receivers. Deploying an OTLP-only Collector does not automatically collect container standard output, host metrics, or Kubernetes metrics.
Log search
Trace analysis
Metrics dashboards
Plan your deployment
Start with the Quick Start to connect a local Collector and Grafana to an existing warehouse. For production, separate ingestion and query credentials, configure the required network path and TLS settings, and plan retention for your telemetry.
Capacity, latency, and cost depend on telemetry volume, indexing, retention, query concurrency, and cluster resources. Measure your own workload before sizing a production deployment. Collector and Grafana infrastructure are separate from VeloDB Cloud billing.