Metrics
VeloDB Cloud provides built-in metrics in the console and exposes raw metrics through the Metrics API. Use the console to inspect warehouse and cluster health interactively, or connect the Metrics API to your own Prometheus and Grafana stack for centralized observability.
View Metrics In The Console
On the Metrics page you can:
- View metrics by warehouse or by cluster.
- Use Starred to pin the metrics you care about across warehouses and clusters so they display together.
- Adjust the time selector to look at historical data up to the past 15 days.
- Enable auto-refresh for near-real-time updates (5-second interval).
Metrics are split into two categories: Basic Metrics (physical resource utilization) and Service Metrics (query / workload performance).
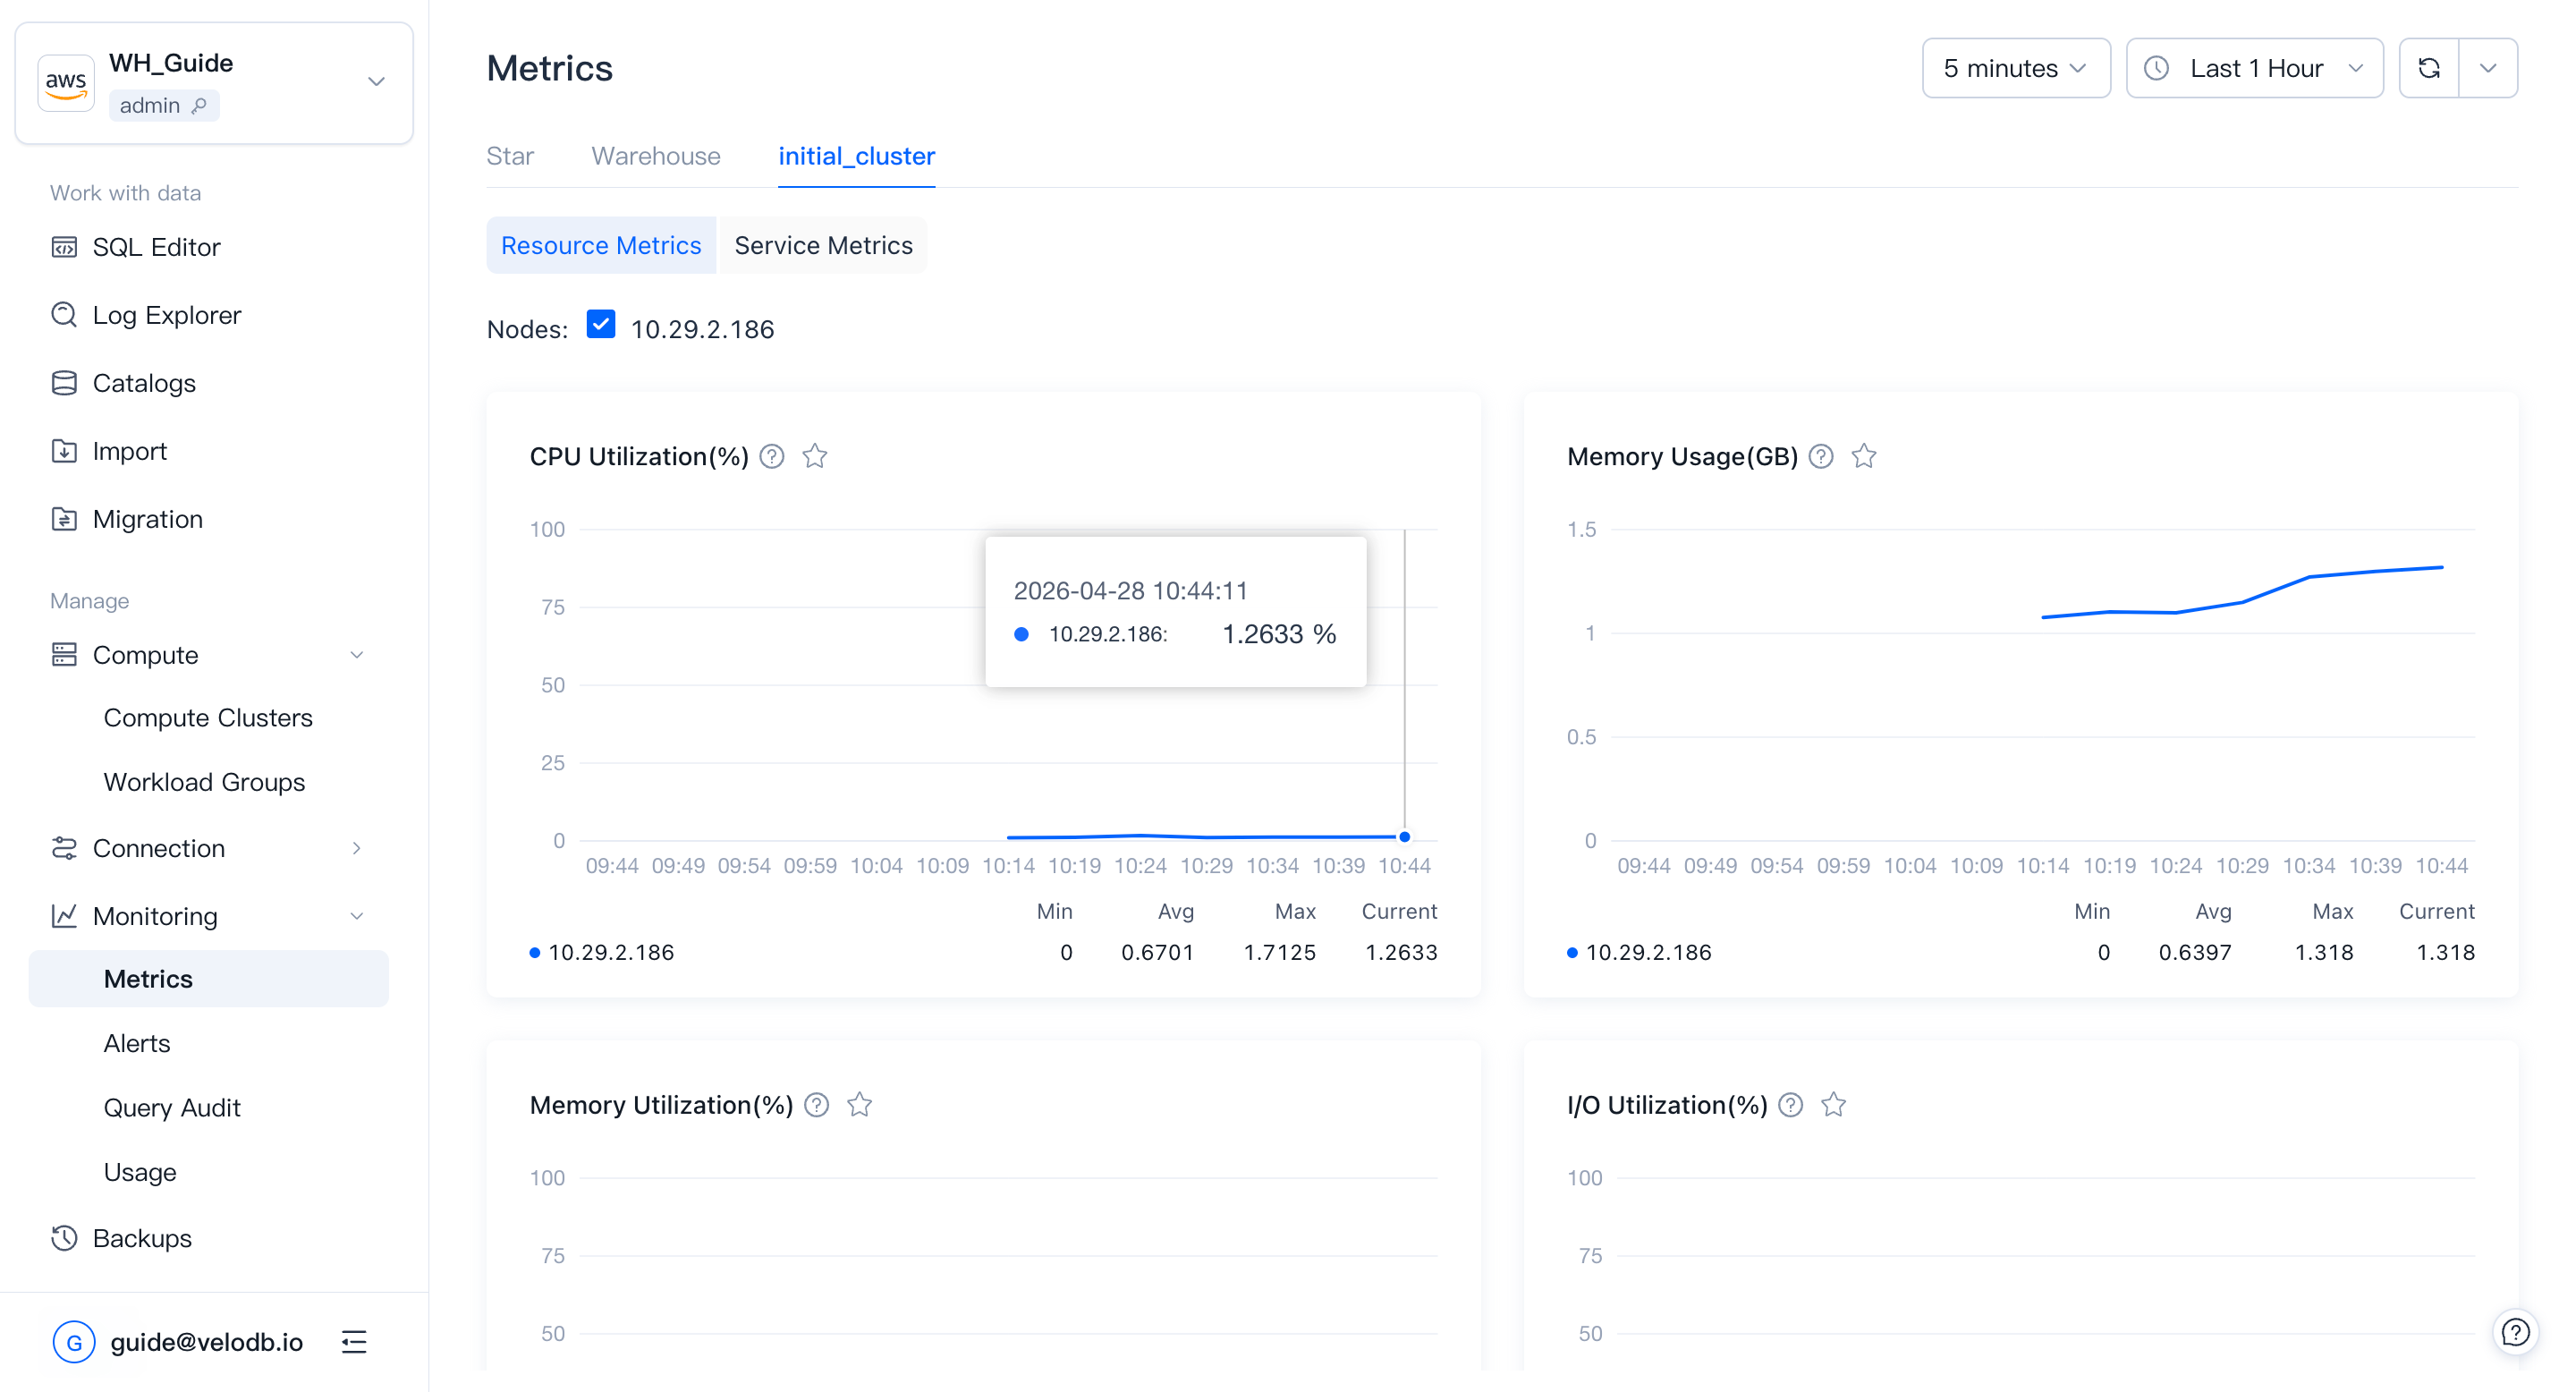
Basic Metrics
Basic metrics track physical utilization of the cluster by node. They help you judge whether the cluster is healthy in a given time range, and whether historical or current queries are affecting performance. This is useful input when planning to scale up, scale down, or optimize SQL.
| Metric | What it shows |
|---|---|
| CPU Utilization | CPU utilization percentage across all nodes. Useful to find quiet windows for scaling or other resource-heavy operations. |
| Memory Usage | Memory consumed by all nodes. Consistently high usage is a signal to scale up. |
| Memory Utilization | Memory utilization of all nodes. Consistently high utilization is a signal to scale up. |
| I/O Utilization | Disk I/O utilization. Consistently high values suggest adding more nodes for query performance. |
| Network Outbound Throughput | Average outbound speed per second per node (MB/s). Queries that read data over the network are slower; configure caching to reduce network reads. |
| Network Inbound Throughput | Average inbound speed per second per node (MB/s). |
| Cache Read Throughput | Per-second cache read throughput (MB/s). |
| Cache Write Throughput | Per-second cache write throughput (MB/s). |
Support range:
| Metric | Warehouse | Cluster |
|---|---|---|
| CPU Utilization | ✓ | ✓ |
| Memory Usage | ✓ | ✓ |
| Memory Utilization | ✓ | ✓ |
| I/O Utilization | ✓ | ✓ |
| Network Outbound Throughput | ✓ | ✓ |
| Network Inbound Throughput | ✓ | ✓ |
| Cache Read Throughput | — | ✓ |
| Cache Write Throughput | — | ✓ |
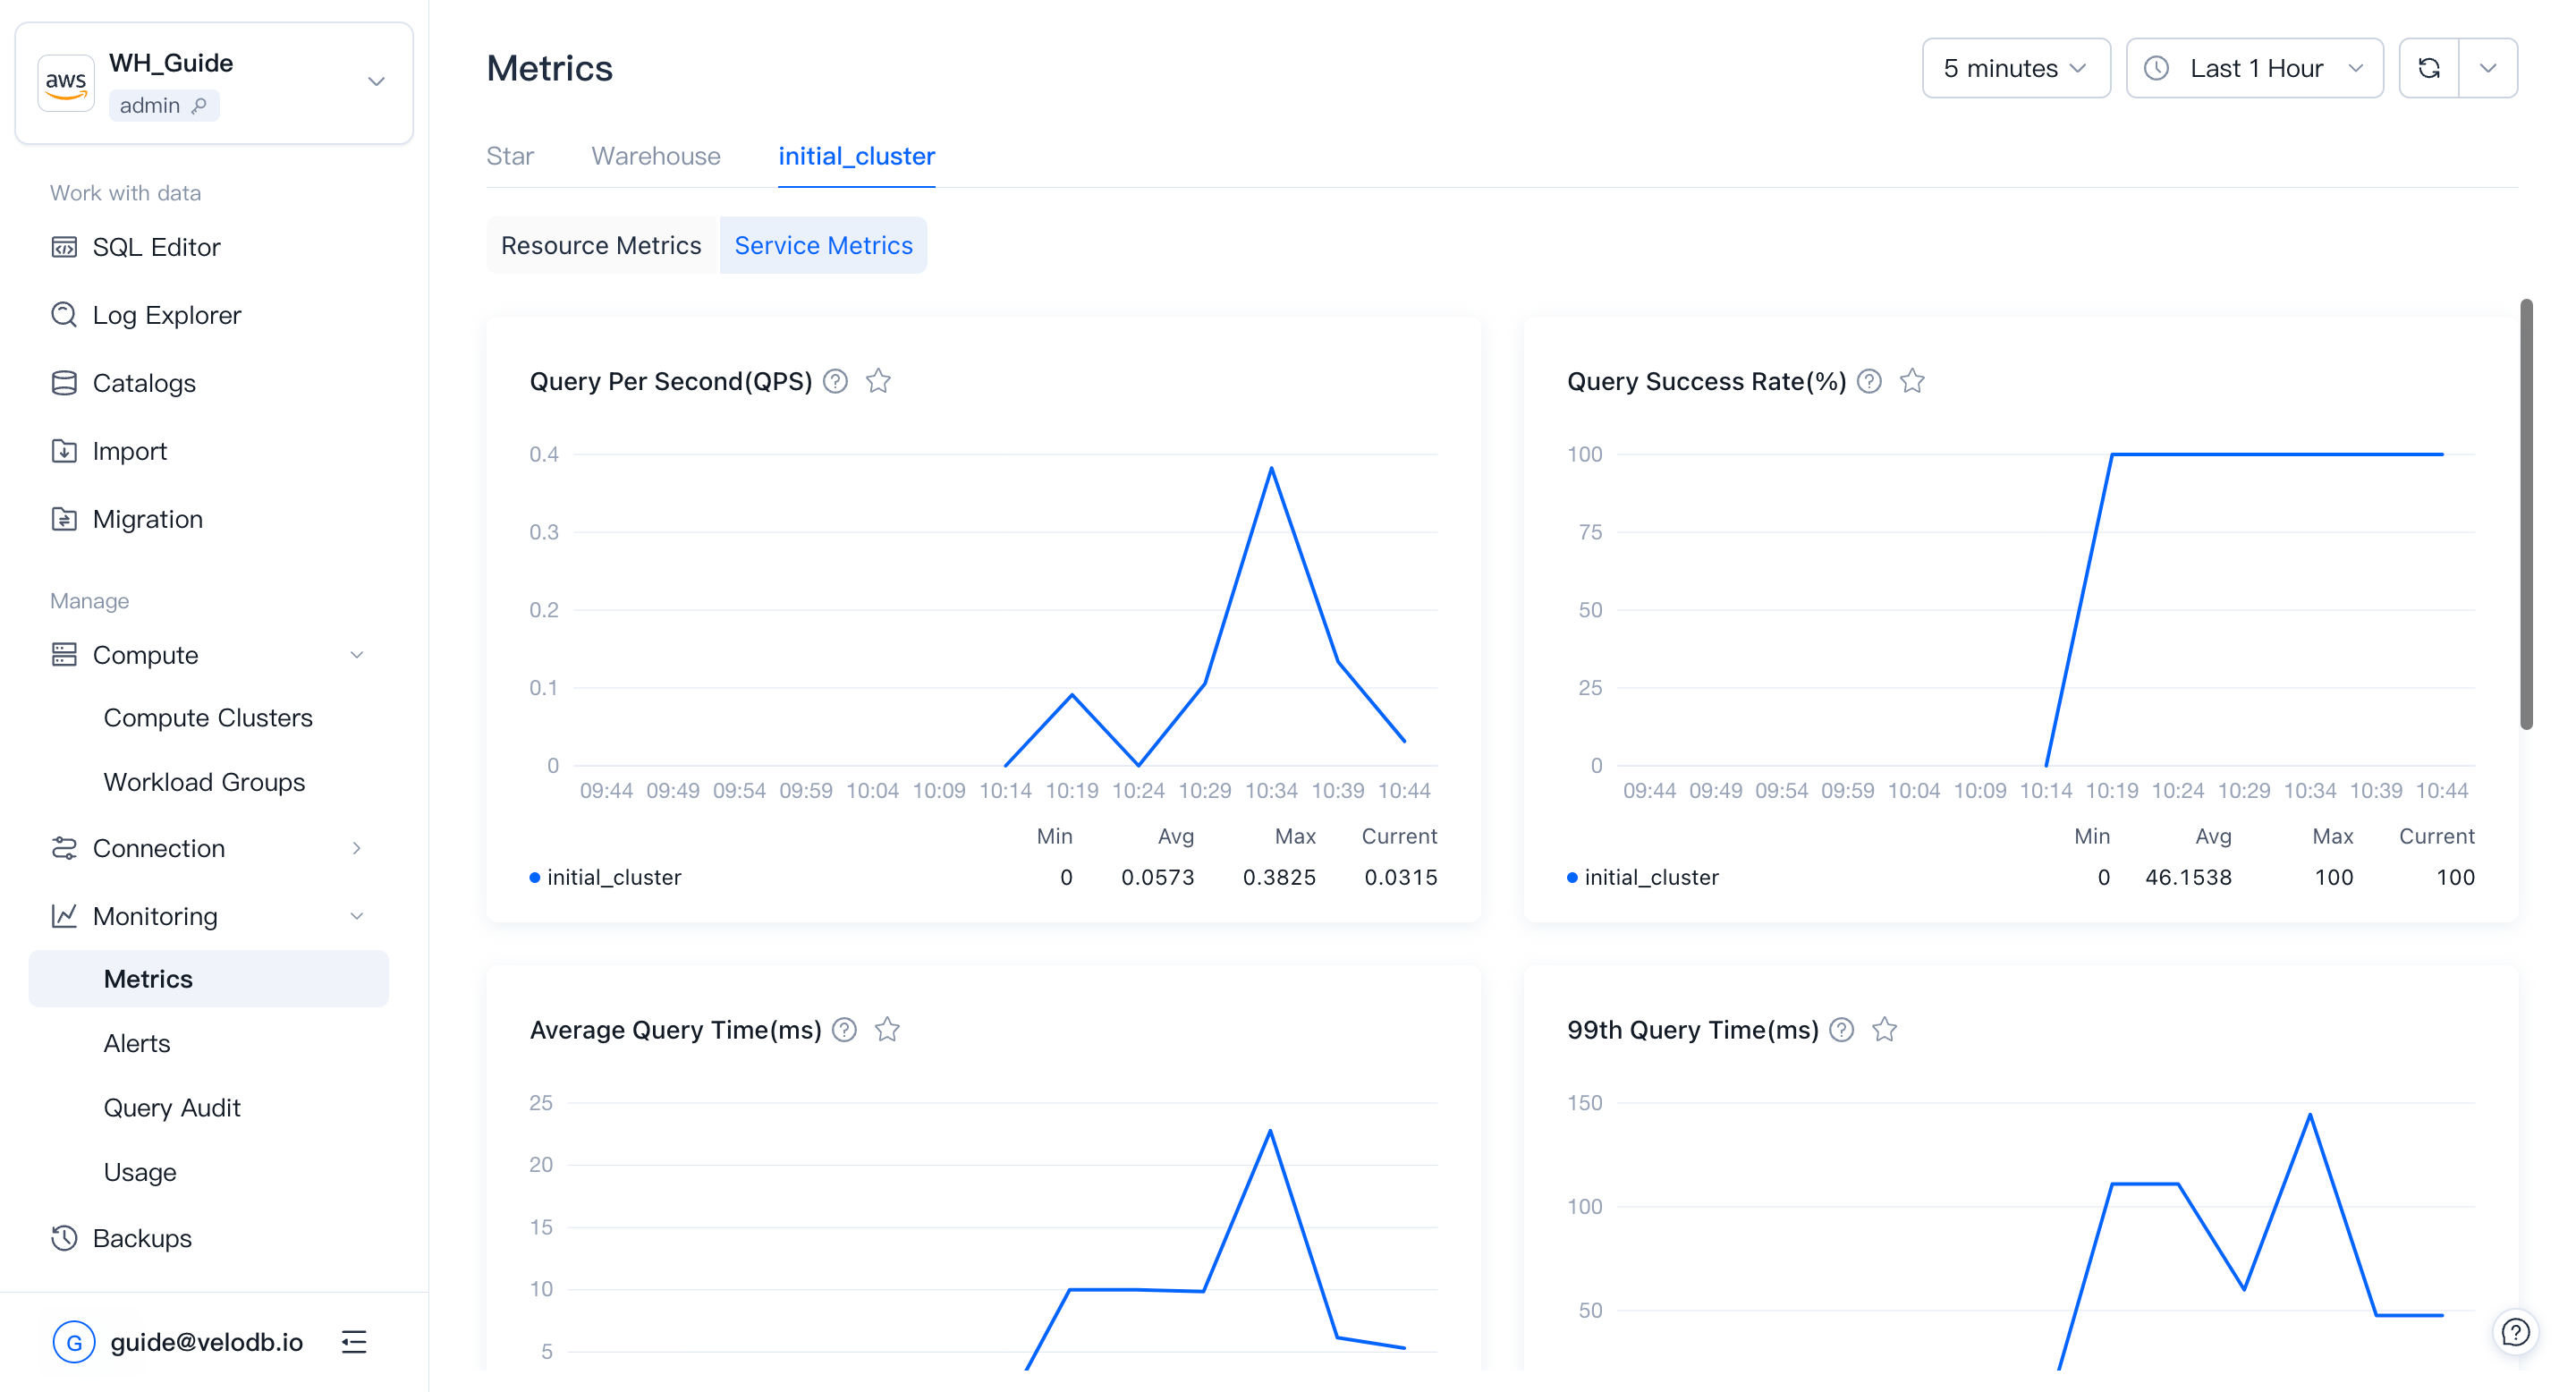
Service Metrics
Service metrics track query and workload behavior: how fast queries run, how many succeed, and how write paths behave.
| Metric | What it shows |
|---|---|
| Query Per Second (QPS) | Number of query requests per second. Peak QPS is a useful input when sizing a cluster. |
| Query Success Rate | Percentage of successful queries, updated per minute. Abnormal drops may indicate a cluster or node failure. |
| Dead Nodes | Number of dead nodes in the cluster. |
| Average Query Runtime | Average query time, updated per minute. Abnormal rises are a signal to investigate. |
| Query 99th Latency | Response time of the 99th-percentile query. Reflects the speed of slow queries. |
| Cache Hit Rate | Percentage of I/O operations served from cache. Low values suggest reviewing the cache policy or increasing cache space. |
| Remote Storage Read Throughput | Amount of data read from remote storage per unit time. |
| Sessions | Number of sessions for the warehouse (not split per cluster). |
| Load Rows Per Second | Rate at which records are being successfully written. |
| Load Bytes Per Second | Rate at which data volume is being written. |
| Finished Load Tasks | Number of load tasks completed in the recent period. Sharp changes may indicate a business anomaly. |
| Compaction Score | Data-file merging pressure. Higher score means more merging pressure. |
| Transaction Latency | Transaction latency of write tasks. Lower means data becomes queryable sooner. |
Support range:
| Metric | Warehouse | Cluster |
|---|---|---|
| Query Per Second | ✓ | ✓ |
| Query Success Rate | ✓ | ✓ |
| Dead Nodes | — | ✓ |
| Average Query Time | ✓ | ✓ |
| Query 99th Latency | ✓ | ✓ |
| Cache Hit Rate | — | ✓ |
| Remote Storage Read Throughput | — | ✓ |
| Sessions | ✓ | — |
| Load Rows Per Second | ✓ | ✓ |
| Load Bytes Per Second | ✓ | ✓ |
| Finished Load Tasks | ✓ | — |
| Compaction Score | — | ✓ |
| Transaction Latency | ✓ | — |
Metrics API
Use the Metrics API to scrape the raw metrics behind the Basic Metrics and Service Metrics described above into a self-hosted Prometheus or Grafana environment. Both warehouse-level and cluster-level responses include raw metrics for these categories; the difference is the scope of the returned data.
The Metrics API exposes two endpoints:
| API | Path | Description |
|---|---|---|
| QueryWarehouseMetrics | GET /v1/warehouse/{warehouseId}/metrics | Raw metrics for the warehouse. |
| QueryClusterMetrics | GET /v1/warehouse/{warehouseId}/cluster/{clusterId}/metrics | Raw metrics for the specified cluster. |
Both endpoints return Prometheus exposition format text:
Content-Type: text/plain; version=0.0.4; charset=utf-8
Prometheus can scrape the endpoints directly by using static_configs or file_sd_configs.
Endpoint
Each region and cloud provider has its own endpoint:
https://apps-api.<region>.<provider>.velodb.cloud
Use the stable cloudProvider and region identifiers returned by the Management API. Do not use marketing names or localized labels.
To discover available cloud providers and regions:
- List cloud providers:
GET /v1/cloud-providers - List regions for a cloud provider:
GET /v1/cloud-providers/{cloudProvider}/regions
# List cloud providers.
curl -H "X-API-Key: sk-xxxx" \
  https://api.velodb.cloud/v1/cloud-providers

# List regions for a cloud provider.
curl -H "X-API-Key: sk-xxxx" \
  https://api.velodb.cloud/v1/cloud-providers/aws/regions
Quick reference:
| Provider | Region | Endpoint |
|---|---|---|
aws | us-east-1 | https://apps-api.us-east-1.aws.velodb.cloud |
aws | ap-northeast-1 | https://apps-api.ap-northeast-1.aws.velodb.cloud |
aws | ap-southeast-1 | https://apps-api.ap-southeast-1.aws.velodb.cloud |
gcp | us-central1 | https://apps-api.us-central1.gcp.velodb.cloud |
A warehouse is reachable only through the endpoint for its own region and cloud provider. Cross-region or cross-provider requests return
404 Not Foundor fail authentication.
Authentication
Every Metrics API request must include an API key in the HTTP header:
X-API-Key: sk-xxxxxxxxxxxxxxxxxxxx
API keys are bound to an organization and inherit the role selected when the key is created. A key can access only warehouses inside its own organization.
To create an API key, see API Keys. The full key is shown only once when it is created. Copy and store it immediately.
Failed authentication returns 401 Unauthorized:
{
  "code": "Unauthorized.InvalidApiKey",
  "message": "invalid API key"
}
Rate Limit
Each API key is allowed 100 read requests per minute per endpoint. Exceeding the limit returns 429 Too Many Requests.
For Prometheus scraping, we recommend a scrape interval of at least 15 seconds and no more than about 30 targets per endpoint.
Query Warehouse Metrics
QueryWarehouseMetrics returns raw Prometheus metrics for FE nodes in a warehouse.
Request
GET /v1/warehouse/{warehouseId}/metrics
Host: apps-api.<region>.<provider>.velodb.cloud
X-API-Key: sk-xxxx
Path parameters
| Parameter | Description |
|---|---|
warehouseId | Warehouse ID, for example XXZ0RP. |
Response
| Field | Description |
|---|---|
| Status | 200 OK |
| Content type | text/plain; version=0.0.4; charset=utf-8 |
| Body | Prometheus exposition format text. The returned data covers Basic Metrics and Service Metrics at warehouse scope. |
Example:
curl -H "X-API-Key: sk-xxxx" \
  https://apps-api.ap-northeast-1.aws.velodb.cloud/v1/warehouse/XXZ0RP/metrics

# TYPE doris_fe_connection_total untyped
doris_fe_connection_total{cid="m-mqx8vdlm6b671apzob",custom_scheme="http",instance="10.29.12.139:8080",job="AWVA10OB",product="SAAS",provider="aws",region="us-east-1",user="admin",vpc_id="vpc-03313d4774a52fb93",wid="AWVA10OB"} 10 1780738809054
doris_fe_query_latency_ms_sum{cid="m-mqx8vdlm6b671apzob",custom_scheme="http",instance="10.29.12.139:8080",job="AWVA10OB",product="SAAS",provider="aws",region="us-east-1",vpc_id="vpc-03313d4774a52fb93",wid="AWVA10OB"} 35.55555555555556 1780733289054
# TYPE doris_fe_query_total untyped
doris_fe_query_total{cid="m-mqx8vdlm6b671apzob",cluster_id="c-v7hi1dbm6b6rimgod7",cluster_name="initial_cluster",custom_scheme="http",instance="10.29.12.139:8080",job="AWVA10OB",product="SAAS",provider="aws",region="us-east-1",vpc_id="vpc-03313d4774a52fb93",wid="AWVA10OB"} 21 1780733289054
# TYPE node_disk_io_time_seconds_total untyped
node_disk_io_time_seconds_total{cid="m-mqx8vdlm6b671apzob",device="nvme1n1",instance="10.29.12.139:9100",job="AWVA10OB",product="SAAS",provider="aws",region="us-east-1",vpc_id="vpc-03313d4774a52fb93",wid="AWVA10OB"} 220.19 1780733285342
# TYPE node_memory_Buffers_bytes untyped
node_memory_Buffers_bytes{cid="m-mqx8vdlm6b671apzob",instance="10.29.12.139:9100",job="AWVA10OB",product="SAAS",provider="aws",region="us-east-1",vpc_id="vpc-03313d4774a52fb93",wid="AWVA10OB"} 2.0322304e+08 1780733285342
# TYPE node_memory_Cached_bytes untyped
node_memory_Cached_bytes{cid="m-mqx8vdlm6b671apzob",instance="10.29.12.139:9100",job="AWVA10OB",product="SAAS",provider="aws",region="us-east-1",vpc_id="vpc-03313d4774a52fb93",wid="AWVA10OB"} 2.207244288e+09 1780733285342
Query Cluster Metrics
QueryClusterMetrics returns raw Prometheus metrics for a specified cluster.
Request
GET /v1/warehouse/{warehouseId}/cluster/{clusterId}/metrics
Host: apps-api.<region>.<provider>.velodb.cloud
X-API-Key: sk-xxxx
Path parameters
| Parameter | Description |
|---|---|
warehouseId | Warehouse ID. |
clusterId | Cluster ID. o- prefix means observer cluster; c- prefix means compute cluster. |
Response
| Field | Description |
|---|---|
| Status | 200 OK |
| Content type | text/plain; version=0.0.4; charset=utf-8 |
| Body | Prometheus exposition format text. The returned data covers Basic Metrics and Service Metrics at cluster scope. |
Example:
curl -H "X-API-Key: sk-xxxx" \
  https://apps-api.us-east-1.aws.velodb.cloud/v1/warehouse/XXZ0RP/cluster/m-fexxxxxxx/metrics

# TYPE doris_be_load_bytes untyped
doris_be_load_bytes{cid="c-v7hi1dbm6b6rimgod7",custom_scheme="http",instance="10.29.2.192:8040",job="AWVA10OB-c-v7hi1dbm6b6rimgod7",product="SAAS",provider="aws",region="us-east-1",vpc_id="vpc-03313d4774a52fb93",wid="AWVA10OB"} 3.042252e+06 1780735183262
# TYPE doris_be_num_io_bytes_read_from_cache untyped
doris_be_num_io_bytes_read_from_cache{cid="c-v7hi1dbm6b6rimgod7",custom_scheme="http",instance="10.29.2.192:8040",job="AWVA10OB-c-v7hi1dbm6b6rimgod7",product="SAAS",provider="aws",region="us-east-1",vpc_id="vpc-03313d4774a52fb93",wid="AWVA10OB"} 4.649776e+07 1780735183262
# TYPE doris_be_num_io_bytes_read_total untyped
doris_be_num_io_bytes_read_total{cid="c-v7hi1dbm6b6rimgod7",custom_scheme="http",instance="10.29.2.192:8040",job="AWVA10OB-c-v7hi1dbm6b6rimgod7",product="SAAS",provider="aws",region="us-east-1",vpc_id="vpc-03313d4774a52fb93",wid="AWVA10OB"} 4.649776e+07 1780735183262
# TYPE doris_be_streaming_load_requests_total untyped
doris_be_streaming_load_requests_total{cid="c-v7hi1dbm6b6rimgod7",custom_scheme="http",instance="10.29.2.192:8040",job="AWVA10OB-c-v7hi1dbm6b6rimgod7",product="SAAS",provider="aws",region="us-east-1",vpc_id="vpc-03313d4774a52fb93",wid="AWVA10OB"} 1357 1780735183262
# TYPE doris_be_tablet_base_max_compaction_score untyped
doris_be_tablet_base_max_compaction_score{cid="c-v7hi1dbm6b6rimgod7",custom_scheme="http",instance="10.29.2.192:8040",job="AWVA10OB-c-v7hi1dbm6b6rimgod7",product="SAAS",provider="aws",region="us-east-1",vpc_id="vpc-03313d4774a52fb93",wid="AWVA10OB"} 1 1780735183262
# TYPE doris_be_tablet_cumulative_max_compaction_score untyped
doris_be_tablet_cumulative_max_compaction_score{cid="c-v7hi1dbm6b6rimgod7",custom_scheme="http",instance="10.29.2.192:8040",job="AWVA10OB-c-v7hi1dbm6b6rimgod7",product="SAAS",provider="aws",region="us-east-1",vpc_id="vpc-03313d4774a52fb93",wid="AWVA10OB"} 4 1780735183262
Integrate With Prometheus
Because the Metrics API returns Prometheus exposition format directly, Prometheus can treat each endpoint as a scrape target.
Key points:
- Use
httpsas the scheme. - Set the per-target
__metrics_path__label because each path contains the warehouse ID or cluster ID. - Pass the API key through the
X-API-KeyHTTP header. - Use
file_sd_configsto manage multiple warehouses and clusters. Warehouses in different regions should point to their own endpoint host.
Prometheus 2.43+ supports custom headers through
http_headers.
Suggested directory layout:
prometheus/
  prometheus.yml
  targets/
    warehouse.yml
Example prometheus.yml:
scrape_configs:
  - job_name: velodb-warehouse
    scheme: https
    http_headers:
      X-API-Key:
        values:
          - sk-xxxxxxxxxxxxxxxxxxxx
    file_sd_configs:
      - files:
          - targets/warehouse.yml
        refresh_interval: 1m
Example targets/warehouse.yml:
- targets:
    - apps-api.us-east-1.aws.velodb.cloud
  labels:
    __metrics_path__: /v1/warehouse/XXZ0RP/metrics
    warehouse: XXZ0RP
    name: warehouse-a

- targets:
    - apps-api.ap-northeast-1.aws.velodb.cloud
  labels:
    __metrics_path__: /v1/warehouse/XXZ0RQ/metrics
    warehouse: XXZ0RQ
    name: warehouse-b

- targets:
    - apps-api.us-central1.gcp.velodb.cloud
  labels:
    __metrics_path__: /v1/warehouse/GCP0RS/cluster/CLUSTER001/metrics
    warehouse: GCP0RS
    cluster: CLUSTER001
    name: cluster-name1
If your Prometheus version does not support http_headers, use Prometheus authorization configuration or place a reverse proxy, such as Nginx or Envoy, in front of the scraper to inject X-API-Key.
Metric Labels
Every sample includes fixed labels injected by VeloDB Cloud:
| Label | Meaning |
|---|---|
provider | Cloud provider, such as aws, gcp, or azure. |
region | Cloud region, such as us-east-1 or ap-northeast-1. |
wid | Warehouse ID. |
cid | Cluster ID. |
instance | Node address, for example 10.29.0.7:8080. |
vpc_id | VPC ID hosting the warehouse. |
product | Product identifier. |
The trailing integer on each sample line is the Prometheus-side collection timestamp in milliseconds.
FAQ
Is there a PromQL query endpoint such as /api/v1/query?
No. The Metrics API exposes raw metrics endpoints for Prometheus scraping. For interactive exploration, use the built-in Metrics page in the VeloDB Cloud console or query your own Prometheus after scraping the metrics.
Is the standard /metrics path supported?
No. Use /v1/warehouse/{warehouseId}/metrics or /v1/warehouse/{warehouseId}/cluster/{clusterId}/metrics.
Should I use Authorization or X-API-Key?
Use X-API-Key. HTTP header names are case-insensitive.
How do I find my provider, region, warehouse ID, and cluster ID?
You can find them in the VeloDB Cloud console. For automation, use the Management API:
GET /v1/cloud-providersGET /v1/cloud-providers/{cloudProvider}/regionsGET /v1/warehousesGET /v1/warehouses/{warehouseId}/clusters
Are private endpoints or IP allowlists supported?
Metrics API endpoints are public HTTPS endpoints secured by API key authentication and rate limiting. Contact VeloDB Cloud support if you need private connectivity.