概要
メモリ管理はDorisの最も重要なコンポーネントの1つです。Dorisの動作中、ロードとクエリの両方が大量のメモリ操作に依存しています。メモリ管理の品質は、Dorisの安定性とパフォーマンスに直接影響します。
MPPアーキテクチャに基づくOLAPデータベースとして、Apache Dorisはディスクからメモリにデータをロードした後、オペレータ間でストリーミングおよび計算を行い、計算の中間結果をメモリに保存します。この方法により、頻繁なディスクI/O操作を削減し、複数のマシンと複数のコアの並列計算能力を最大限に活用することで、パフォーマンスにおいて大きな優位性を示すことができます。
複雑な計算や巨大なメモリリソース消費を伴う大規模な操作に直面した場合、効果的なメモリ割り当て、統計、および制御がシステムの安定性において非常に重要な役割を果たします - より高速なメモリ割り当て速度はクエリパフォーマンスを効果的に向上させ、メモリ割り当て、追跡、制限により、メモリホットスポットが発生しないことを保証し、メモリ不足に適時かつ正確に対応し、OOMやクエリ失敗を可能な限り回避します。この一連のメカニズムにより、システムの安定性が大幅に向上します。同時に、より正確なメモリ統計は、大規模なクエリがディスクにフォールバックするための基盤でもあります。
Doris BEメモリ構造
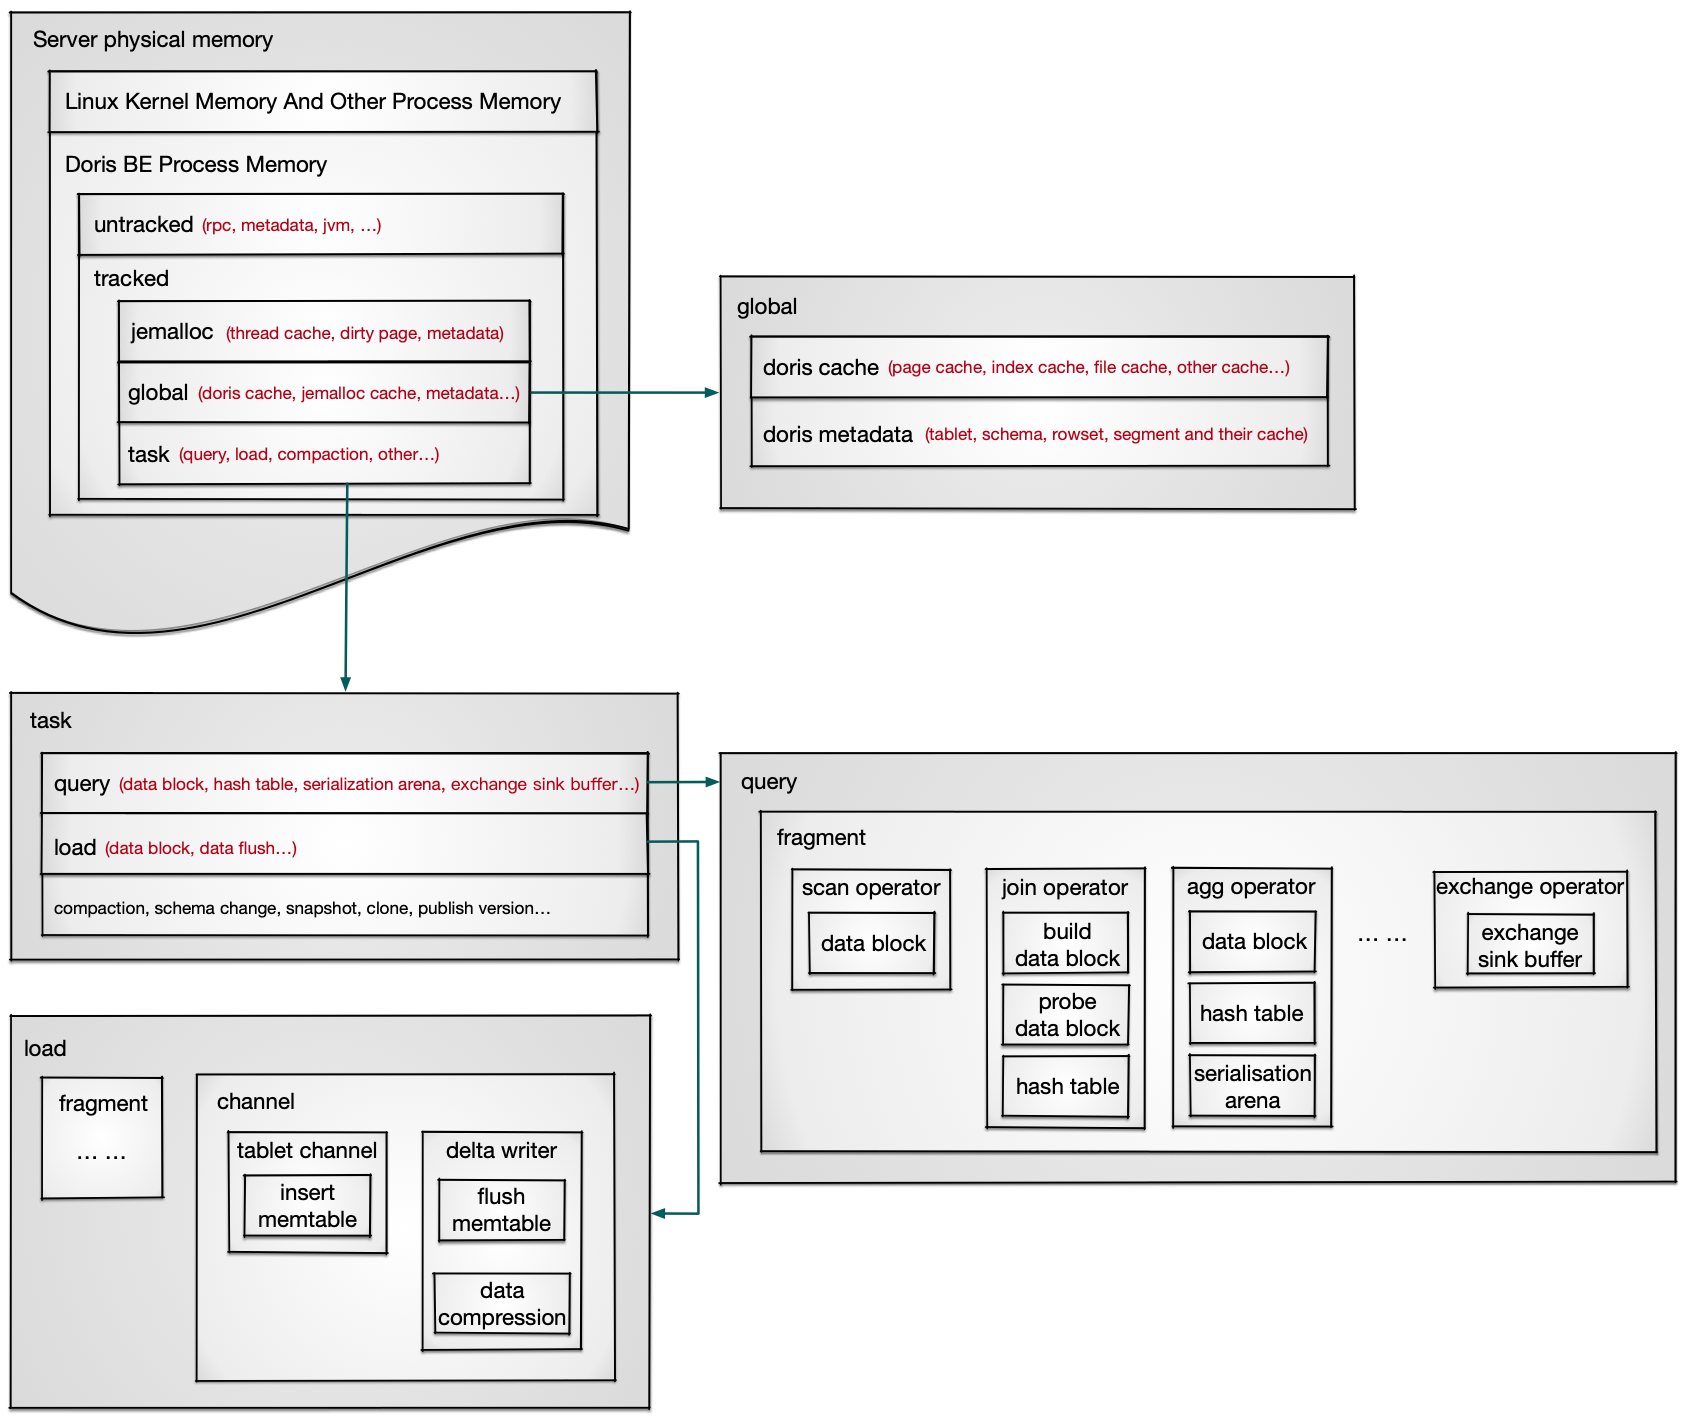
サーバー physical memory: The physical memory used by all processes on the server, MemTotal seen by `cat /proc/meminfo` or `free -h`.
    |
    |---> Linux Kernel Memory And Other Process Memory: Memory used by the Linux kernel and other processes.
    |
    |---> Doris BE Process Memory: The memory used by the Doris BE process. The upper limit is the server physical memory minus the memory used by the Linux kernel and other processes, or the memory size configured by the Cgroup.
            |
            |---> Untracked: Memory that is not tracked and managed, including RPC, JVM, some metadata, etc. JVM is used when accessing external tables or using Java UDF.
            |
            |---> tracked: Memory that is tracked and managed, allowing real-time viewing, automatic memory recycling, and size control through parameters.
                    |
                    |---> jemalloc: The cache and metadata managed by jemalloc support parameter control and are automatically recycled when memory is insufficient.
                    |
                    |---> global: Doris globally shared memory, mainly including cache and metadata.
                    |       |
                    |       |---> doris cache: Doris manages its own cache, which supports controlling capacity and elimination time through parameters separately, and automatically reclaims when memory is insufficient.
                    |       |
                    |       |---> doris metadata: metadata of data stored on BE, including a series of memory data structures such as data schema and their caches.
                    |
                    |---> Task: The memory used by the tasks executed on Doris, which is expected to be released after the task is completed, including query, load, compaction, etc.
                    |       |
                    |       |---> query: Memory used during the query. A query is split into multiple fragments and executed separately, connected by data shuffle.
                    |       |       |
                    |       |       |---> Fragment: A fragment is split into multiple operators and executed in the form of a pipeline.
                    |       |       |       |
                    |       |       |       |---> operator: includes memory data structures such as data block, hash table, arena, exchange sink buffer, etc.
                    |       |
                    |       |---> load: Memory used during data load. Data load includes two stages: fragment reading and channel writing data.
                    |       |       |
                    |       |       |---> fragment: Same as query fragment execution, stream load usually only has scan operator.
                    |       |       |
                    |       |       |---> channel: The tablet channel writes data to a temporary data structure called memtable, and then the delta writer compresses the data and writes it to the file.
Memory View
Doris BEはMemory Trackerを使用してプロセスのメモリ使用量を記録し、Webページでの表示をサポートし、メモリ関連のエラーが報告された際にBEログに出力して、メモリの分析とトラブルシューティングを行います。
リアルタイムメモリ統計
リアルタイムメモリ統計は、Doris BEのWebページhttp://{be_host}:{be_web_server_port}/mem_trackerで表示できます。これはtype=overviewのMemory Trackerによって追跡された現在のメモリサイズとピークメモリサイズを表示し、Query/Load/コンパクション/Globalなどが含まれます。be_web_server_portのデフォルト値は8040です。
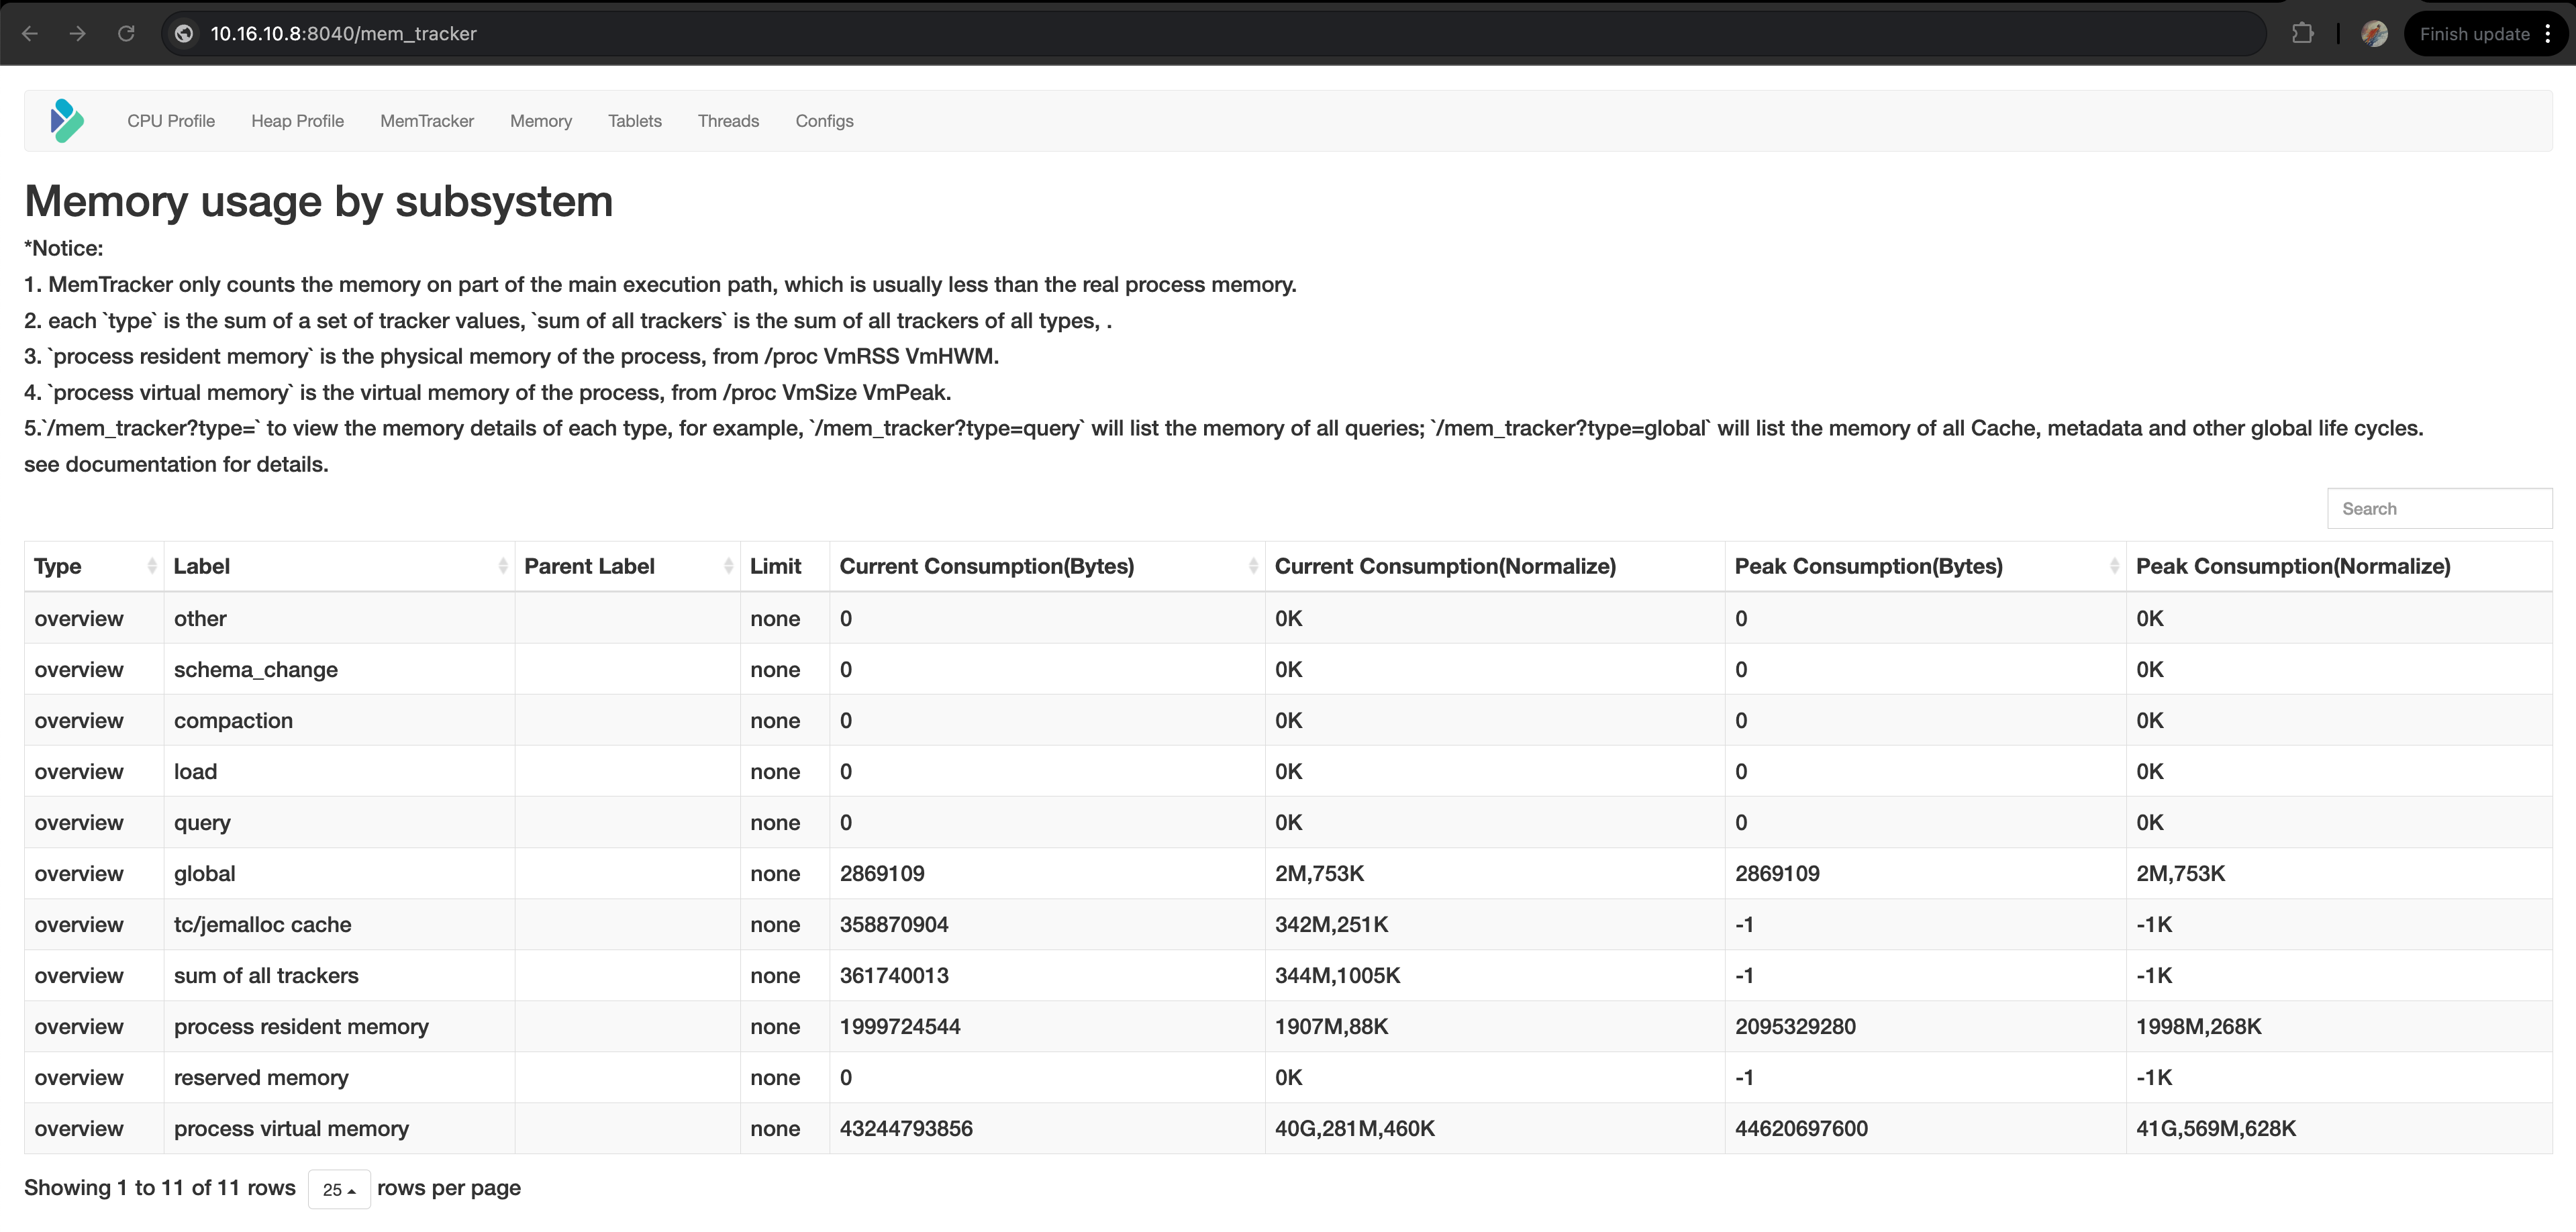
Memory Trackerは異なるタイプに分かれています。type=overviewのMemory Trackerの中で、process resident memory、process virtual memory、sum of all trackersを除き、他のtype=overviewのMemory Trackerの詳細はhttp://{be_host}:{be_web_server_port}/mem_tracker?type=Labelで表示できます。
Memory Trackerには以下のプロパティがあります:
- Label: Memory Trackerの名前
- Current Consumption(Bytes): 現在のメモリ値、単位はB
- Current Consumption(Normalize): 現在のメモリ値の.G.M.K形式での出力
- Peak Consumption (Bytes): BEプロセス開始後のピークメモリ値、単位はB、BEの再起動後にリセットされる
- Peak Consumption (Normalize): BEプロセス開始後のピークメモリ値の.G.M.K形式での出力、BEの再起動後にリセットされる
- Parent Label: 2つのMemory Tracker間の親子関係を示すために使用される。Child Trackerによって記録されるメモリはParent Trackerのサブセット。同じParentを持つ異なるTrackerによって記録されるメモリは交差する場合がある
Memory Trackerの詳細については、Memory Trackerを参照してください。
過去のメモリ統計
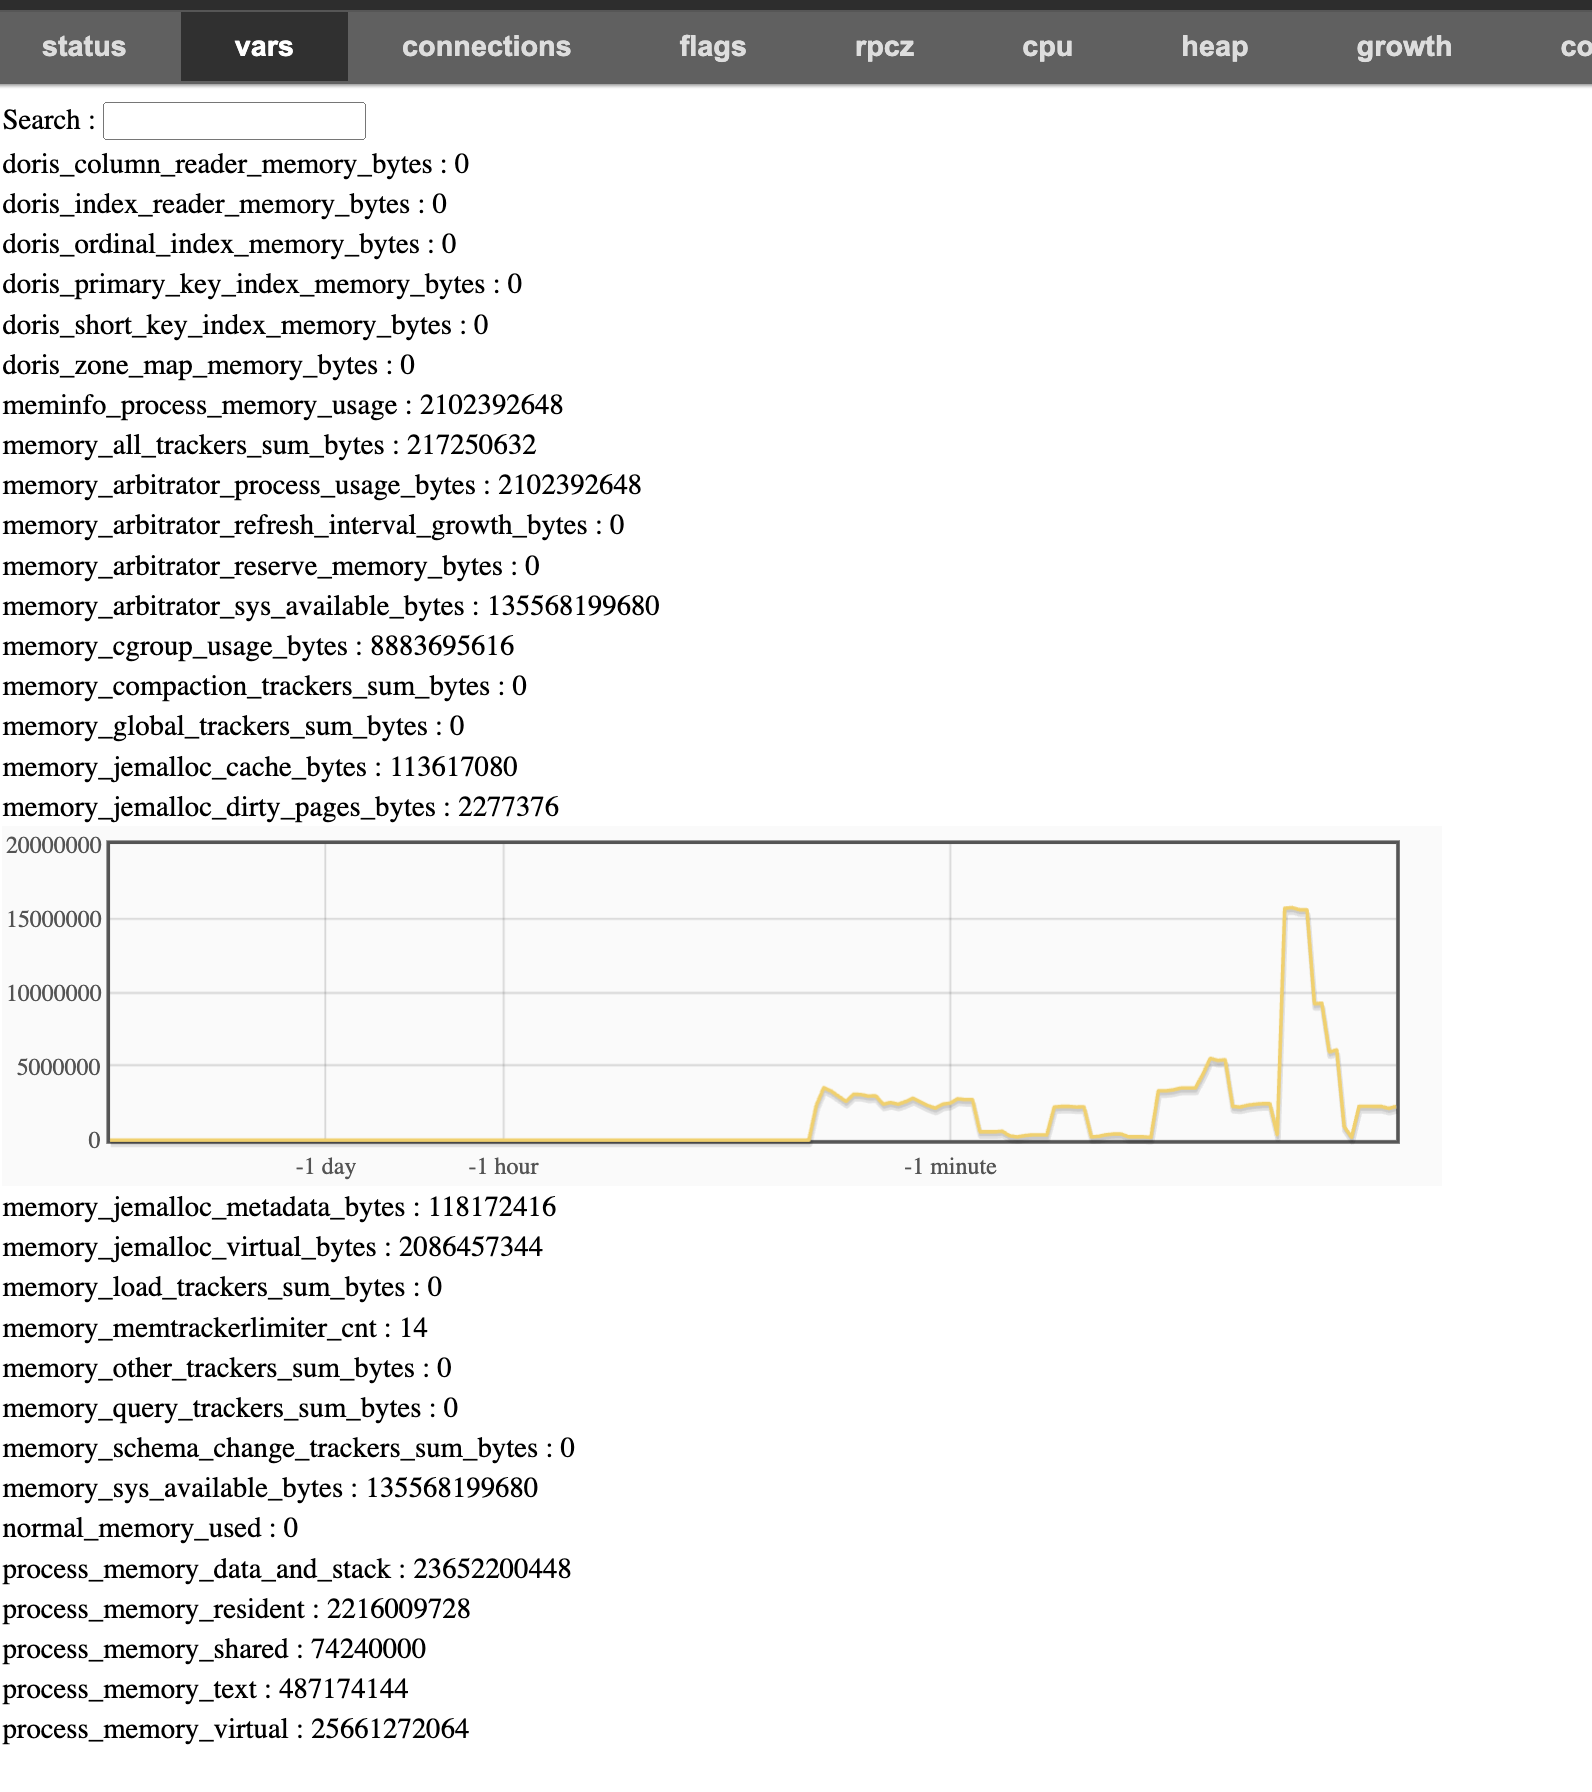
過去のメモリ統計は、Doris BEのBvarページhttp://{be_host}:{brpc_port}/vars/*memory_*で表示できます。リアルタイムメモリ統計ページhttp://{be_host}:{be_web_server_port}/mem_trackerを使用してMemory Tracker Label下のBvarページを検索し、対応するMemory Trackerによって追跡されたメモリサイズの変化傾向を取得します。brpc_portのデフォルト値は8060です。
エラープロセスのメモリが制限を超えるか利用可能なメモリが不足した場合、be/log/be.INFOログでMemory Tracker 要約を見つけることができます。これにはタイプ=overviewとタイプ=globalのすべてのMemory Trackerが含まれ、その時点でのメモリ状態の分析に役立ちます。詳細については、Memory ログ Analysisを参照してください。
Memory Analysis
type=overviewのMemory Trackerを上記のメモリ構造のtracked下の各メモリ部分に対応させます:
Doris BE Process Memory
    |
    |---> tracked: corresponds to `MemTrackerLimiter Label=sum of all trackers, タイプ=overview`, which is all the memory counted by the Memory Tracker, that is, the sum of the Current Consumption of other Memory Trackers with `type=overview` except `Label=process resident memory` and `Label=process virtual memory`.
            |
            |---> jemalloc
            |       |
            |       |---> jemalloc cache: corresponds to `MemTrackerLimiter Label=tc/jemalloc_cache, タイプ=overview`. The Jemalloc cache includes two parts: Dirty Page and Thread Cache.
            |       |
            |       |---> jemalloc metadata: Corresponding to `MemTrackerLimiter Label=tc/jemalloc_metadata, タイプ=overview`, Metadata of Jemalloc.
            |
            |---> global: corresponds to `MemTrackerLimiter Label=global, タイプ=overview`, including global Memory Trackers with the same life cycle and process such as Cache, metadata, and decompression. The web page `http://{be_host}:{be_web_server_port}/mem_tracker?type=global` displays all Memory Trackers of `type=global`.
            |
            |---> task
            |       |
            |       |---> query: corresponds to `MemTrackerLimiter Label=query, タイプ=overview`, which is the sum of Current Consumption of all Query Memory Trackers. The web page `http://{be_host}:{be_web_server_port}/mem_tracker?type=query` displays all Memory Trackers of `type=query`.
            |       |
            |       |---> load: corresponds to `MemTrackerLimiter Label=load, タイプ=overview`, the sum of Current Consumption of all Load Memory Trackers. The web page `http://{be_host}:{be_web_server_port}/mem_tracker?type=load` displays all Memory Trackers of `type=load`.
            |       |
            |       |---> reserved: corresponds to `MemTrackerLimiter Label=reserved_memory, タイプ=overview`. The reserved memory is used when query the Hash Table and other memory-intensive behaviors. Before query the Hash Table, the memory of the Hash Table to be constructed will be reserved from the Memory Tracker to ensure that subsequent memory requests can be met.
            |       |
            |       |---> compaction: corresponds to `MemTrackerLimiter Label=compaction, タイプ=overview`, the sum of Current Consumption of all コンパクション Memory Trackers. The web page `http://{be_host}:{be_web_server_port}/mem_tracker?type=compaction` displays all Memory Trackers of `type=compaction`.
            |       |
            |       |---> schema_change: corresponds to `MemTrackerLimiter Label=schema_change, タイプ=overview`, the sum of Current Consumption of all Schema Change Memory Trackers. The web page `http://{be_host}:{be_web_server_port}/mem_tracker?type=schema_change` displays all Memory Trackers of `type=schema_change`.

            |       |
            |       |---> other: corresponds to `MemTrackerLimiter Label=other, タイプ=overview`, the total memory of other tasks except the above, such as EngineAlterTabletTask, EngineCloneTask, CloudEngineCalcDeleteBitmapTask, SnapshotManager, etc. The web page `http://{be_host}:{be_web_server_port}/mem_tracker?type=other` displays all Memory Trackers of `type=other`.
    |
    |---> Doris BE process physical memory, corresponding to `MemTrackerLimiter Label=process resident memory, タイプ=overview`, Current Consumption is taken from VmRSS in `/proc/self/status`, Peak Consumption is taken from VmHWM in `/proc/self/status`.
    |
    |---> Doris BE process virtual memory, corresponding to `MemTrackerLimiter Label=process virtual memory, タイプ=overview`, Current Consumption is taken from VmSize in `/proc/self/status`, and Peak Consumption is taken from VmPeak in `/proc/self/status`.
上記のメモリ構造における各メモリ部分の分析方法:
メモリ問題FAQ
一般的なメモリ問題を分析するには、Memory problem FAQを参照してください。
メモリ制御戦略
Doris BEプロセスの効率的で制御可能なメモリを保証するメモリ割り当て、監視、リサイクルの紹介については、Memory Control Strategyを参照してください。