Search and Analysis
Search and analysis is launched by VeloDB Studio. It is a query tool for log analysis scenarios, which can easily search, query and count logs.
Introduction to search and analysis functions
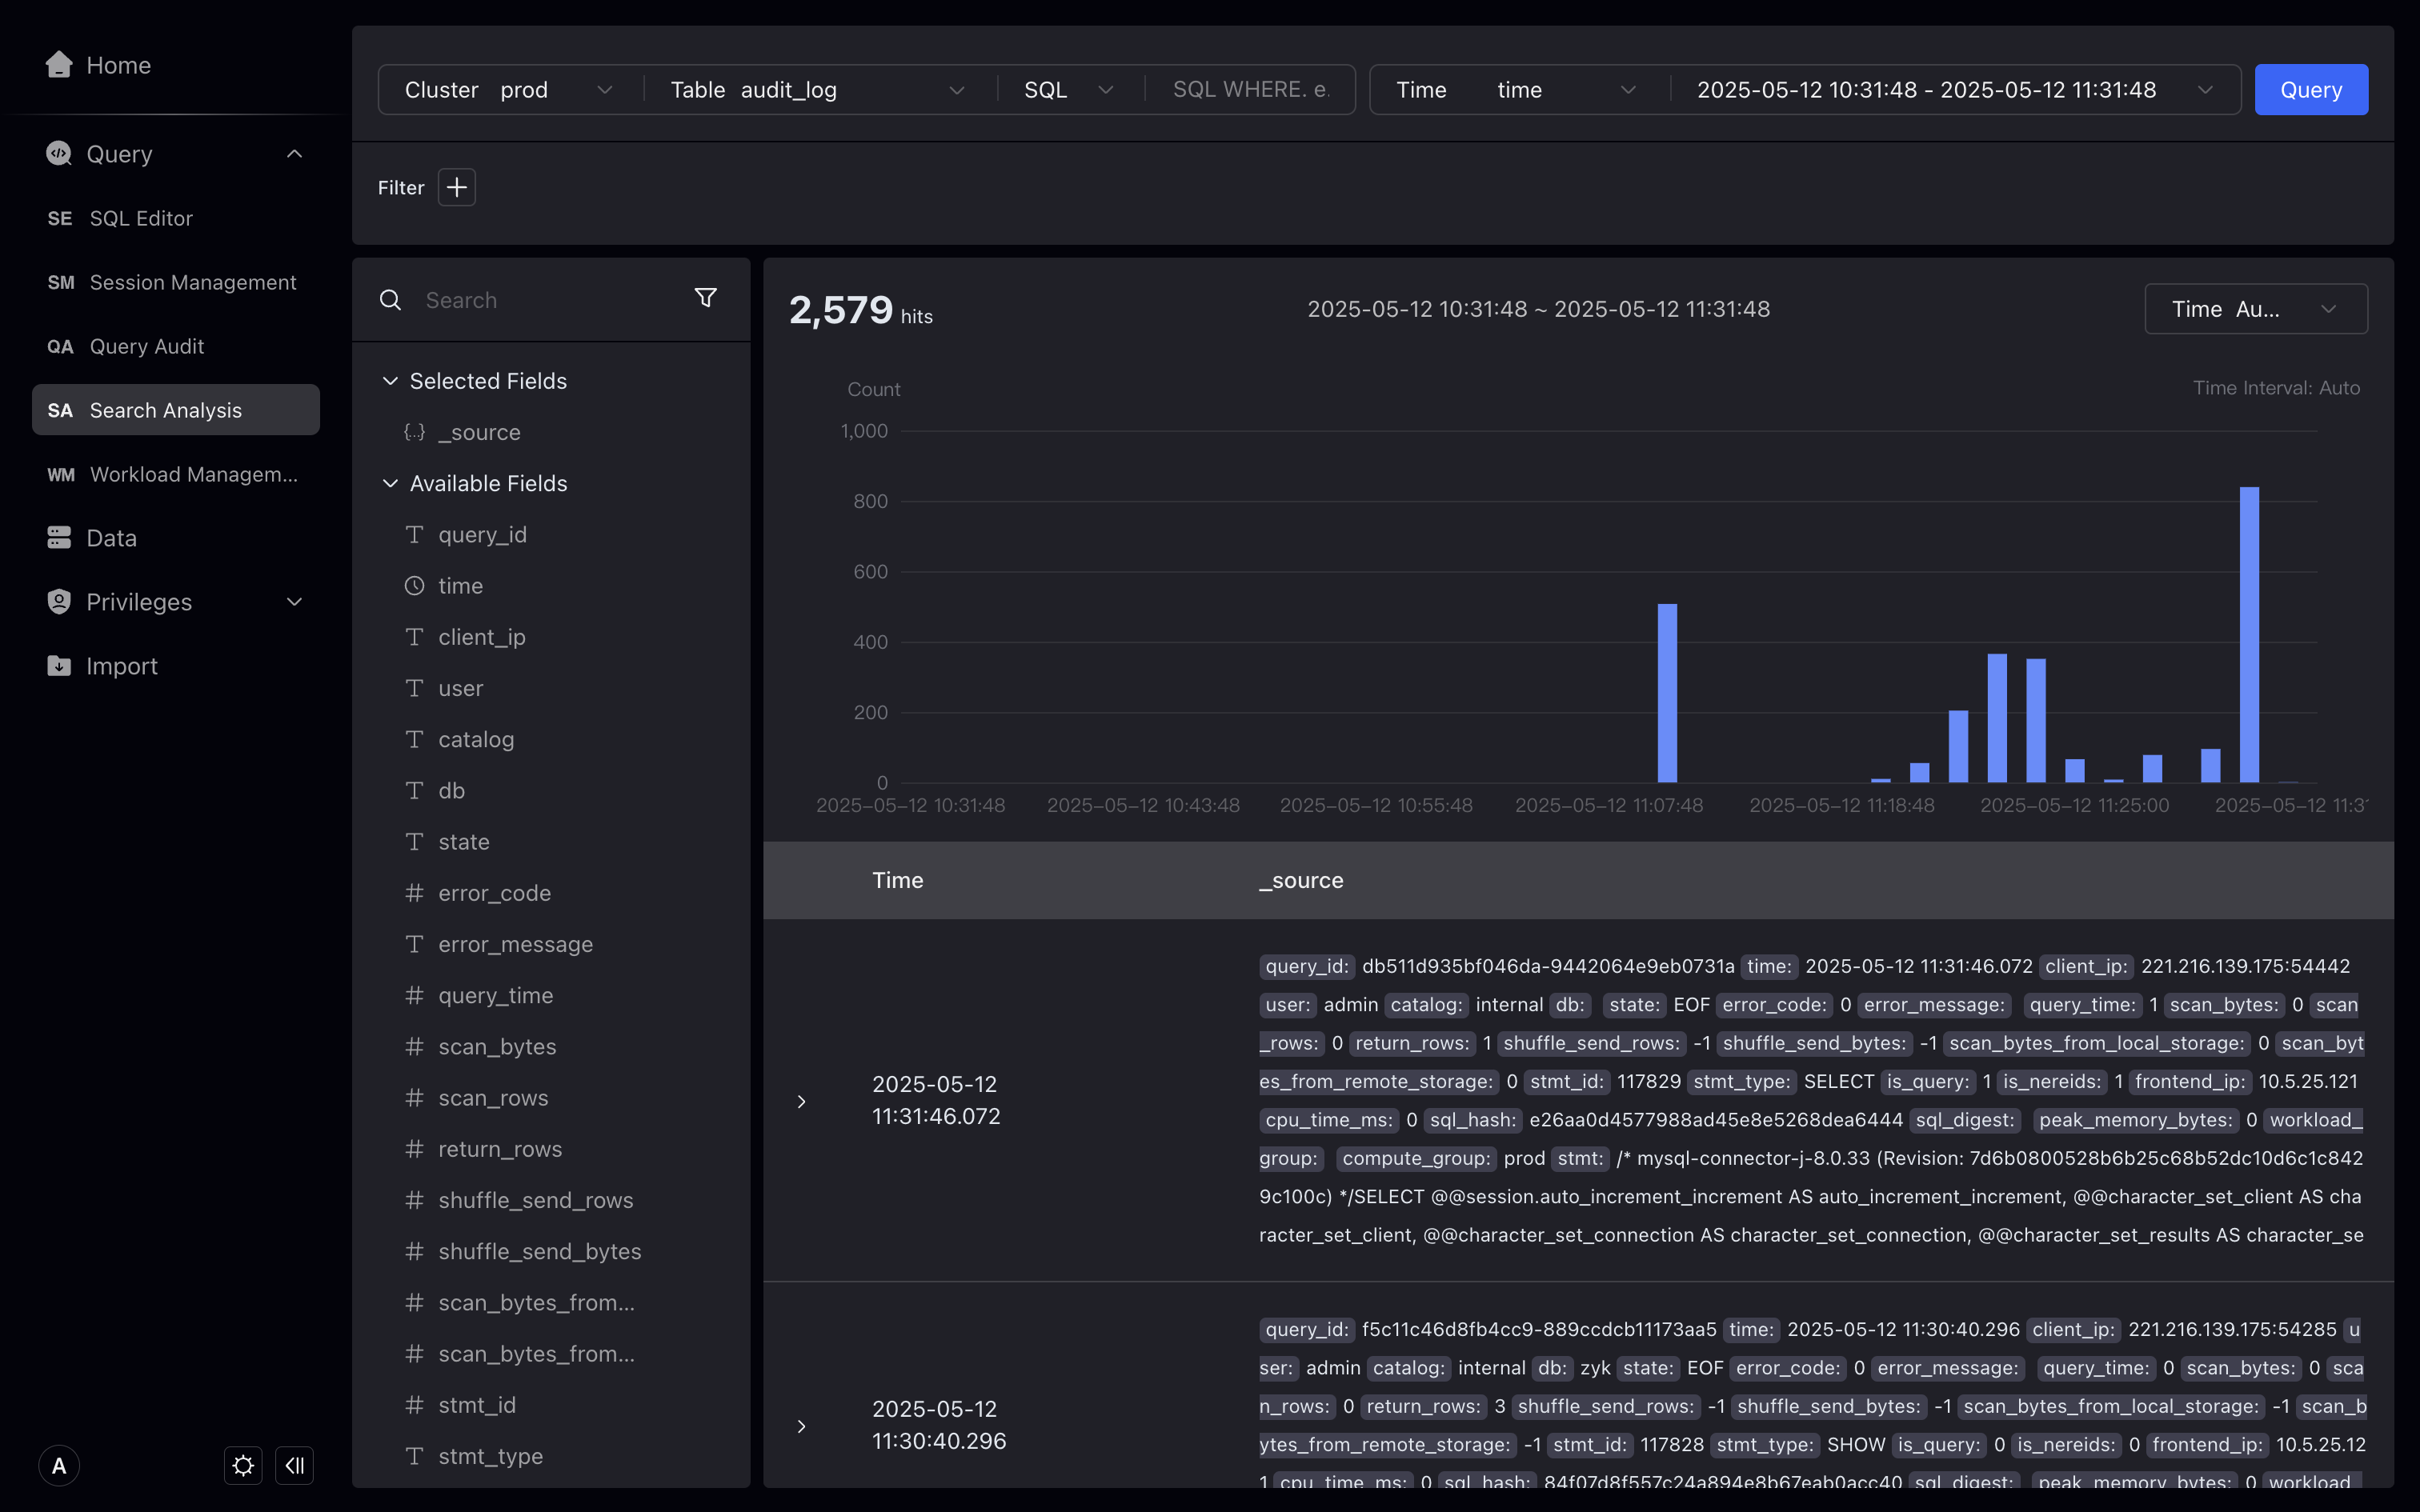
The interactive search and analysis interface is similar to the Kibana Discover page, which optimizes in-depth experience for log retrieval and is divided into 4 areas:
-
Input area at the top: Select the cluster, table, time field, and query time period. The main input box supports two modes: keyword retrieval and SQL.
-
The field display and selection area on the left: Display all fields in the current table. You can select which fields are displayed in the detailed display area on the right. Hovering over the field will show the 5 values and the proportion of the occurrence of this field. You can further filter by value. The filtering conditions are reflected in the filtering part of the input area.
-
The trend chart display and interaction area in the middle: Display the number of logs that meet the conditions at a certain time interval. Users can select a period of time in the box on the trend chart to adjust the query time period.
-
Detailed data display and interaction area below: Display log details, you can click to view the details of a certain log. It supports two formats: table and JSON. The table form also supports interactive creation of filter conditions.
Click Query > Search Analysis and select the table as internal_schema > audit_log, Studio will automatically query the fields in the table and select the first time field.
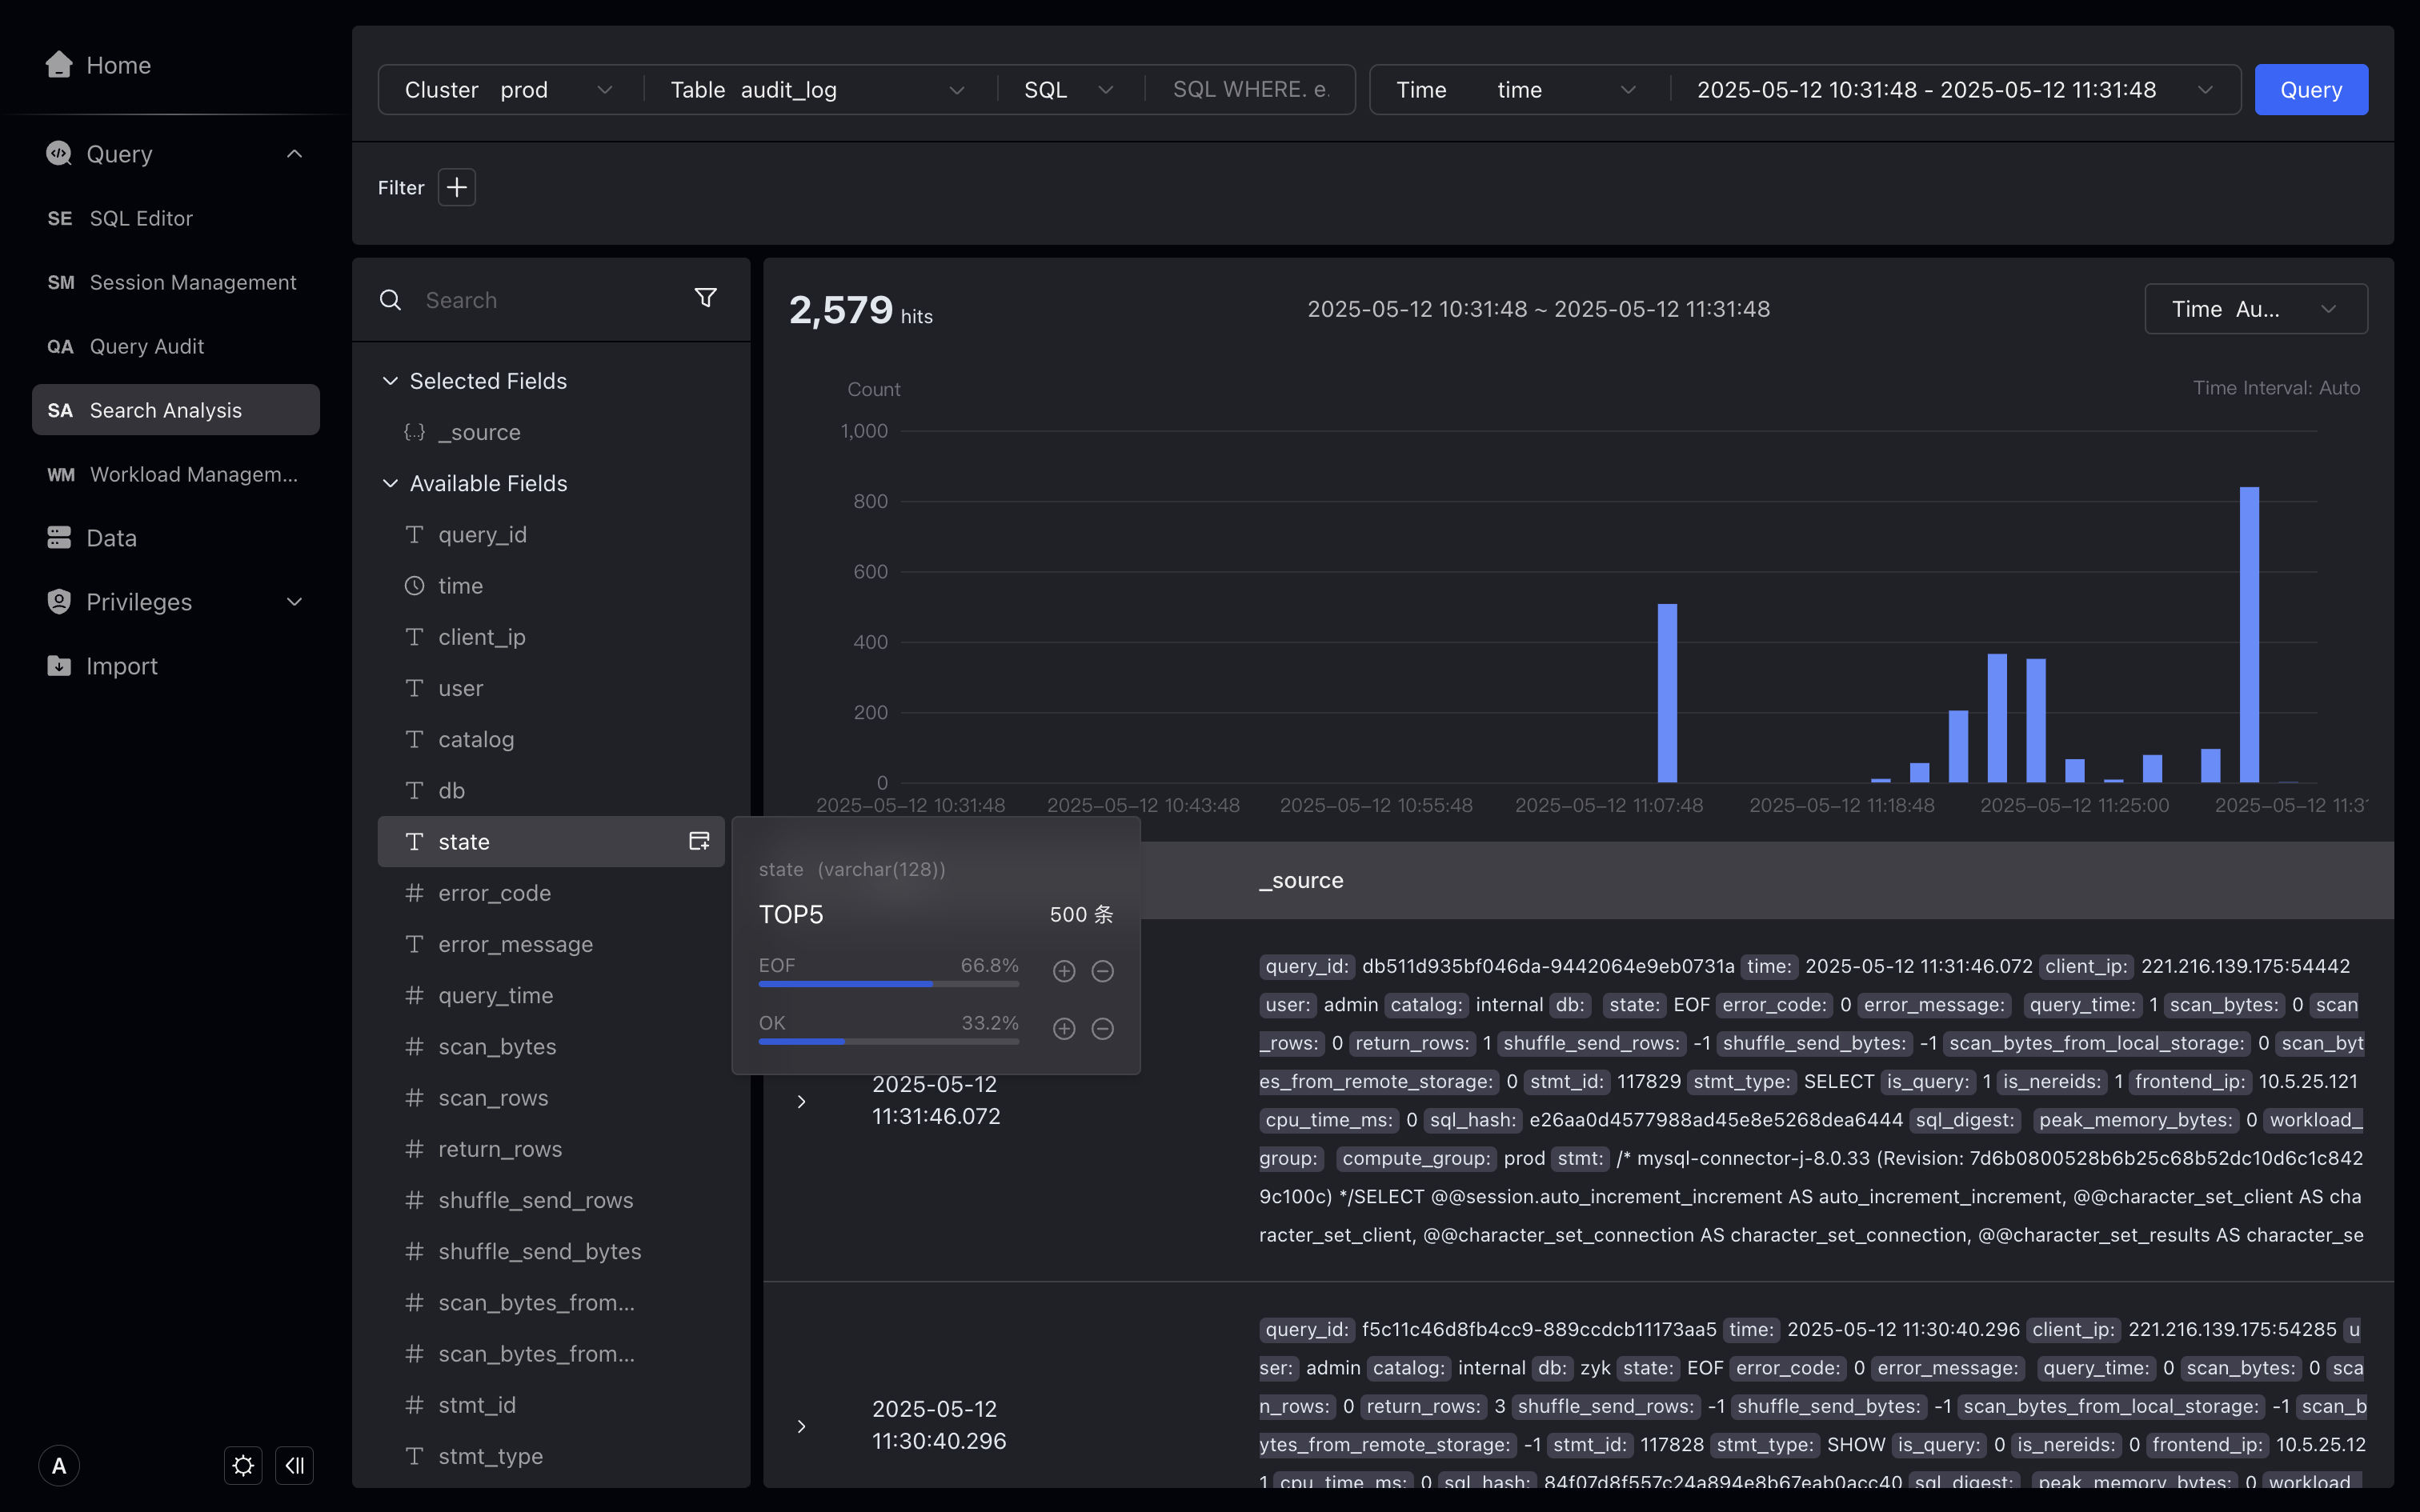
Show field ratio
- Hover over the state field on the left to display the highest frequency state values EOF, OK, ERR, and you can also view the proportion. In addition, you can also create filter conditions by clicking the plus sign (+) or minus sign (—) button, for example, by clicking the minus sign (—) button to the right of ERR, state != ERR is displayed in the filter conditions by clicking the minus sign (—) button to the right of ERR.
The proportion of fields shows the proportion of 500 pieces of data in the query. If the amount of data is large, there may be errors. If you need a full amount of data proportion, you can query it through SQL. We will optimize this feature in subsequent versions.
Filter results by search
- In the main input box, use search and SQL modes to query keywords.
Search mode is supported only on tables with inverted indexes. Reference: https://doris.apache.org/docs/table-design/index/inverted-index
Under the search box, select Search, and then enter GET on the right, click Query. In search mode, search for a log containing the keyword GET. The GET in the details will be highlighted, and the number of data strips in the trend chart will change accordingly.
Searching for the MATCH_ANY statement that matches any keyword can match any field in the log.
Note that the highlighting of the search results will match all search keywords as much as possible, but due to some special characters, it does not always match the search keywords exactly.
You can use double quotes to wrap phrases in searches, such as "GET /api/v1/user". Will match the entire phrase. The phrase uses MATCH_PHRASE to match the phrase.
If more precise matches are required, you can use SQL pattern.
If you have any questions about the search principle or about MATCH_ANY and MATCH_PHRASE, please refer to the document [Inverted Index] (https://doris.apache.org/docs/3.x/table-design/index/inverted-index#usage-scenarios).
Filter results through SQL
Under the search box, select SQL, and in SQL mode, enter the SQL WHERE condition and click Query.
View filter results details
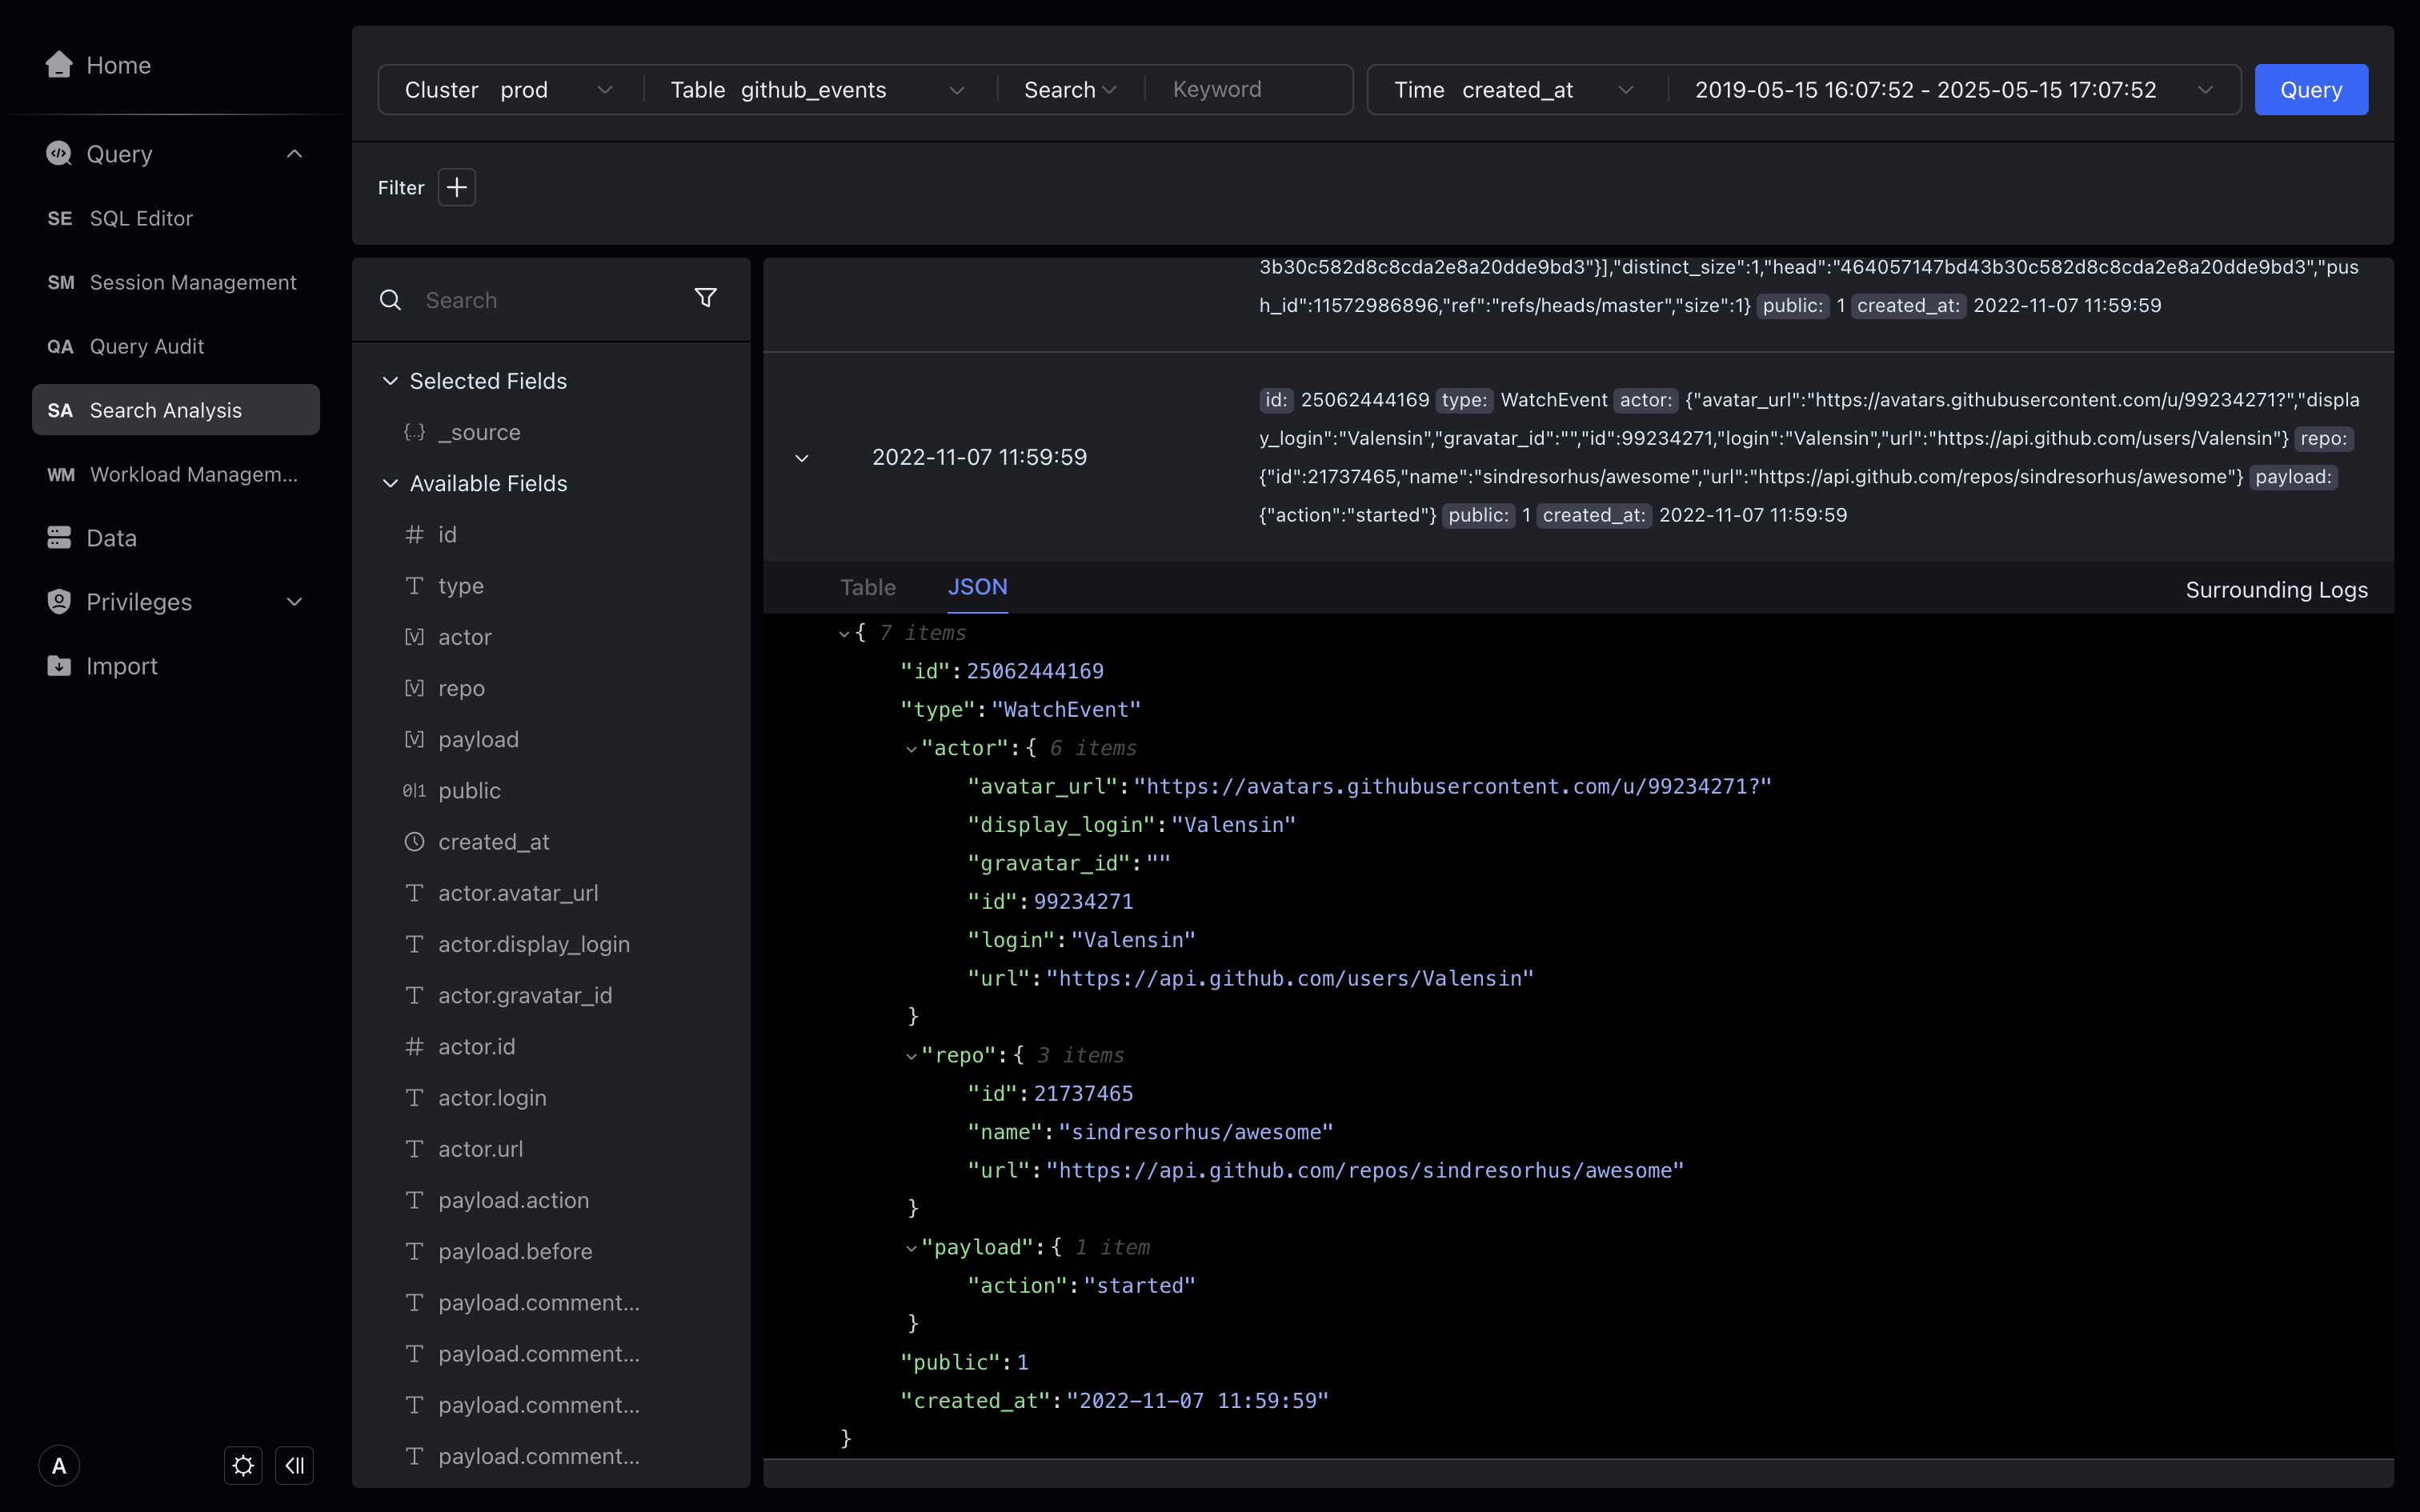
Expand log details, optionally in Table or JSON format, the Table format supports interactive creation of filters.
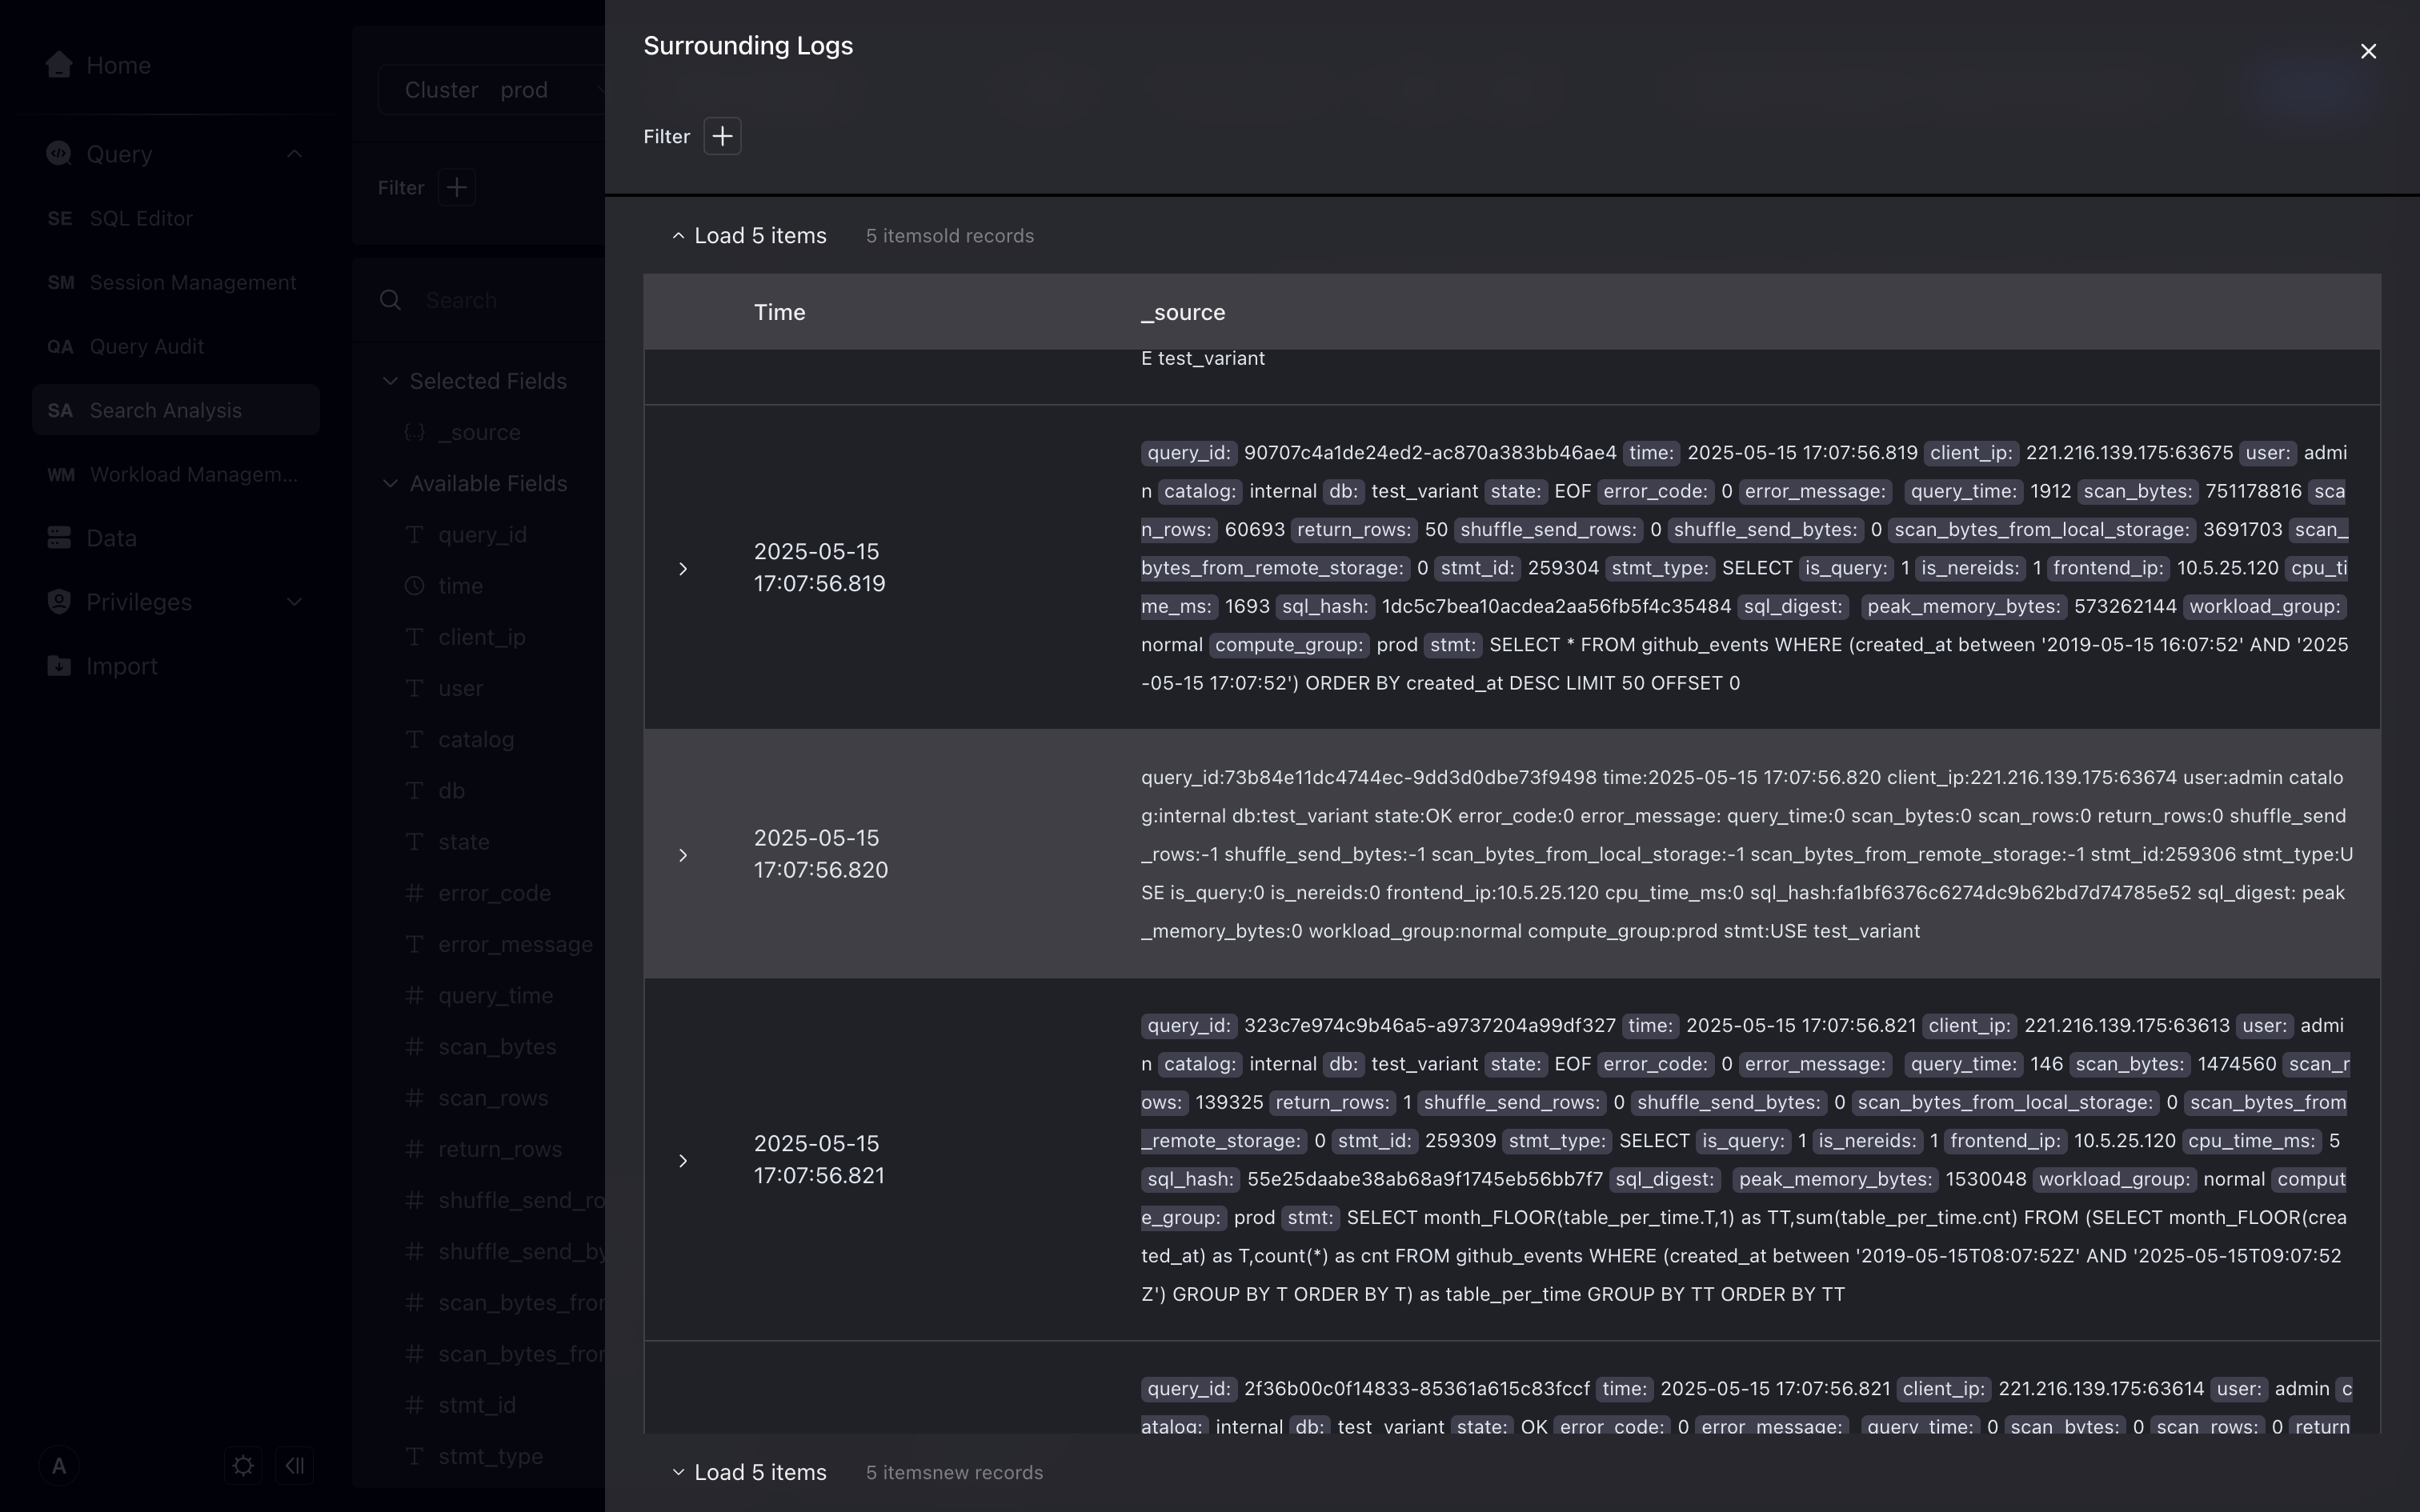
View the context and search further
Click the context search on the right to view the 10 logs before and after this log. You can continue to add filter conditions in the context search.
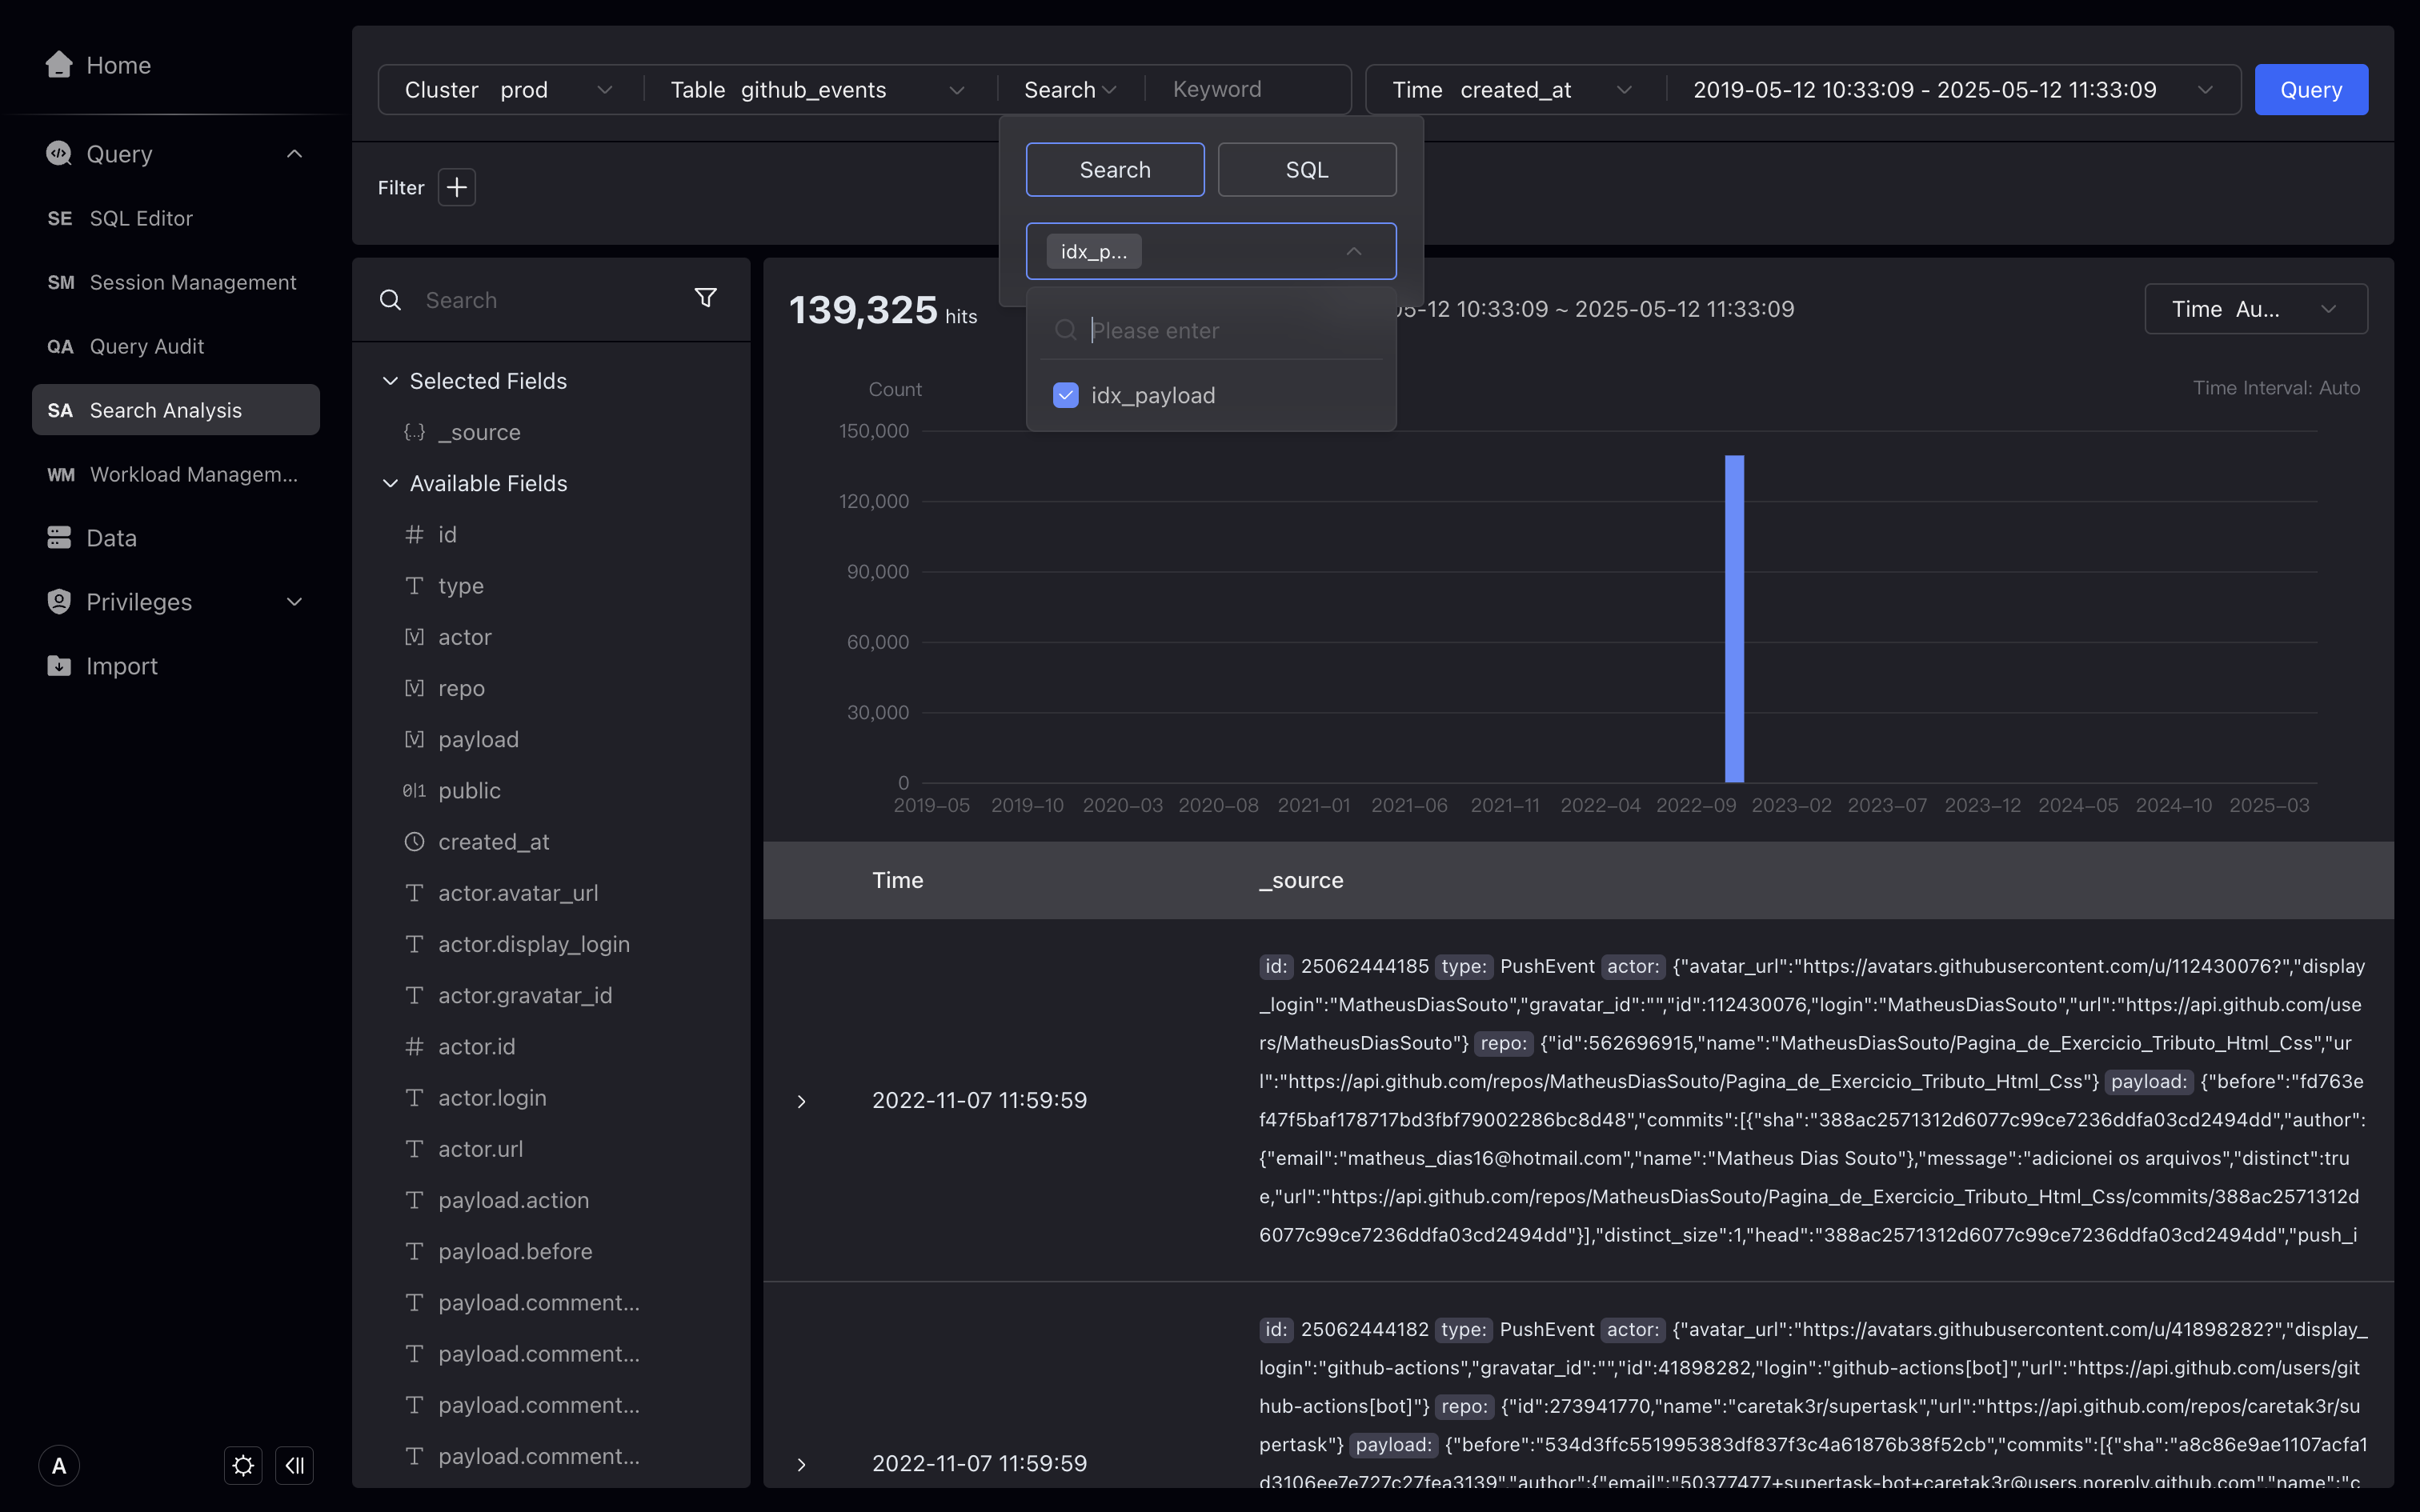
Filter VARIANT data type
Introduced a new data type VARIANT in Doris 2.1, it can store semi-structured JSON data. The VARIANT type is especially suitable for handling complex nested structures that may change at any time.
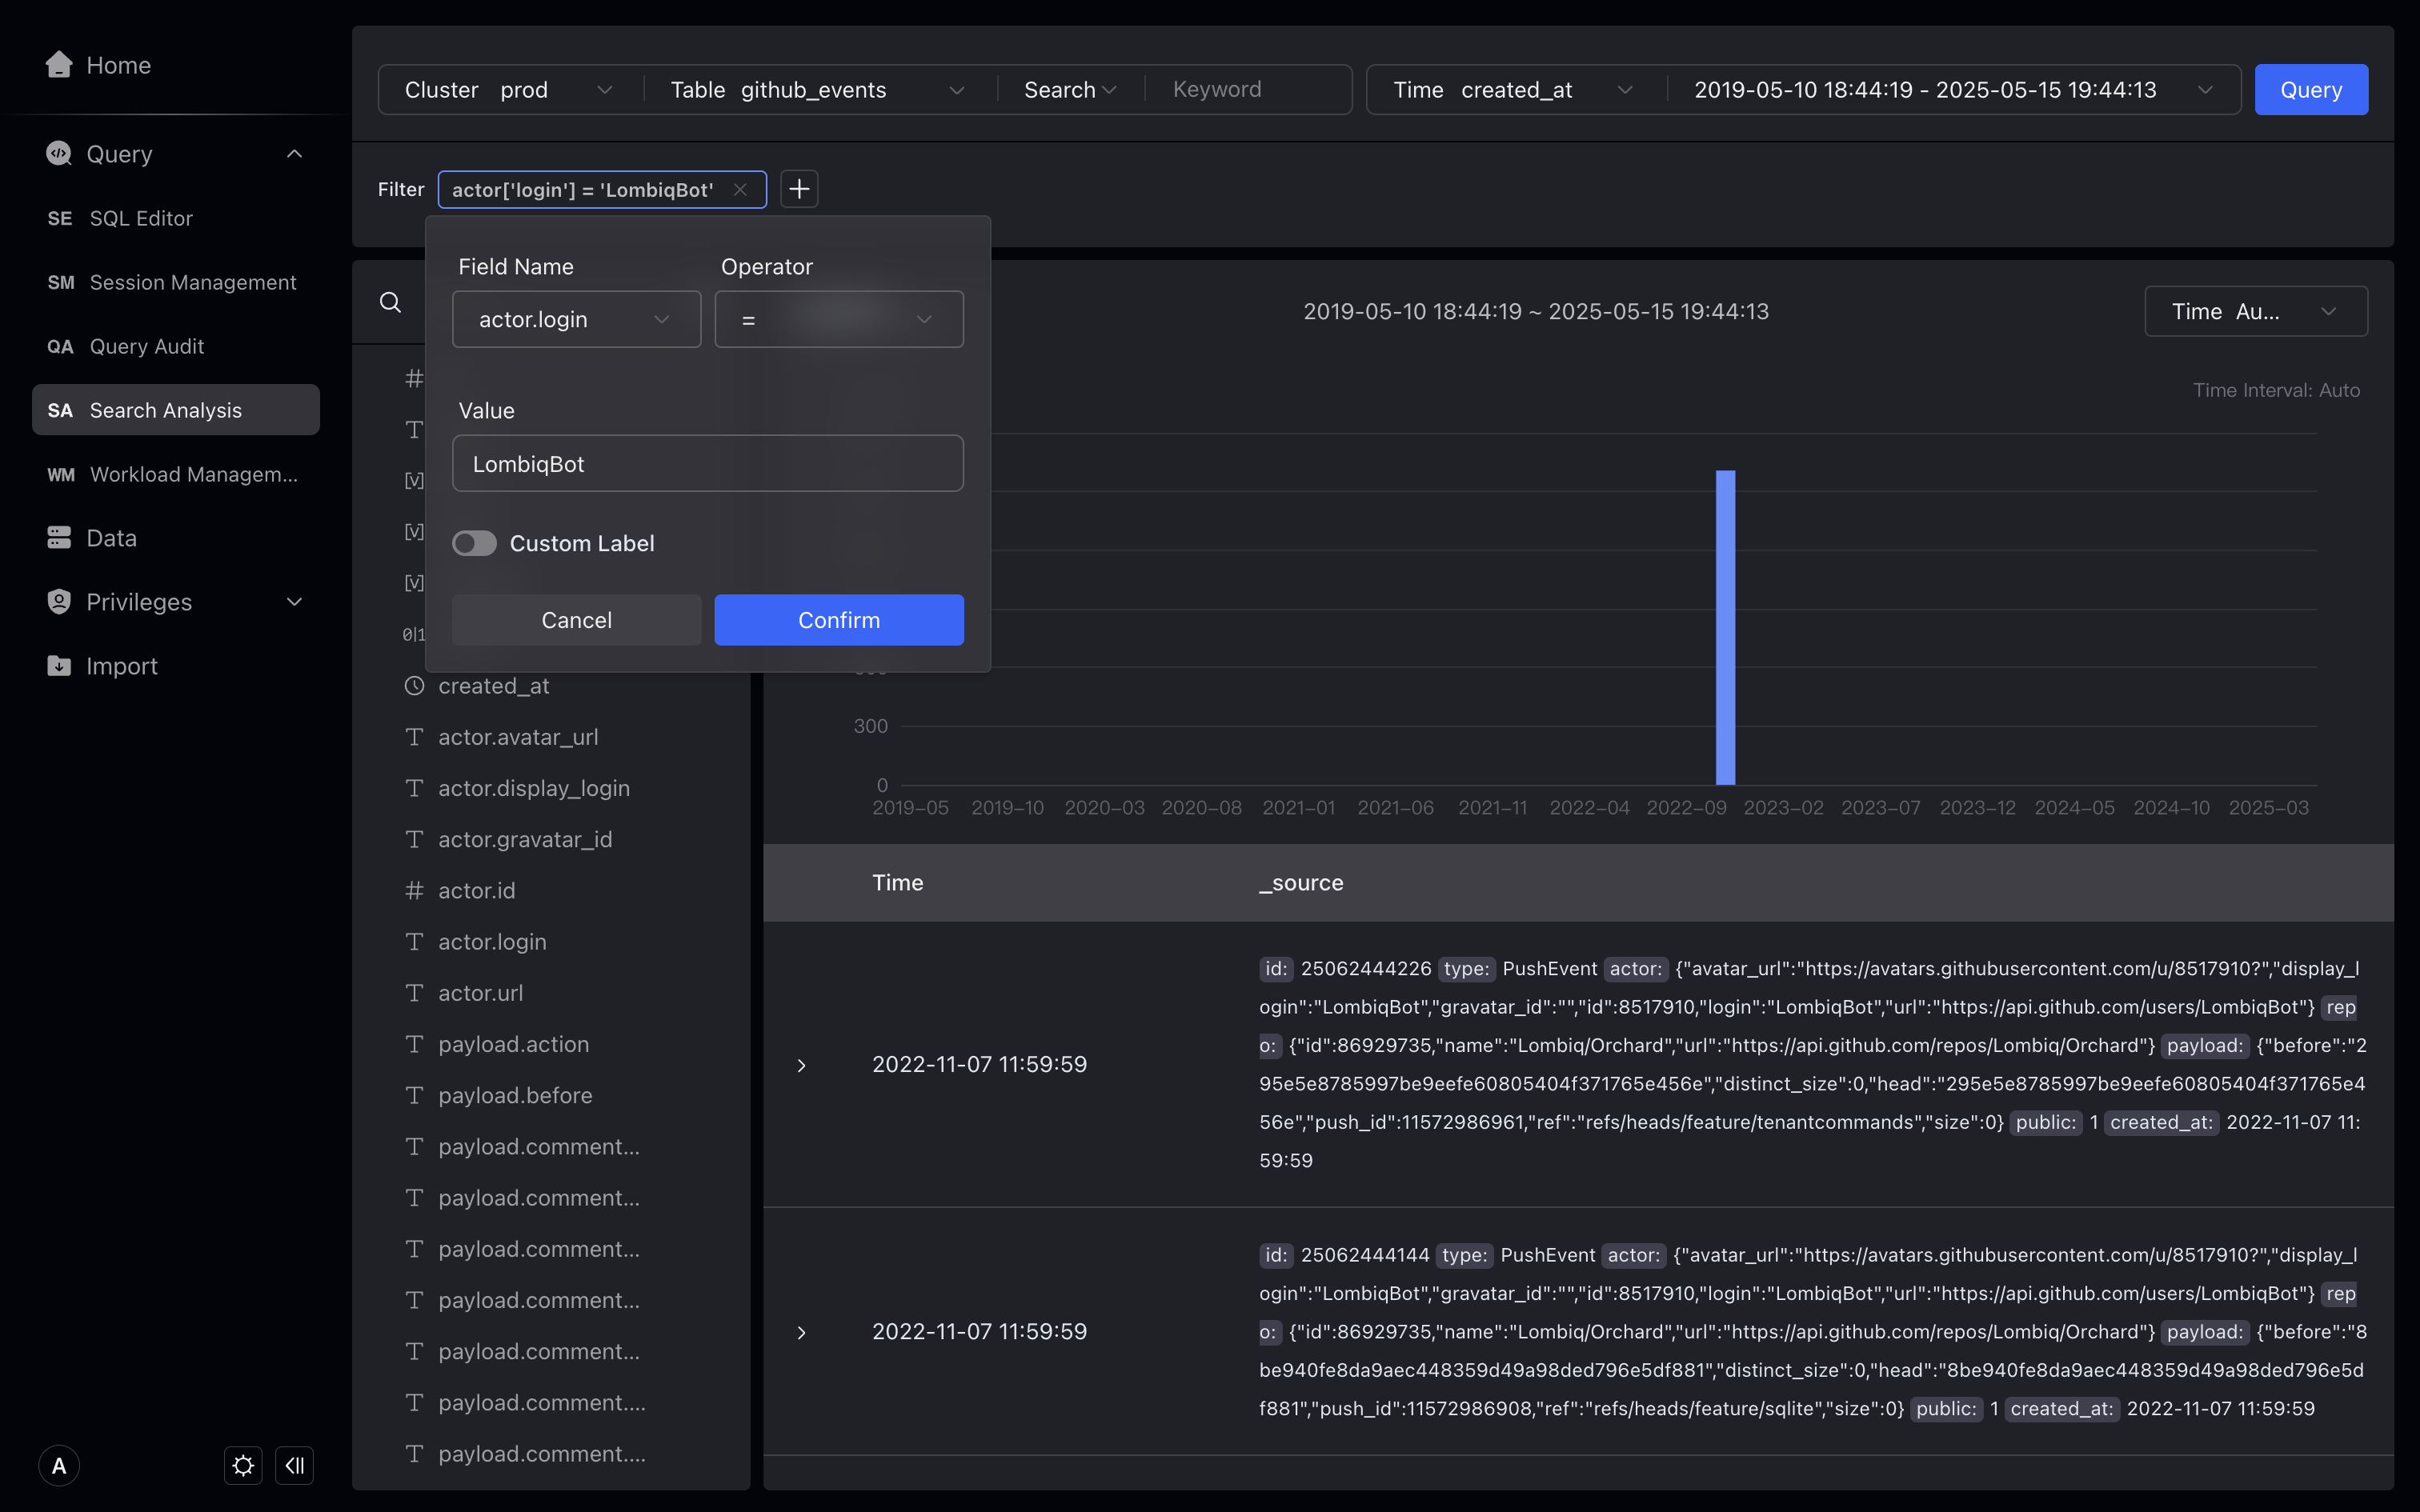
Studio will recognize the VARIANT data type, automatically expand the hierarchy of that data type, and provide a special filtering method.
Let's take the github_events table as an example to show how to filter fields of VARIANT data type.
In the filtering condition, we can select the field of the VARIANT data type and select the subfields in it for filtering.
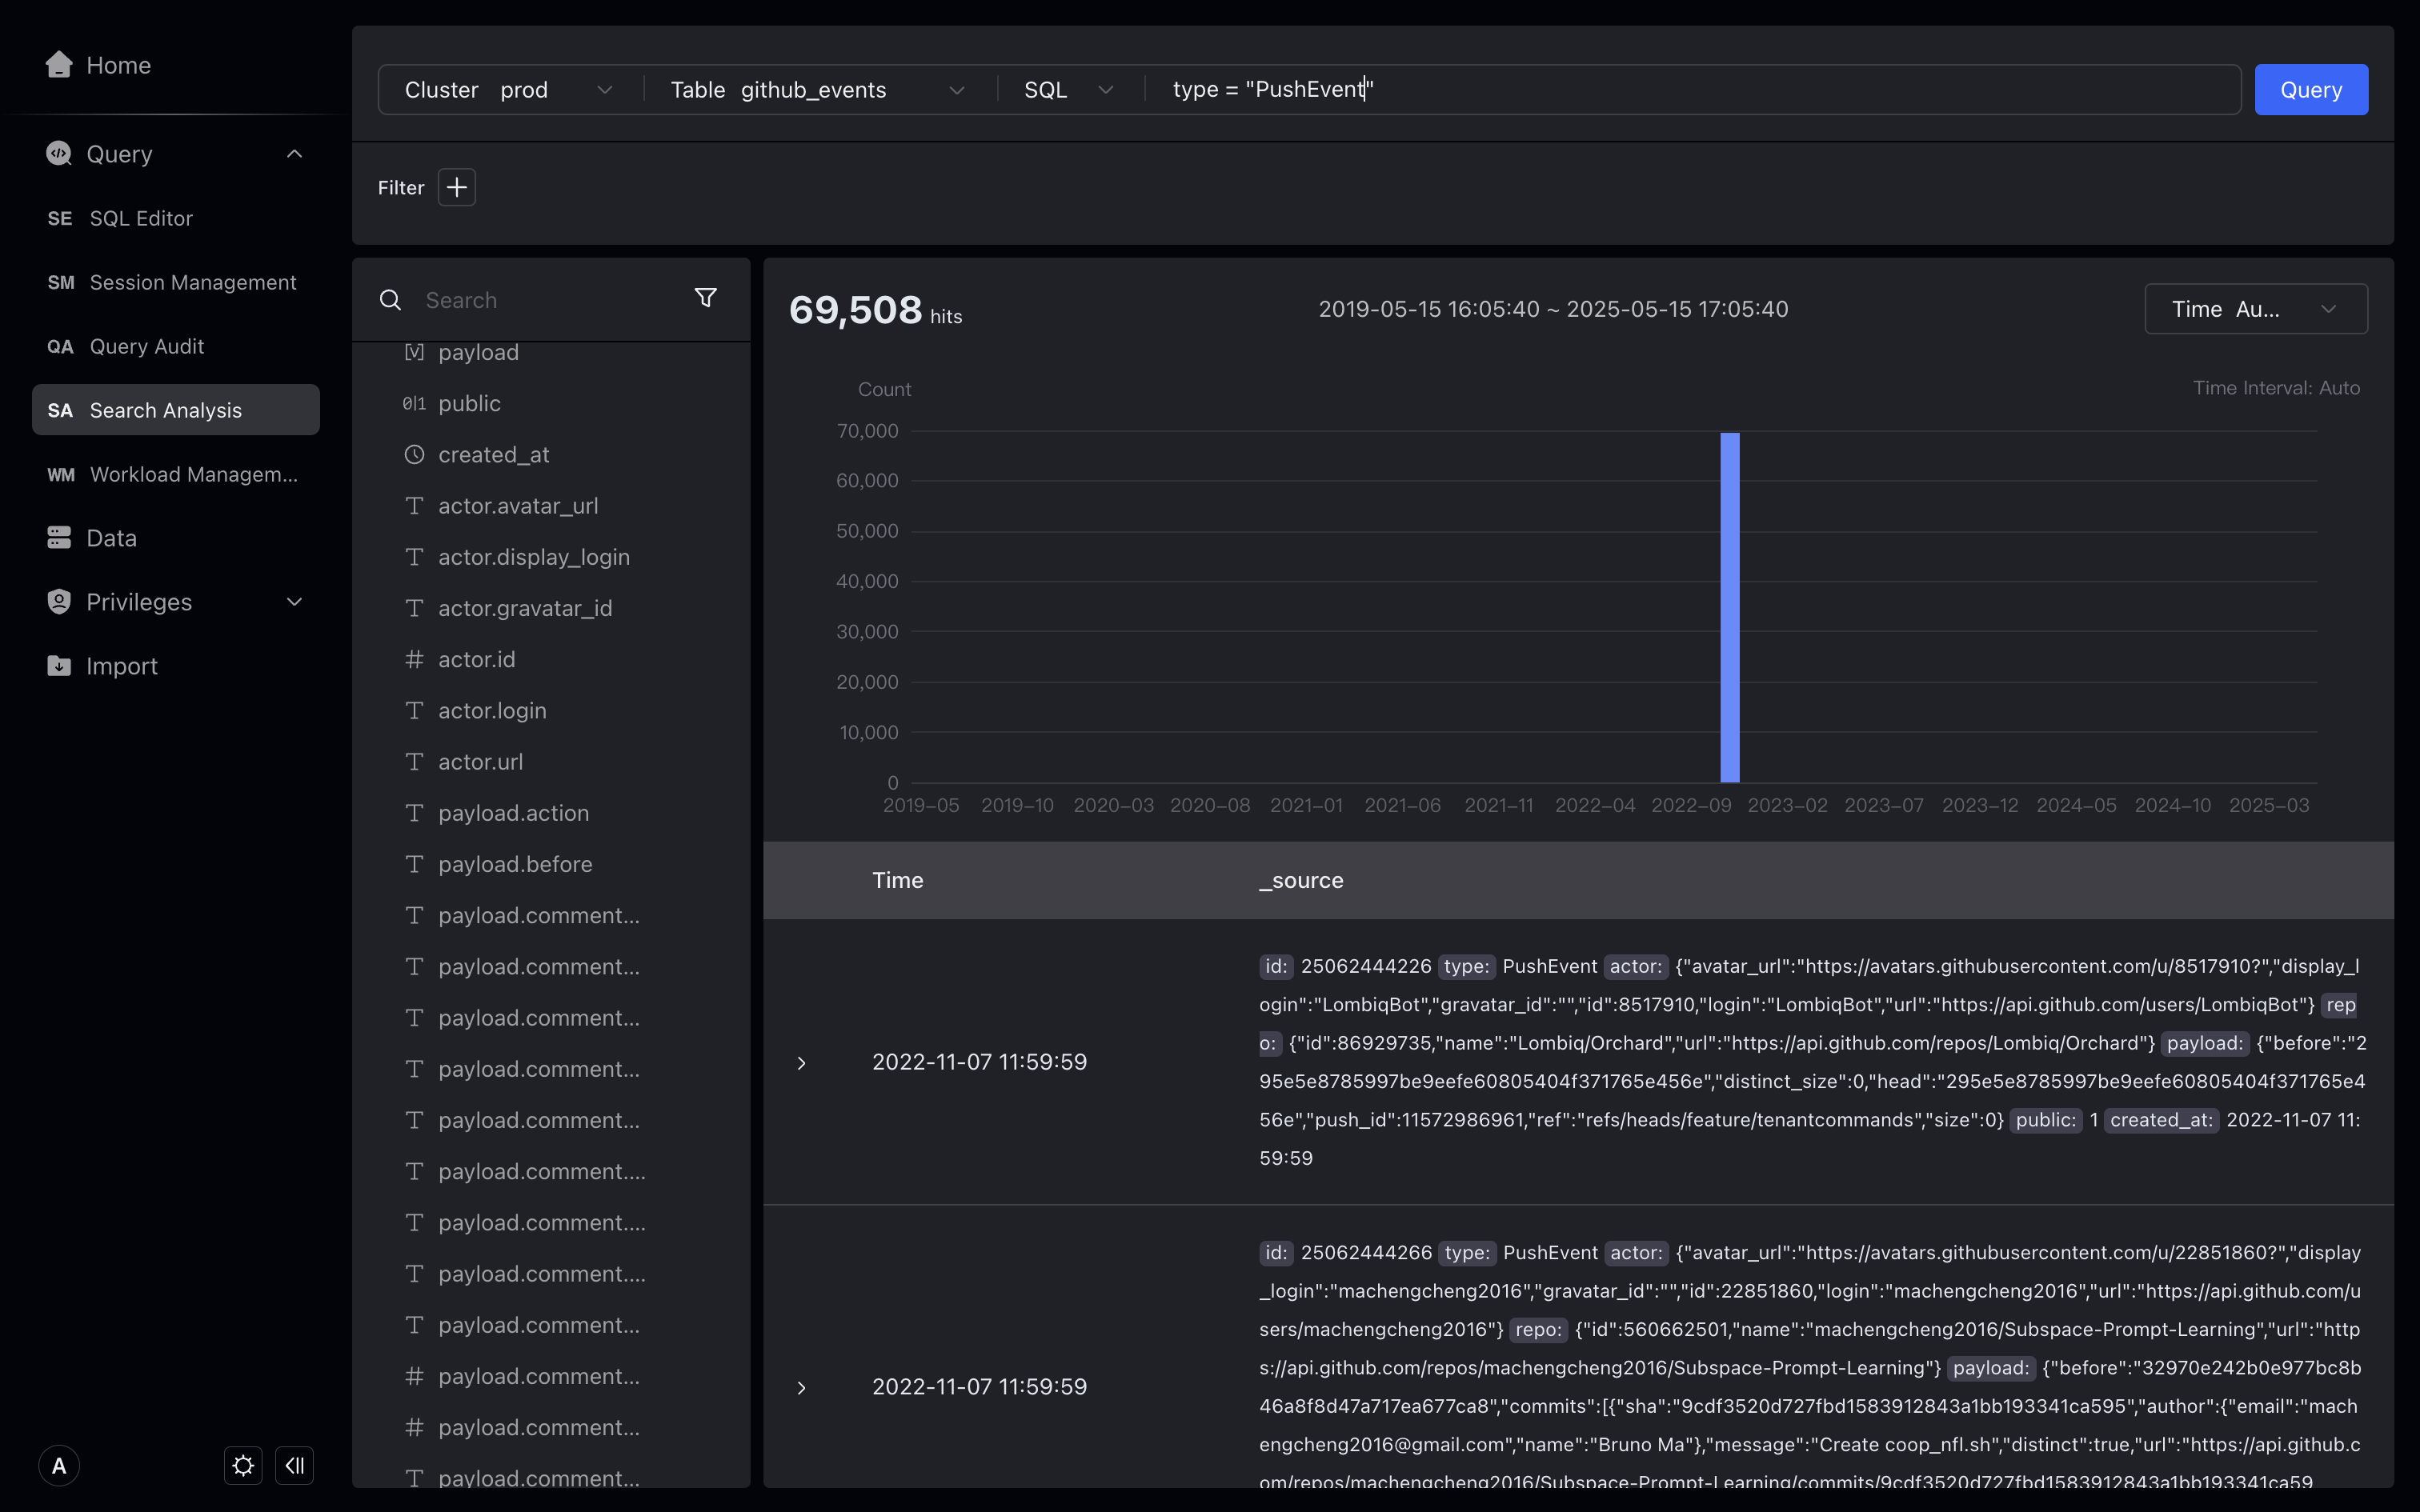
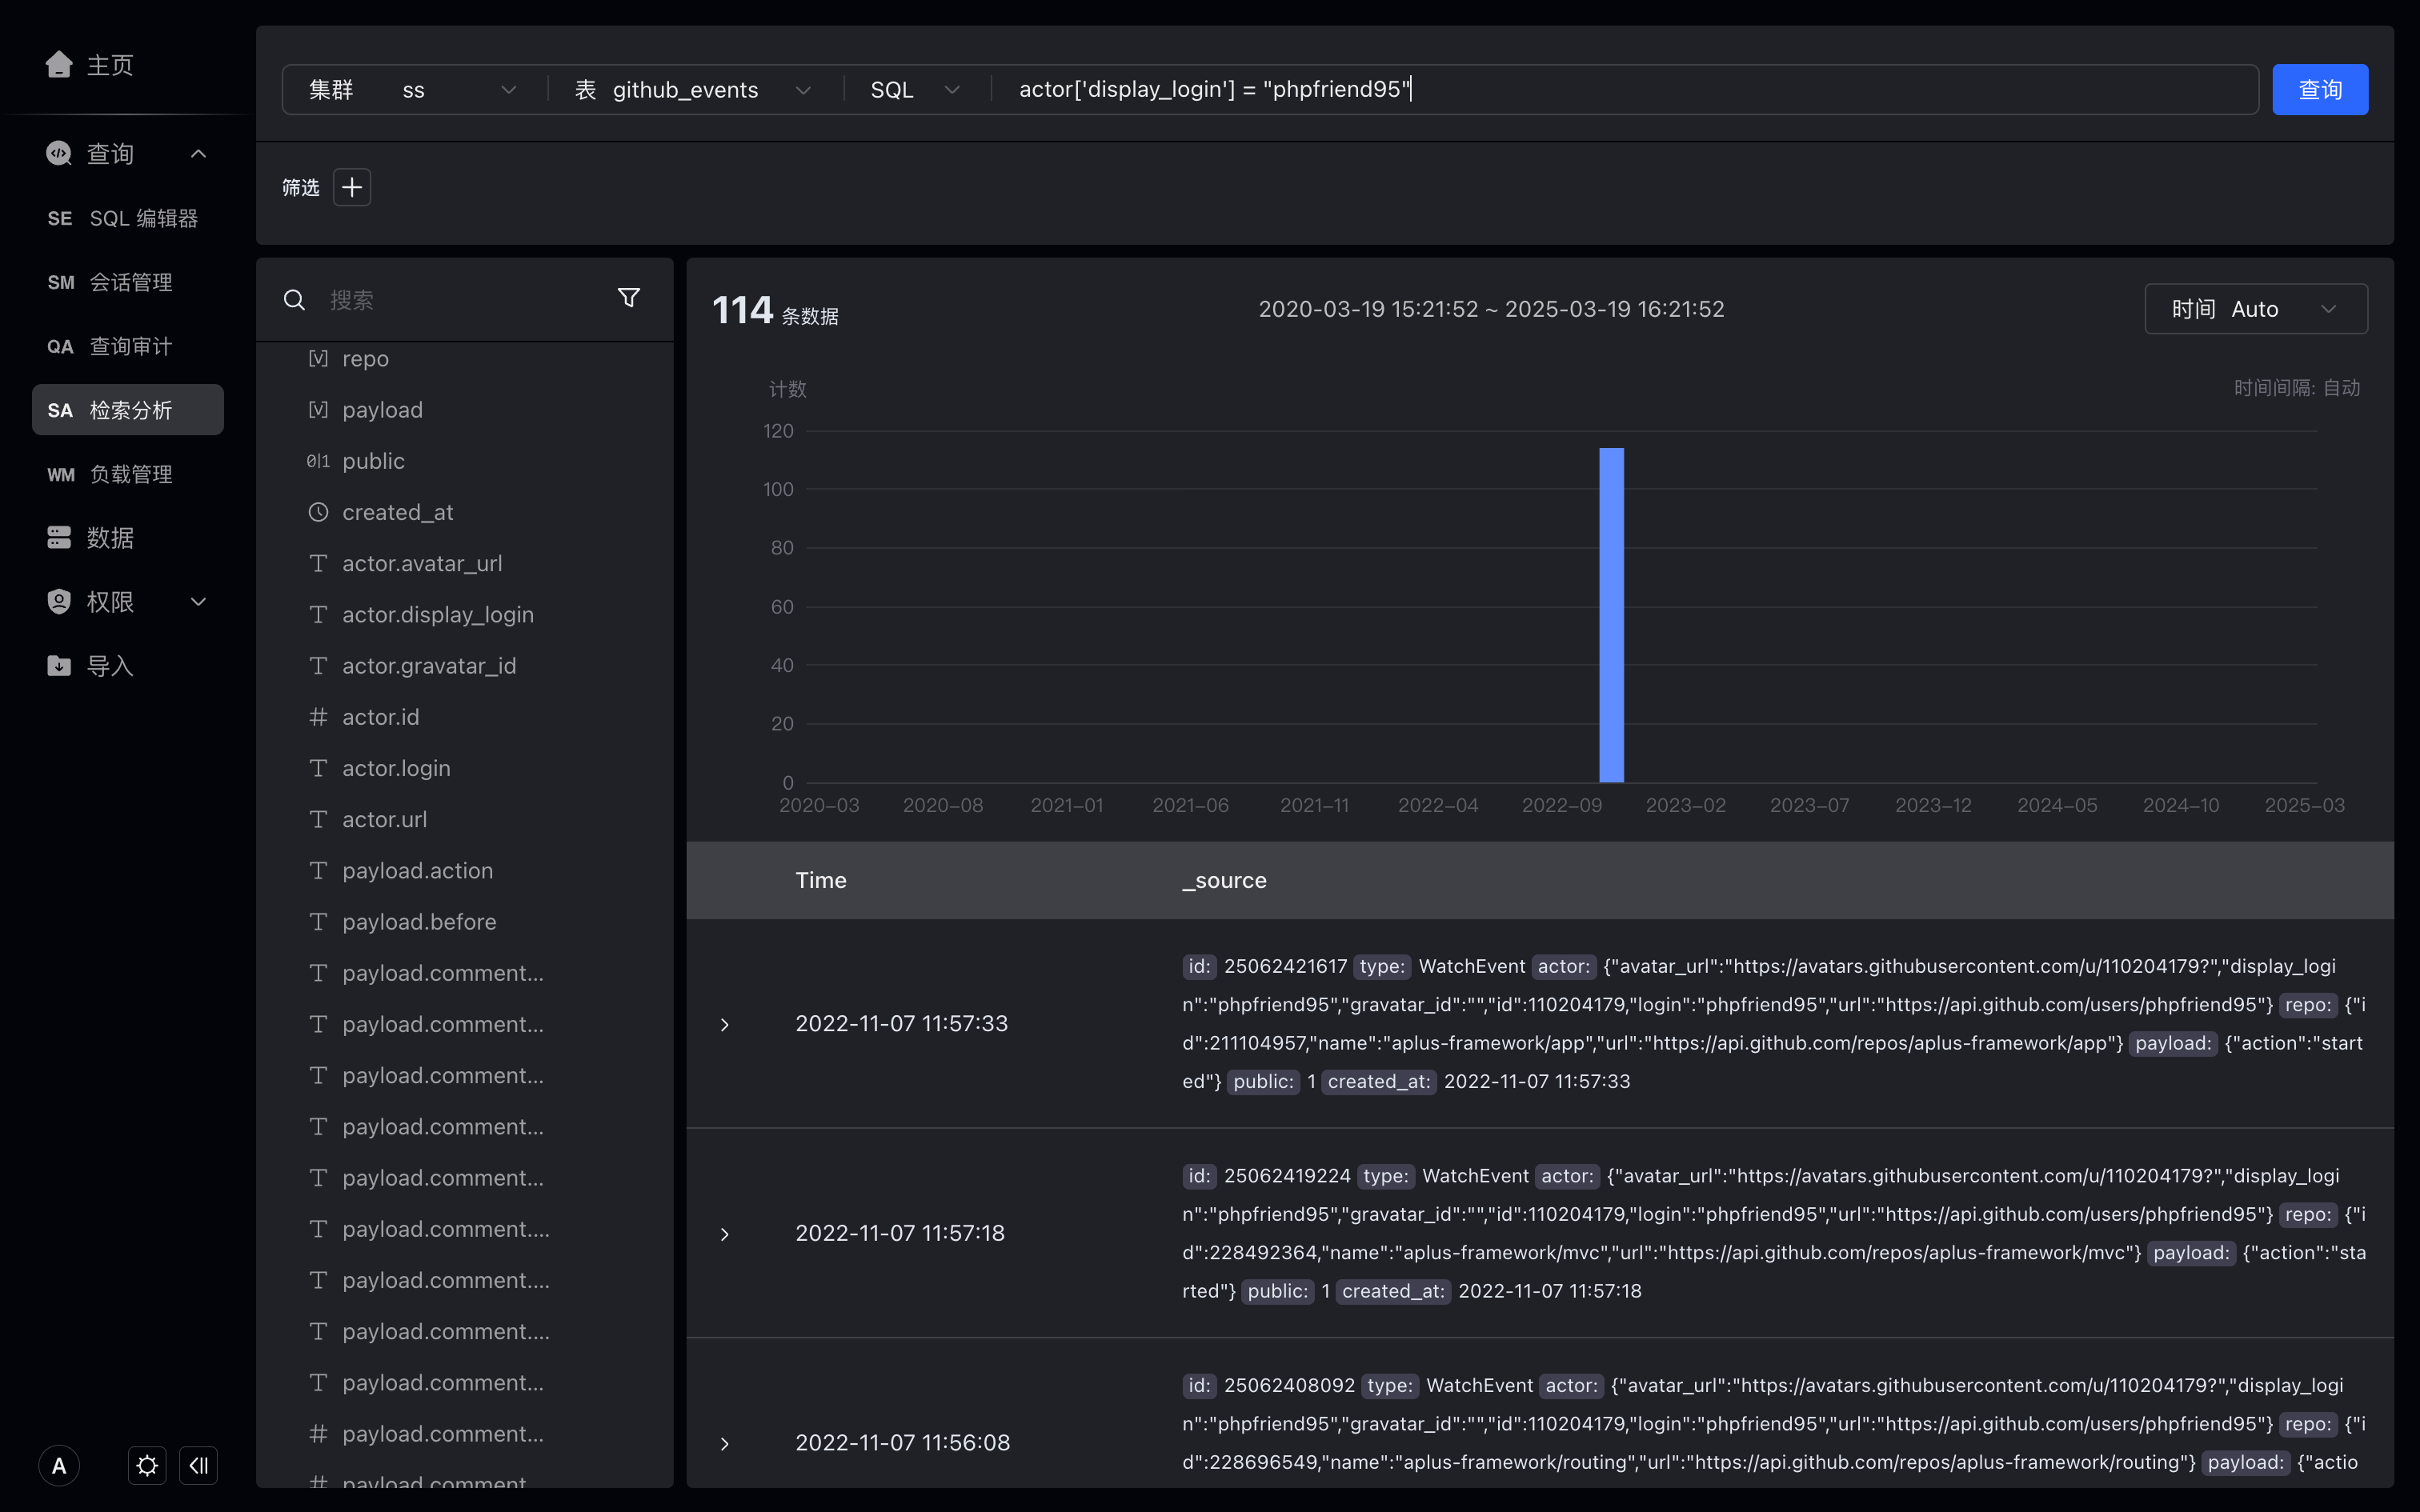
In SQL mode, we can use [] to access fields of the VARIANT data type.
FAQ
Why can't I see the data?
-
Please check whether the cluster, table, and time fields are selected correctly.
-
Please check whether the time period is selected correctly.
-
Please check whether there are filter criteria.
How should I create an inverted index for my table?
You can set the inverted index when creating a table, or you can create the inverted index on existing tables.
Please refer to the document [Management Index] (https://doris.apache.org/docs/3.0/table-design/index/inverted-index).
What are the tutorials for storing data using the Variant type?
Please refer to the document Variant Type.
The logs in the context index are not accurate enough, some logs cannot be found?
Using the higher precision DateTime field can improve the accuracy of context indexes. For example `DateTime(3)