SQL Console
The SQL console is a powerful SQL editor that supports smart prompts, syntax highlighting, query history, query result cache and other functions developed specifically for Apache Doris, allowing you to easily write SQL statements and view query results.
Feature Panel
Data Directory
You can see information such as database, table, view, etc. When the mouse moves to objects such as libraries, tables, view, etc., the corresponding operation buttons will be displayed. You can click these buttons to perform corresponding operations. Detailed information of the object will also be displayed, such as the table creation time, number of rows, comments, etc.
You can add commonly used tables, views and other objects to the top for easy and quick viewing.
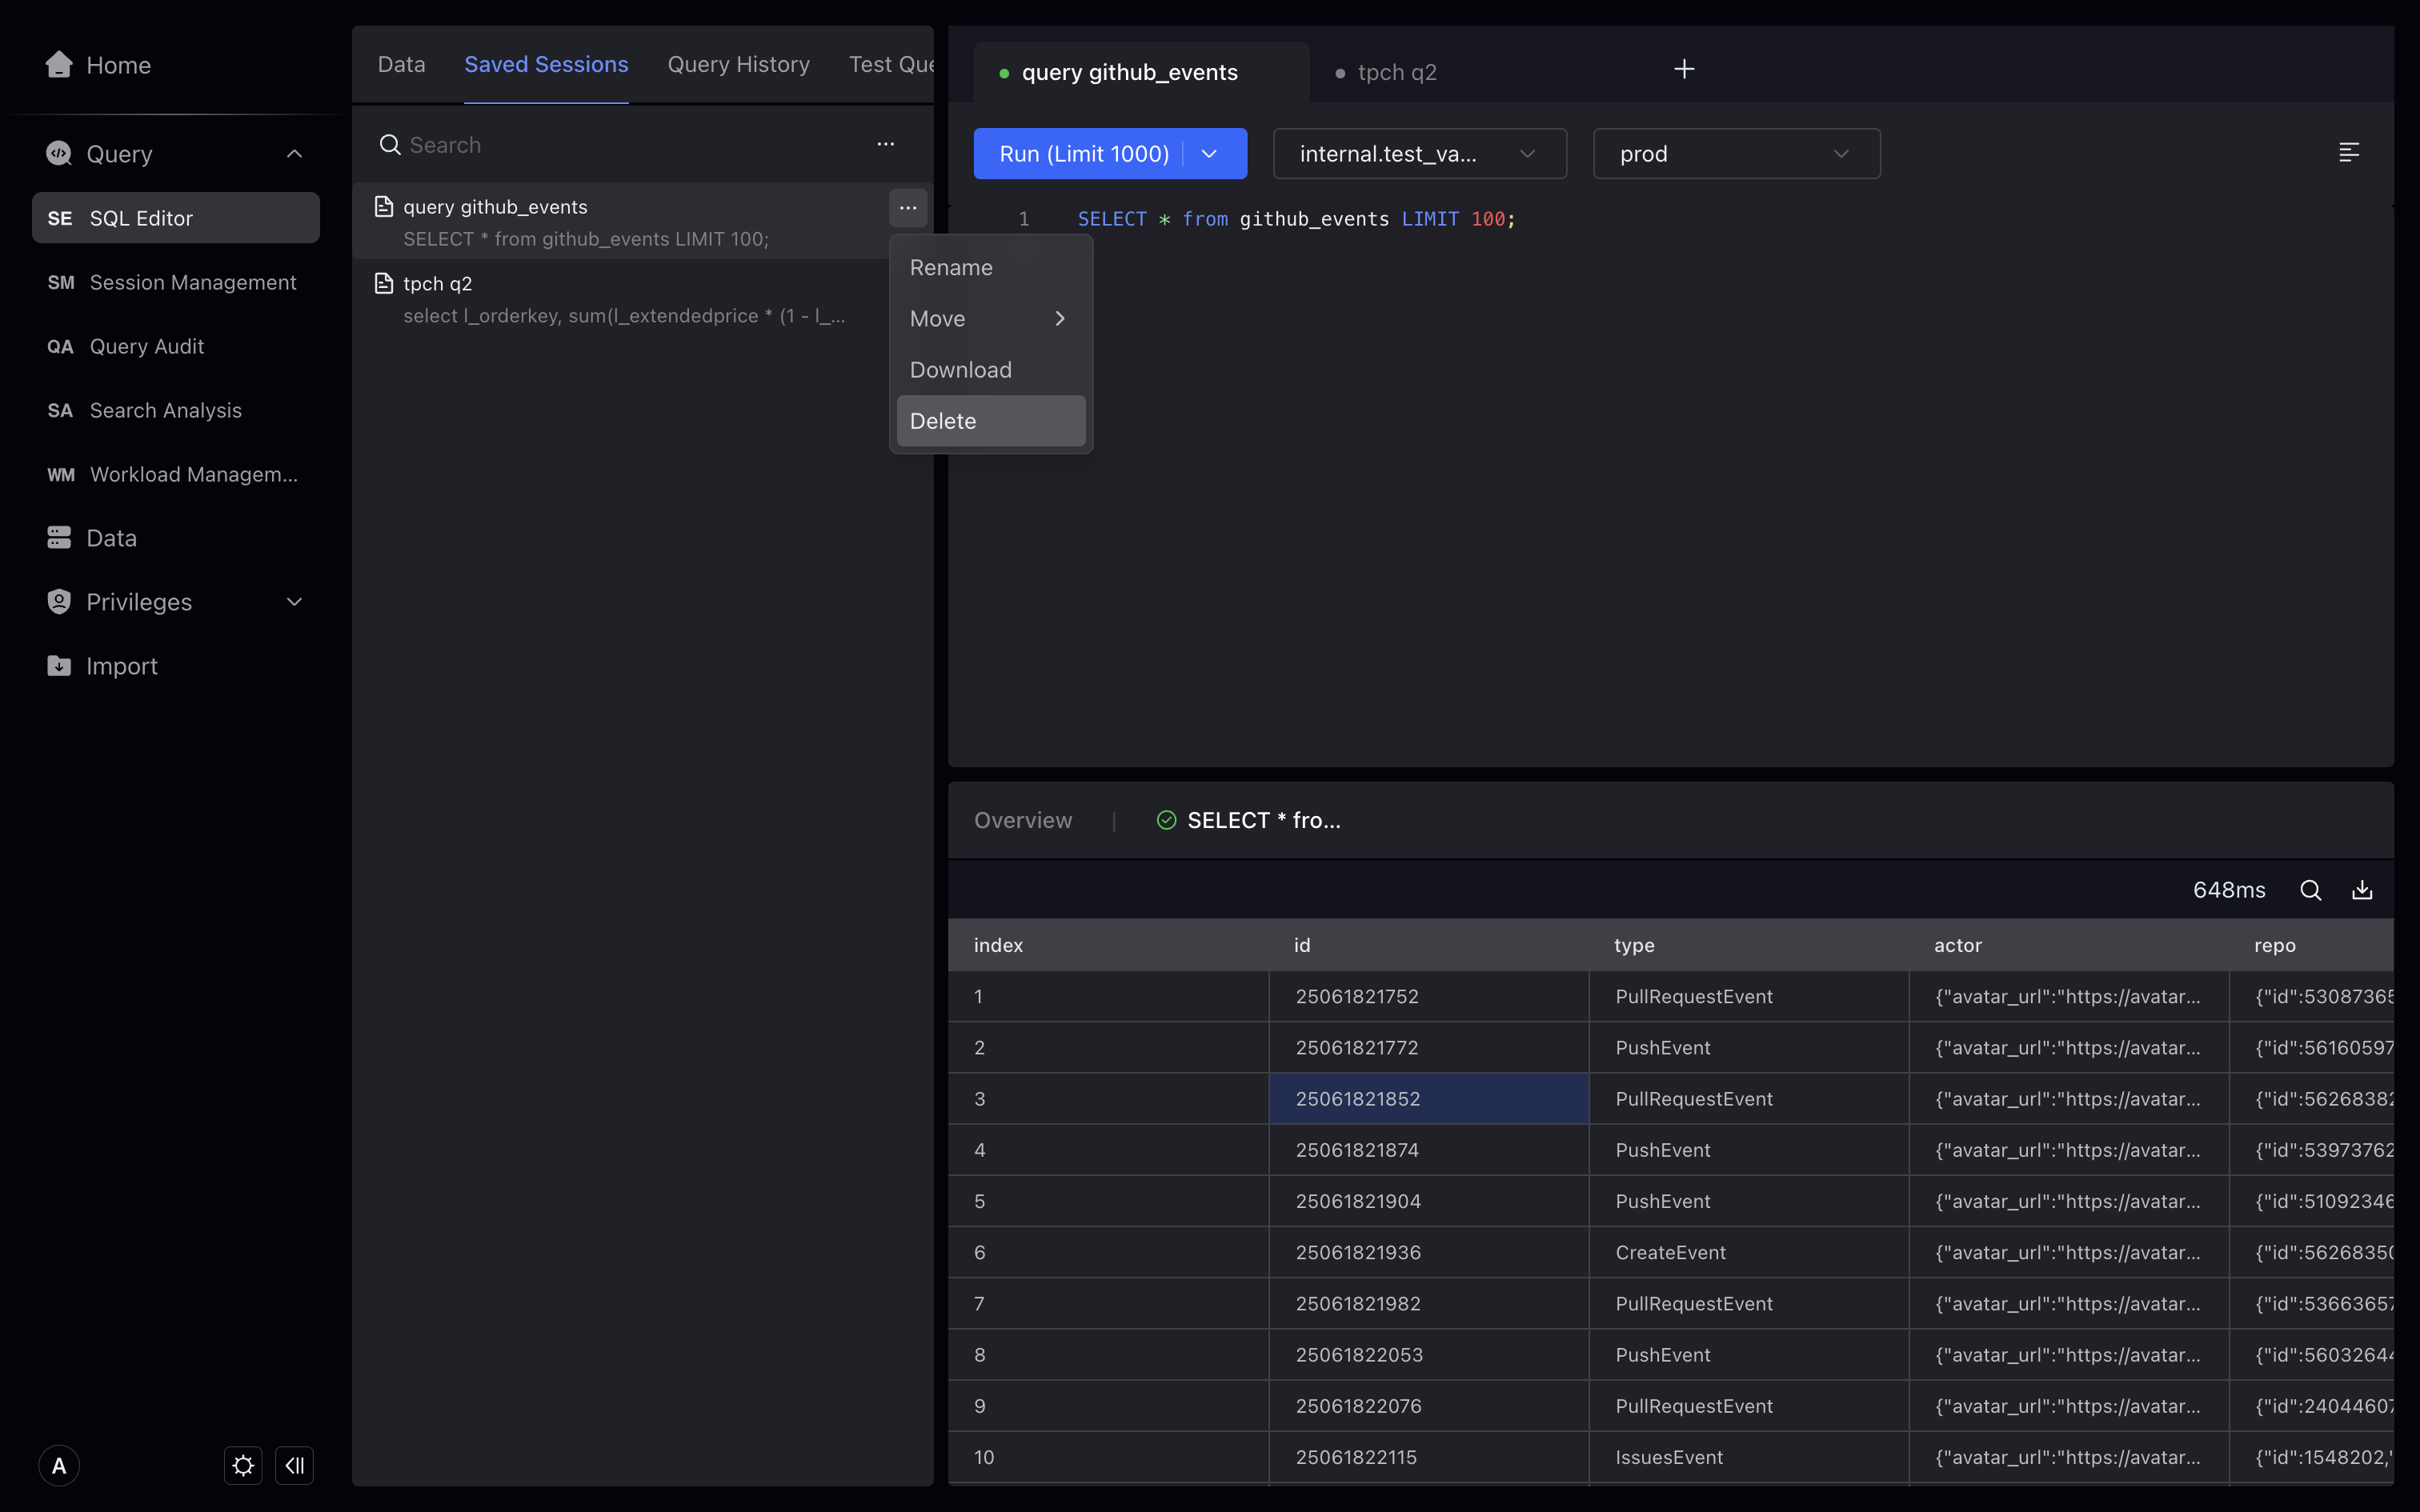
Session Recording
Session records are the history of the Tab you open in the SQL Editor. You can click on the SQL statement in the record and copy it to the SQL Editor for execution.
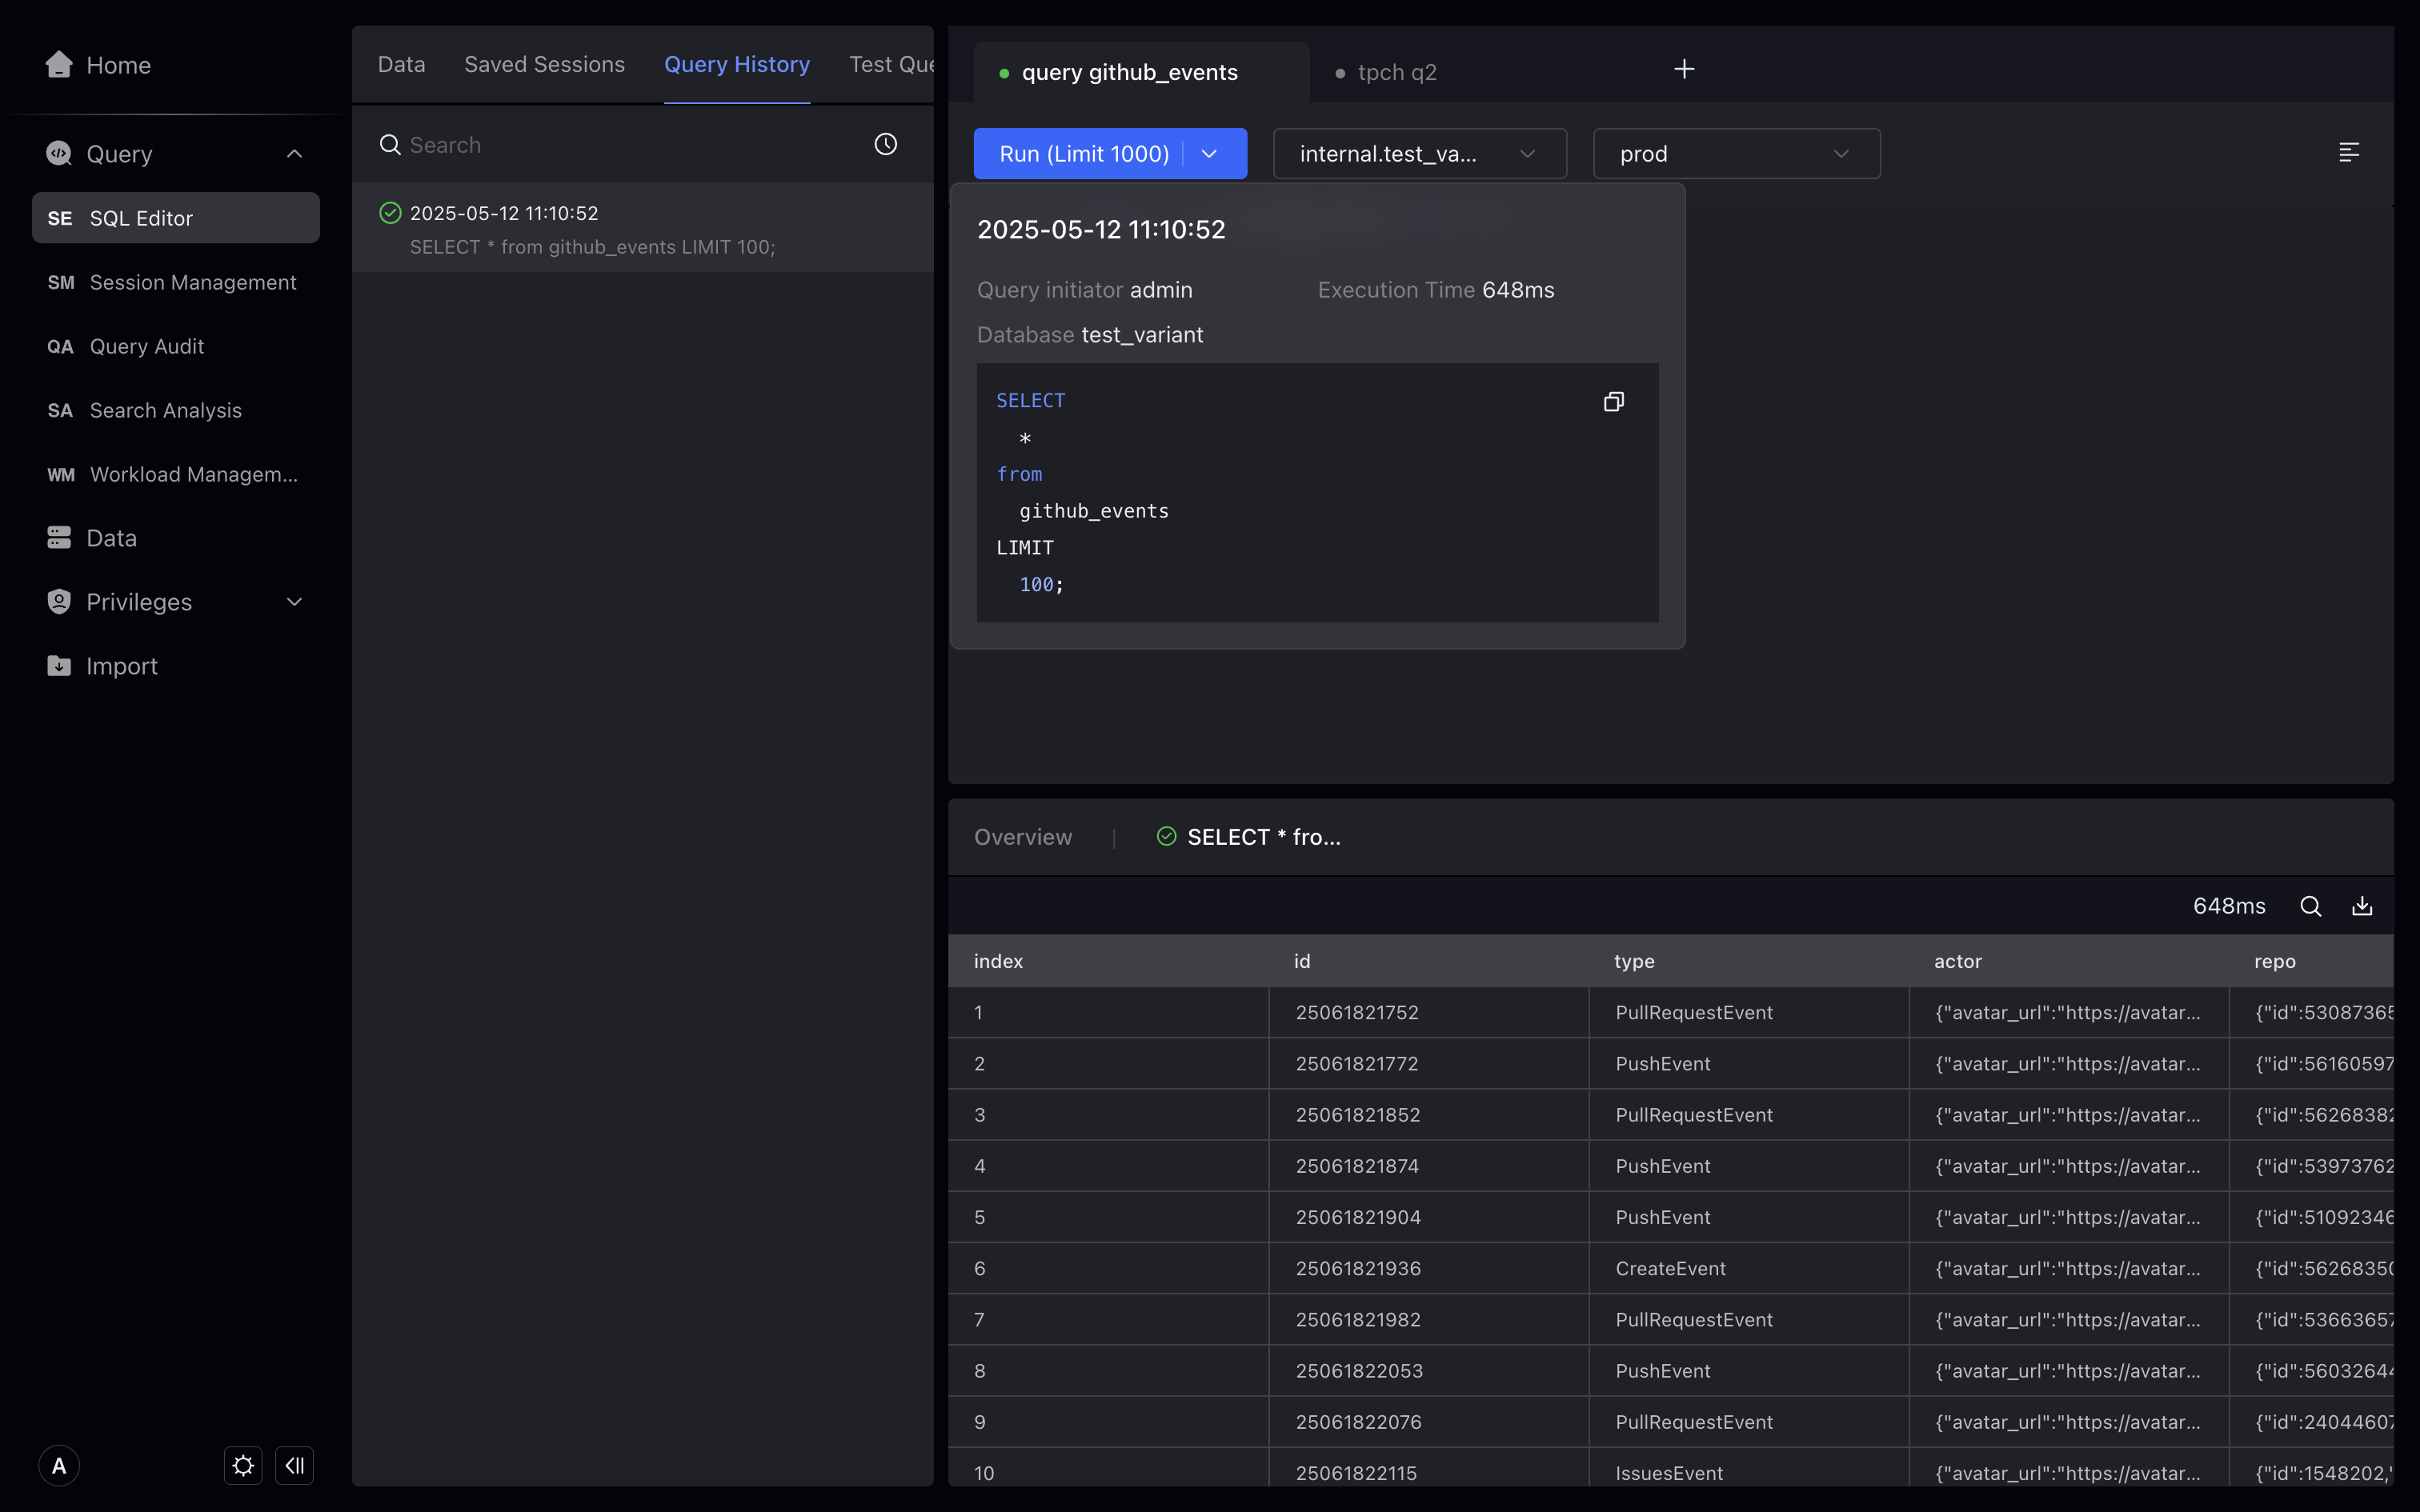
Query History
Query history is the history of the SQL statement you execute in the SQL editor. You can click on the SQL statement in the record to view the Profile information of the statement.
Non-query statements do not have a Profile, and no Profile is required for a statement that fails to query.
Query Profile
Profile visualization is supported in Apache Doris 2.1 /VeloDB 4.0.0 or above.
Queries initiated in Studio are enabled by default with query profiles, which may have a slight impact on the performance of a single query. Click "Query Statement" to enter the execution plan page.
The download button can download Profile information, including Profile information in pure TEXT format and visual Profile images.
The Import Profile button can import Profile information in the TEXT format, and after importing, you can visually view the Profile. This helps you visually analyze queries initiated from other clients.
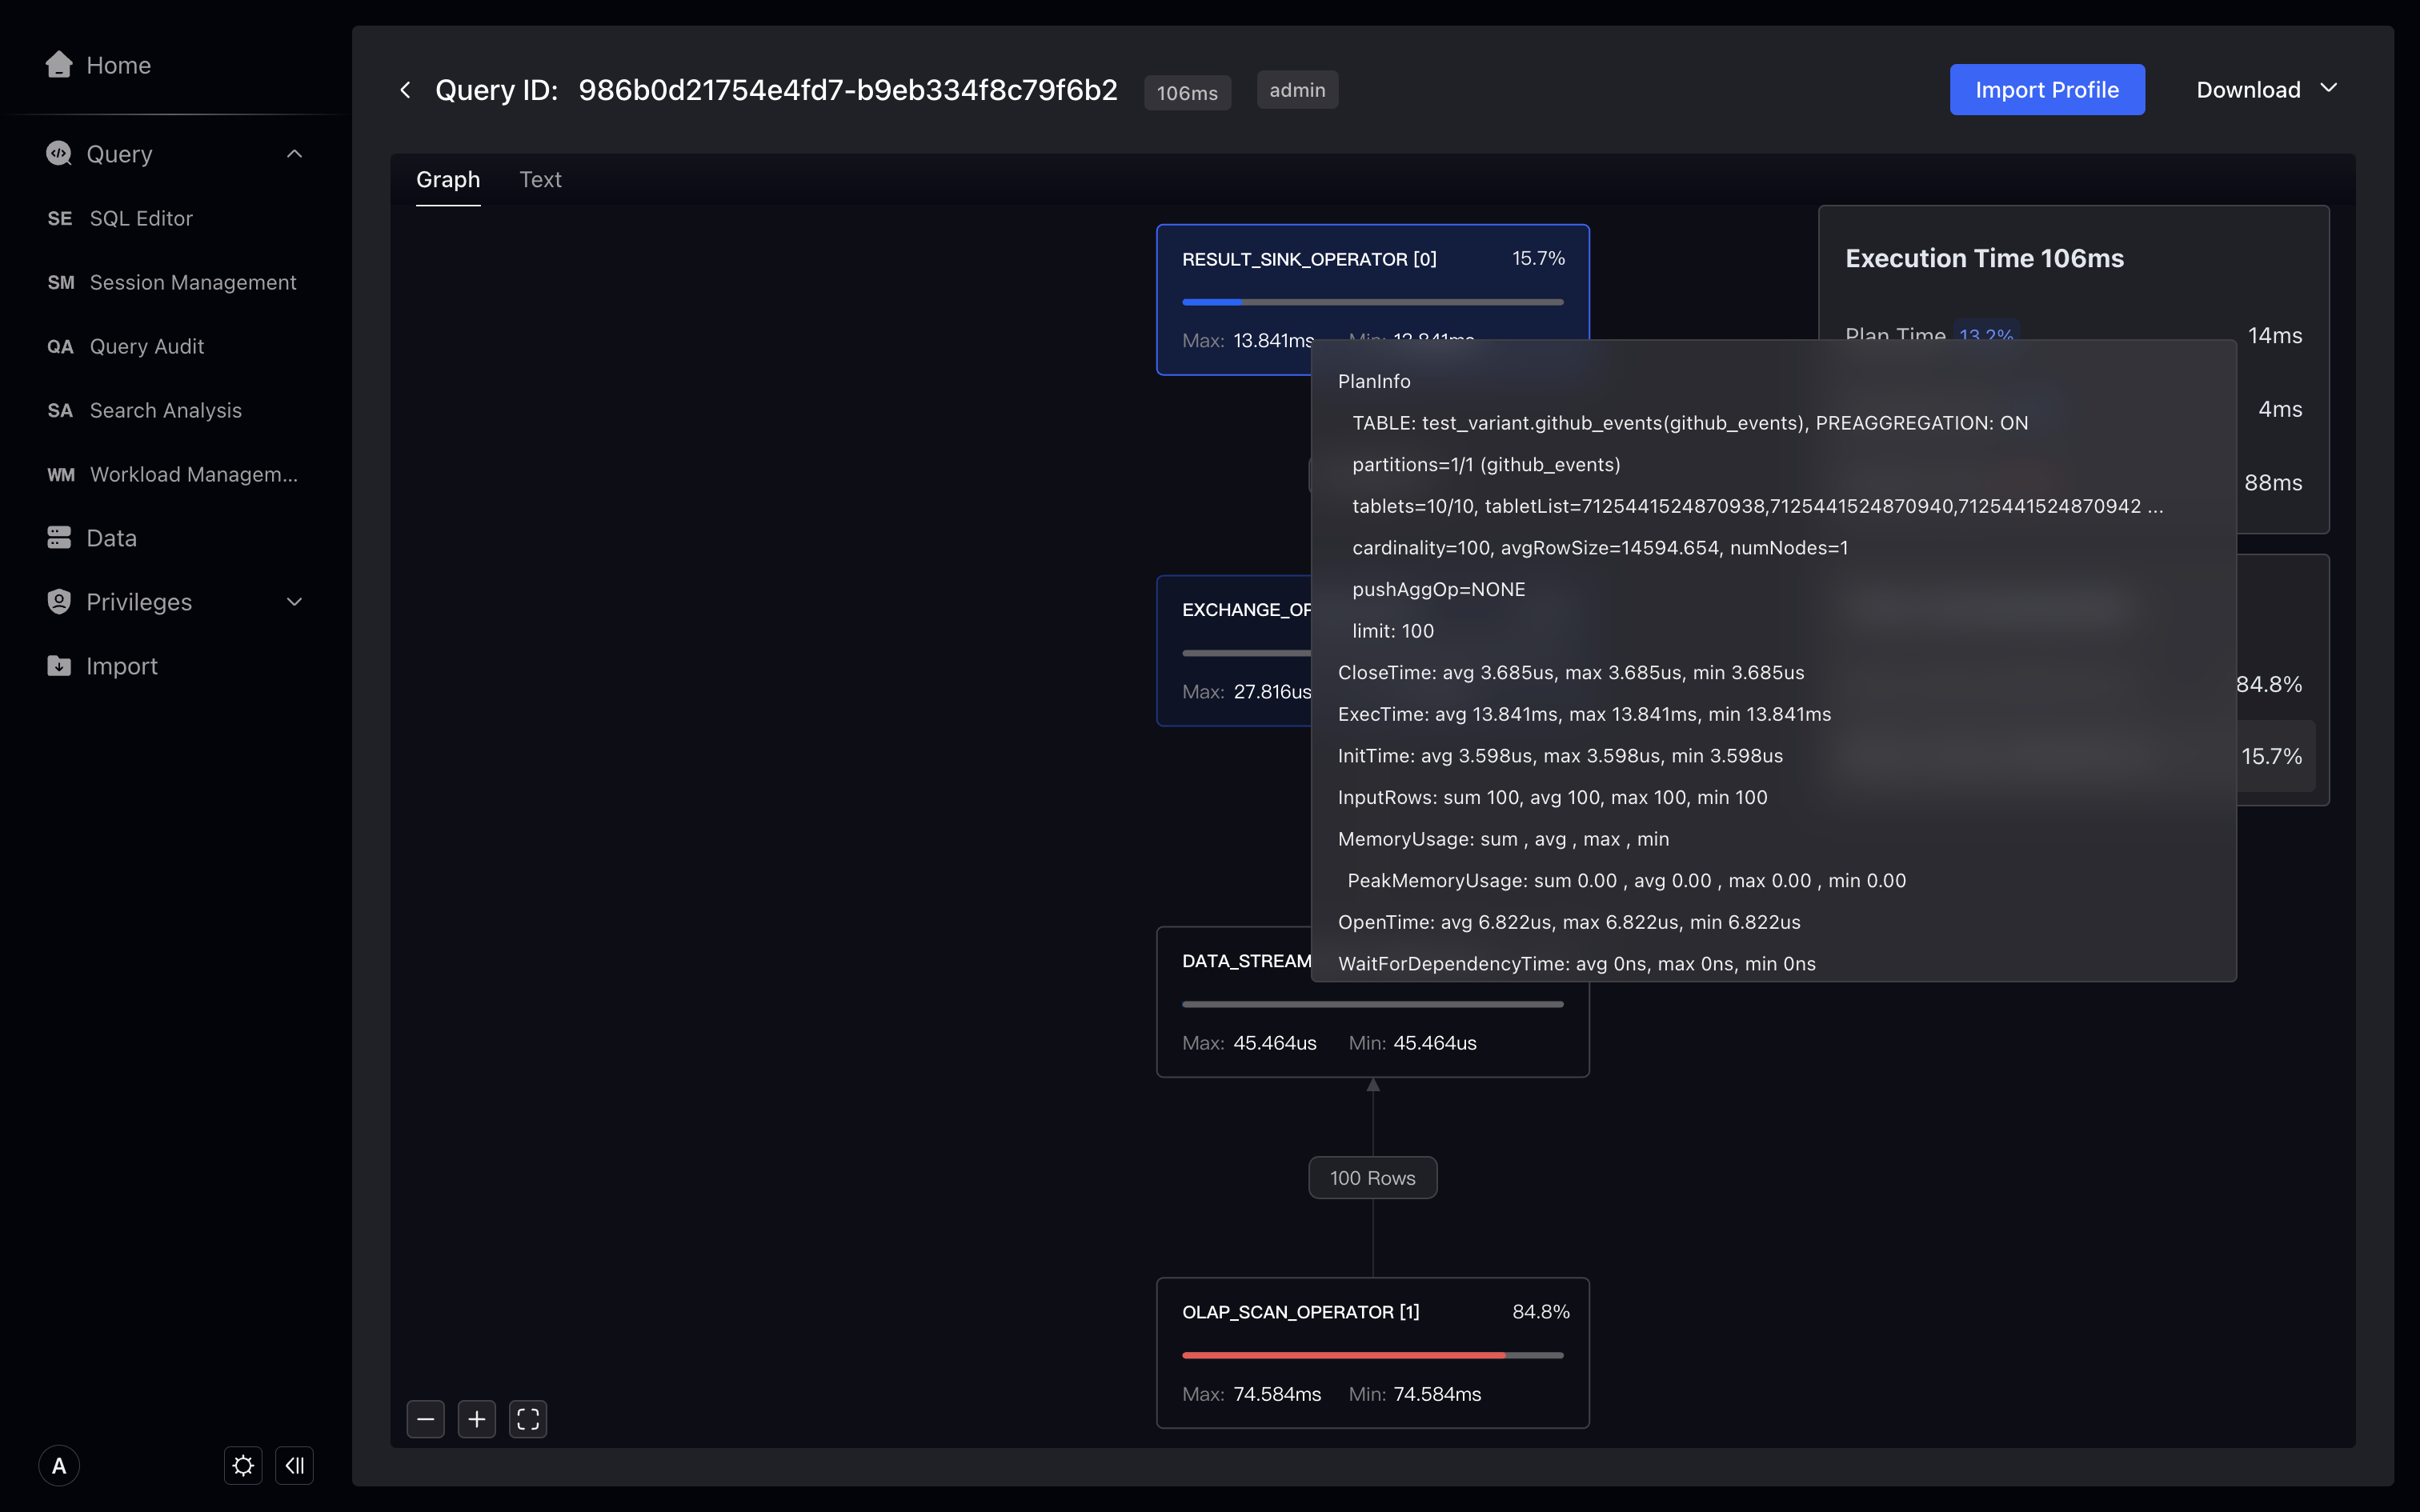
We are working closely with the Apache Doris team to enhance and standardize the visual profile, so stay tuned.
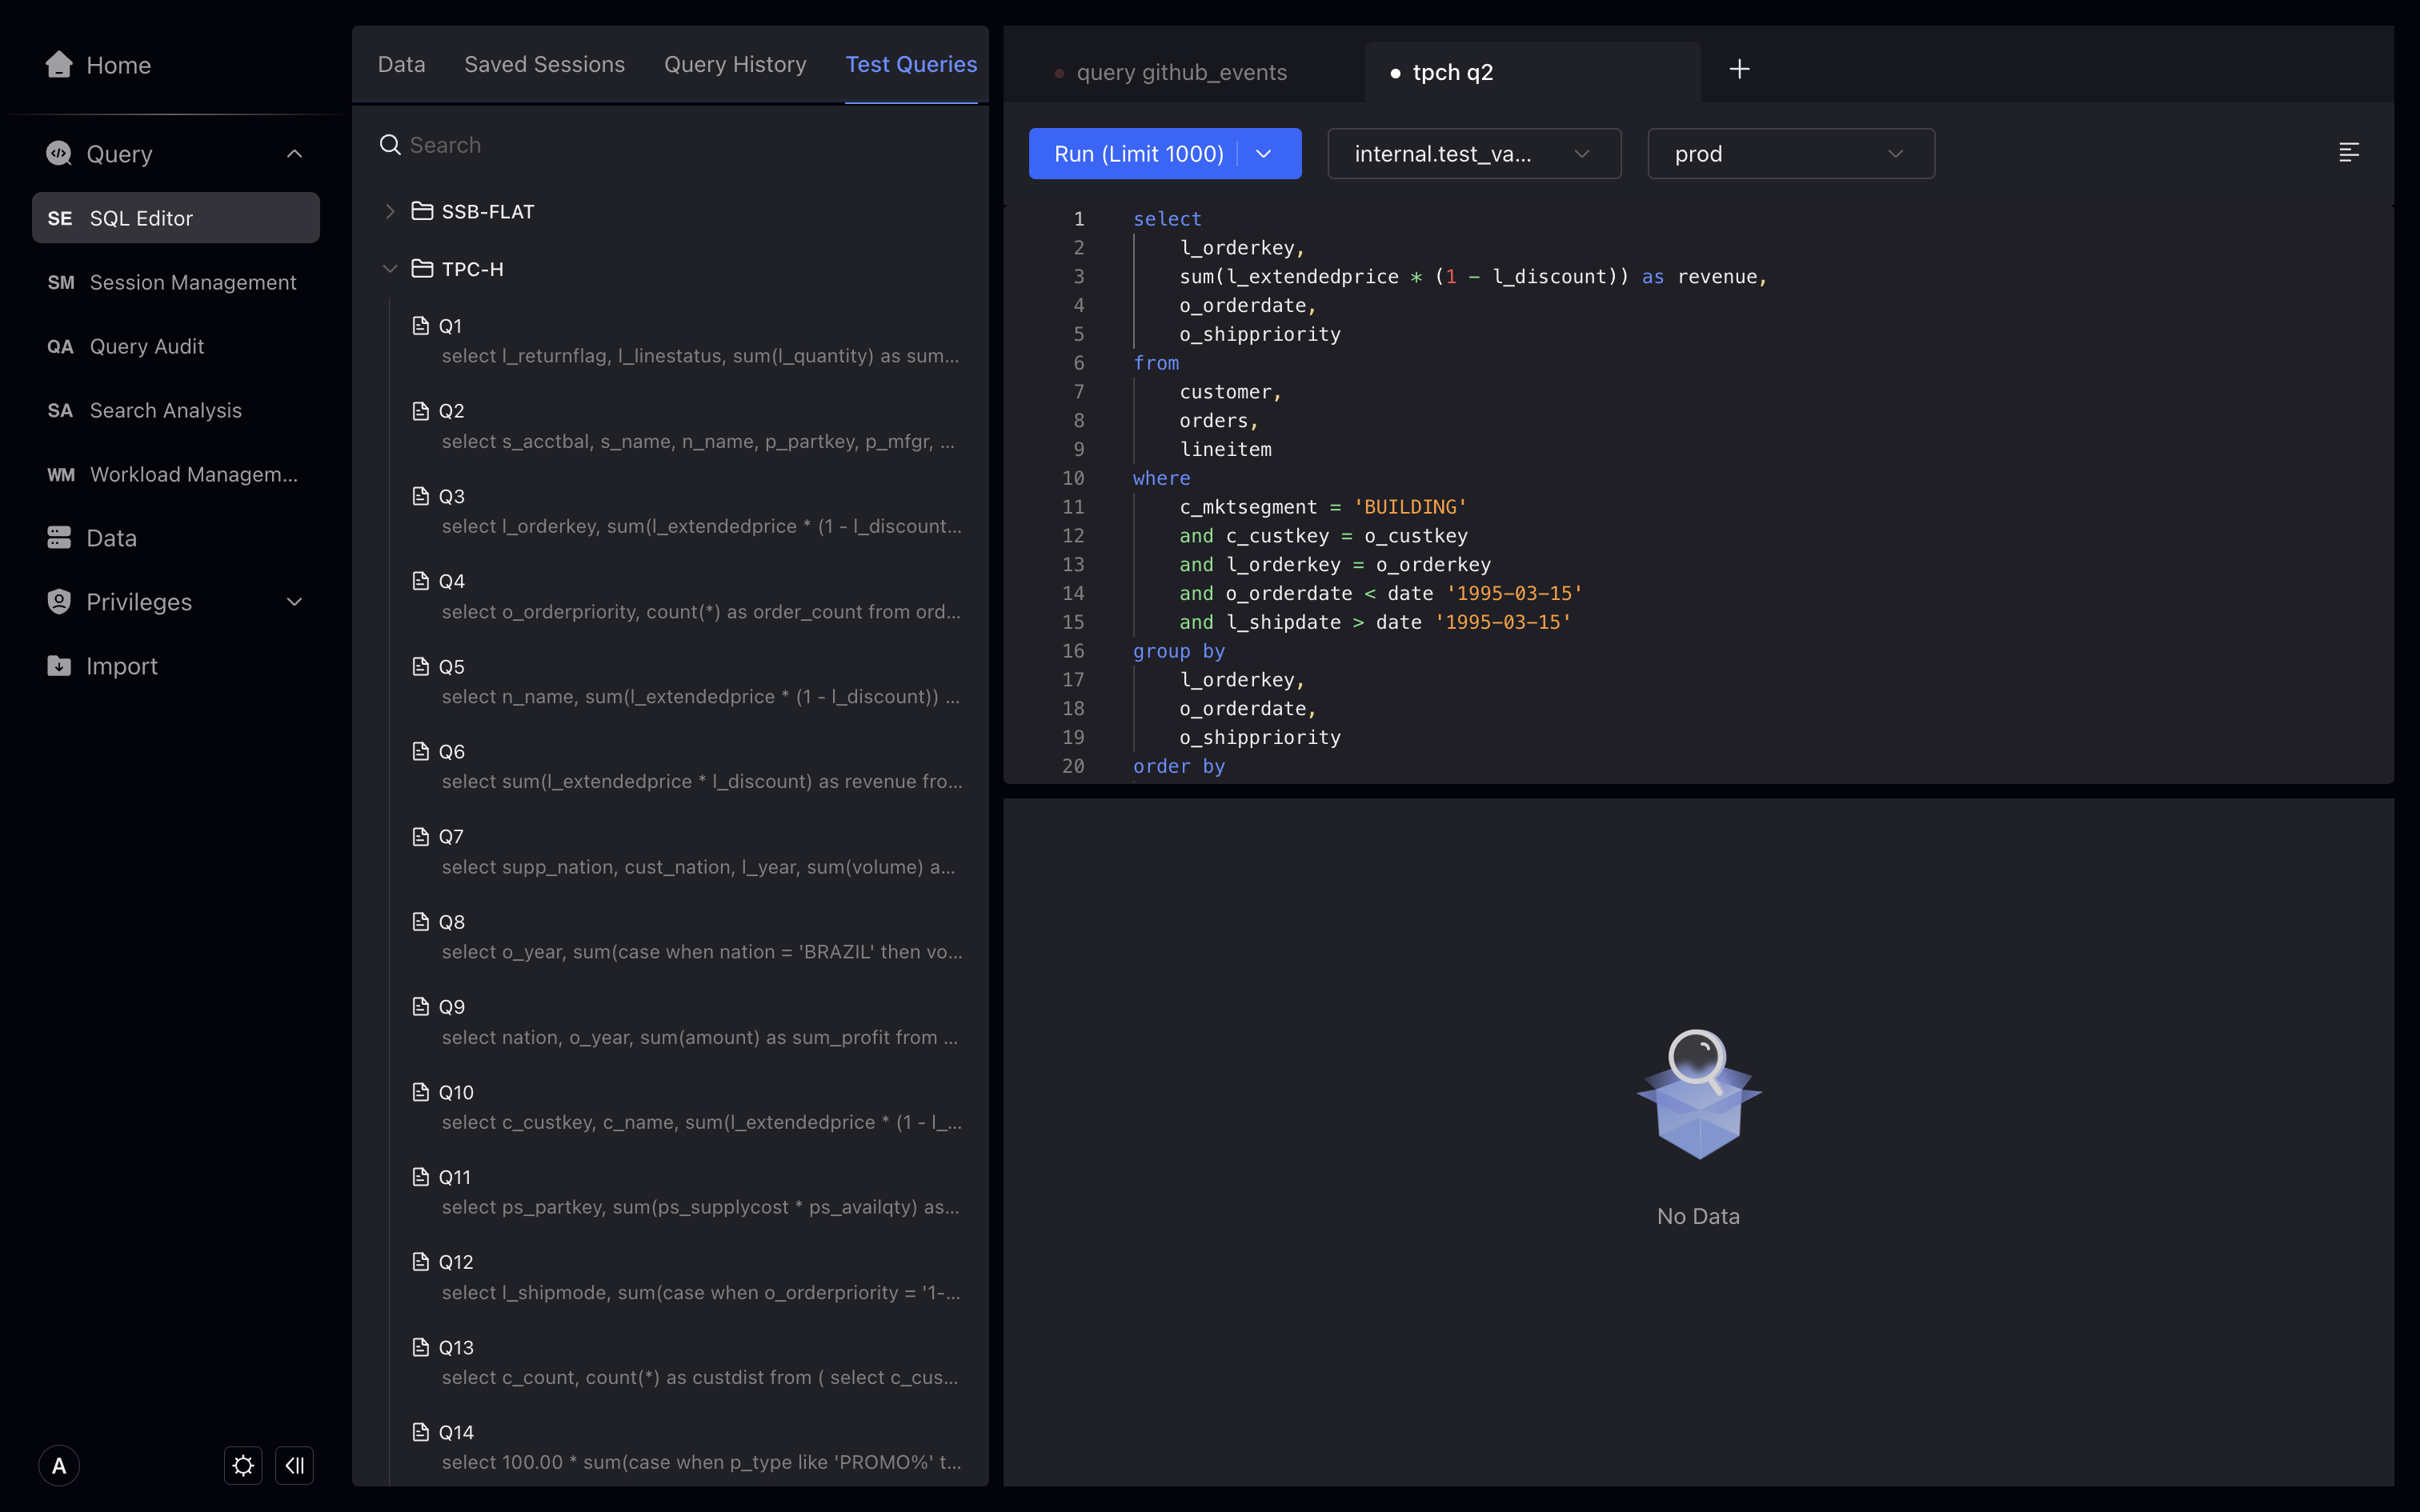
Query Template
We have built-in sample query statements for some test datasets in Studio to help you do some simple performance testing.
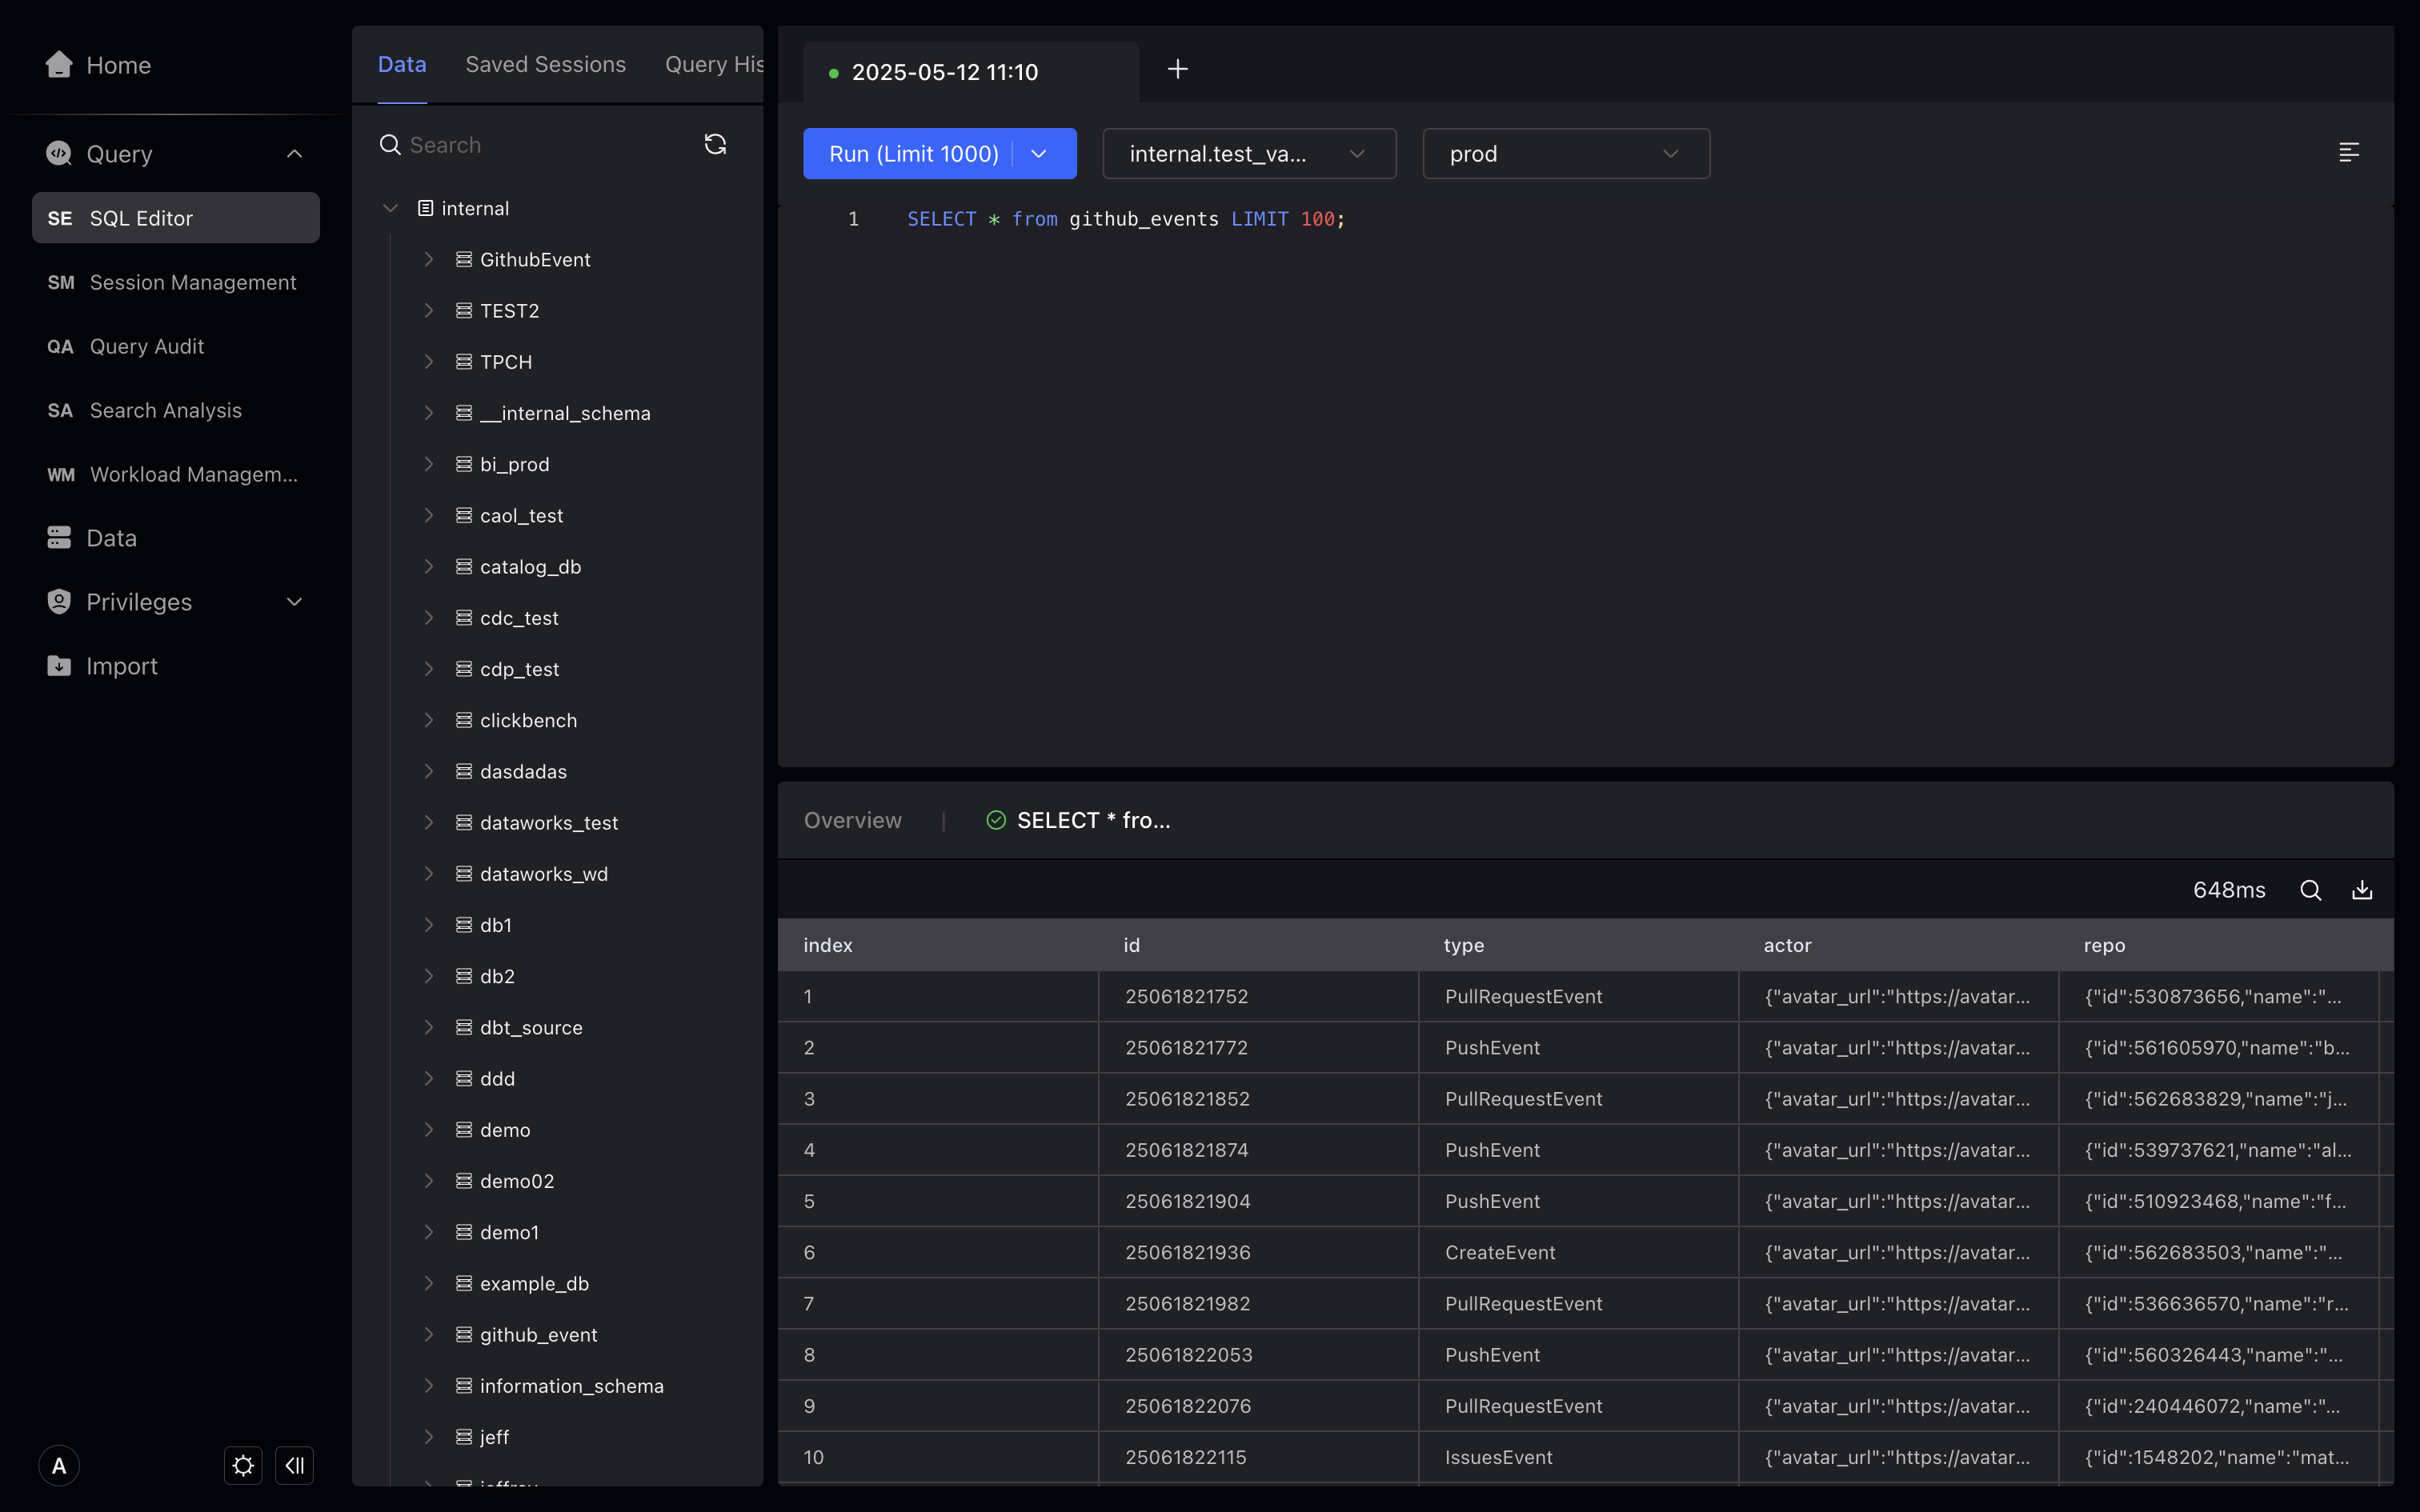
SQL Editor
We have customized the SQL editor for Apache Doris, which supports syntax highlighting, smart prompts, query history, query result caching and other functions.
Query Window
-
You can perform different query tasks by selecting different clusters. Some large queries may affect the performance of the cluster. You can choose a cluster with better performance to perform queries. (This drop-down box is only seen on Doris versions that support segregation)
-
Each query window is independent. You can execute different SQL statements in different query windows. The query results of each window will be cached. You can view different query results by switching Tab without starting a query again.
-
You can drag the query window's Tab to adjust the order of the query window.
-
You can double-click the query window's Tab to modify the name of the window.
-
You can resize them by dragging the split lines of the SQL editor and query result panels.
-
The execution button of the SQL editor has two states, namely "Execute" and "Execute All". If you select some SQL statements, the execution button will become "Execute", and only the selected SQL statement will be executed; if the SQL statement is not selected, the execution button will become "Execute all", and all SQL statements will be executed.
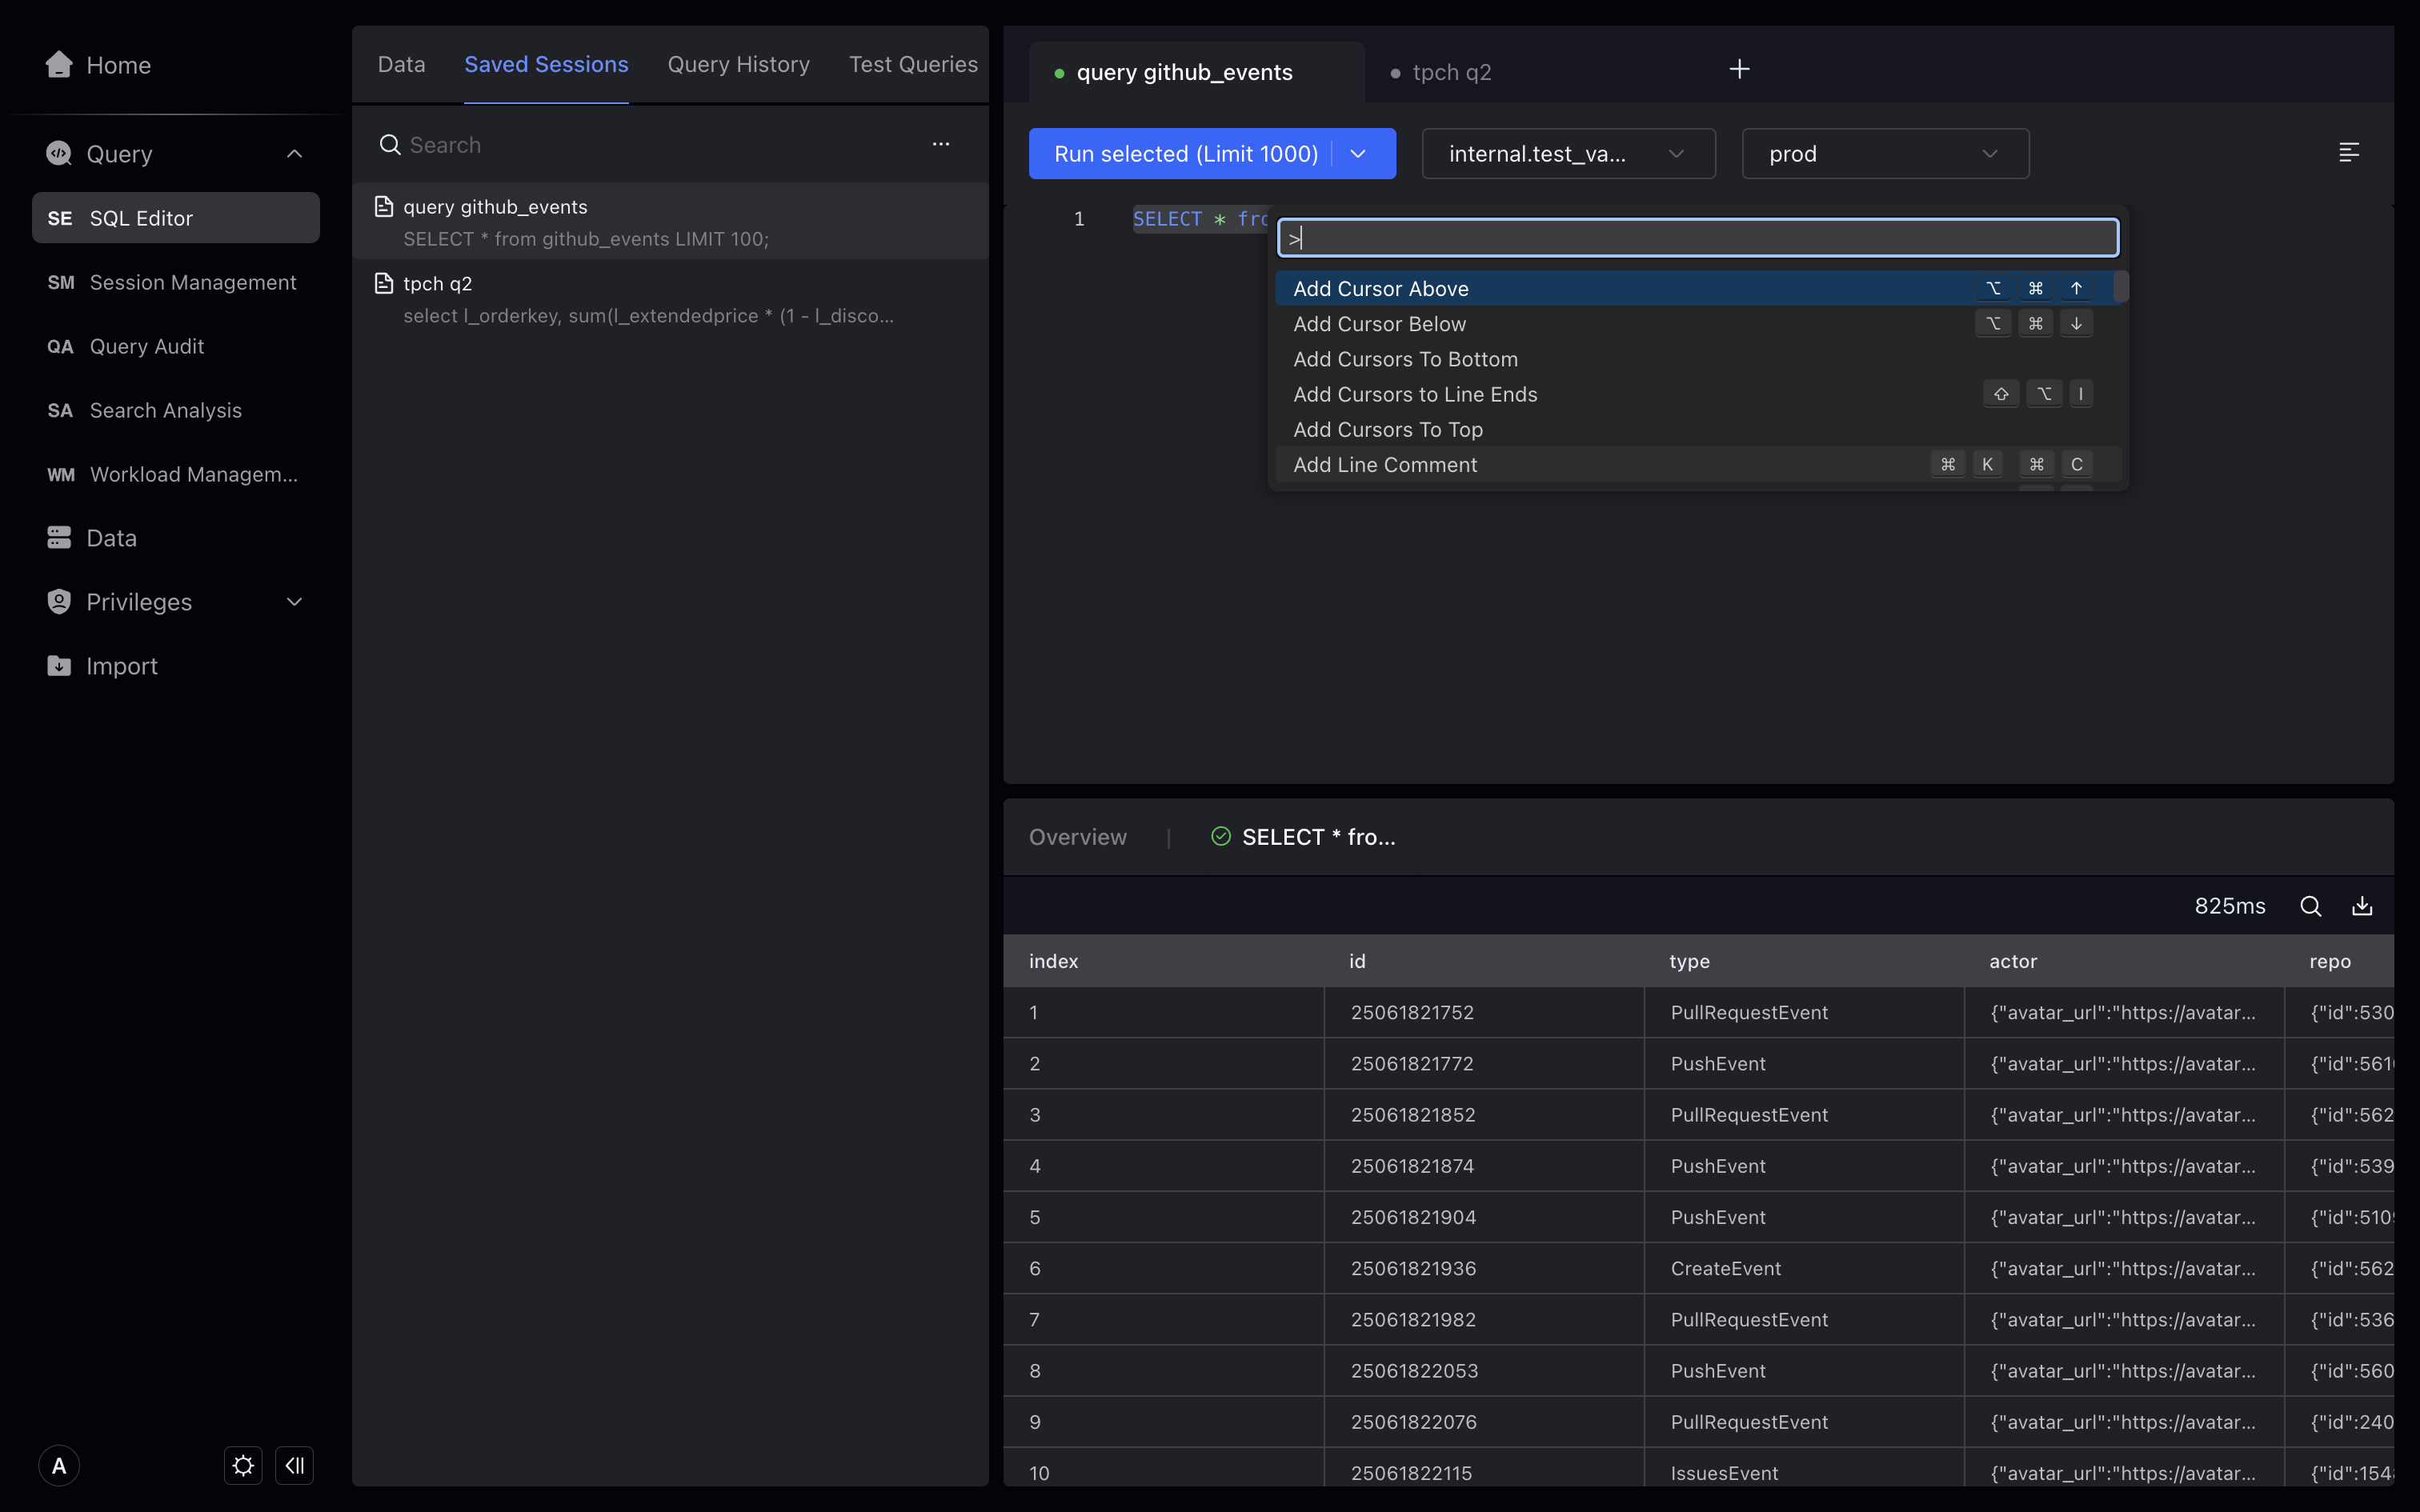
SQL Input Box
-
You can use the shortcut keys
⌘(Command) + Cto copy,⌘(Command) + Vto paste,⌘(Command) + Xto cut. -
You can right-click to call out the context menu of the input box, click Command Palette to open the command panel, and you can view all supported commands.
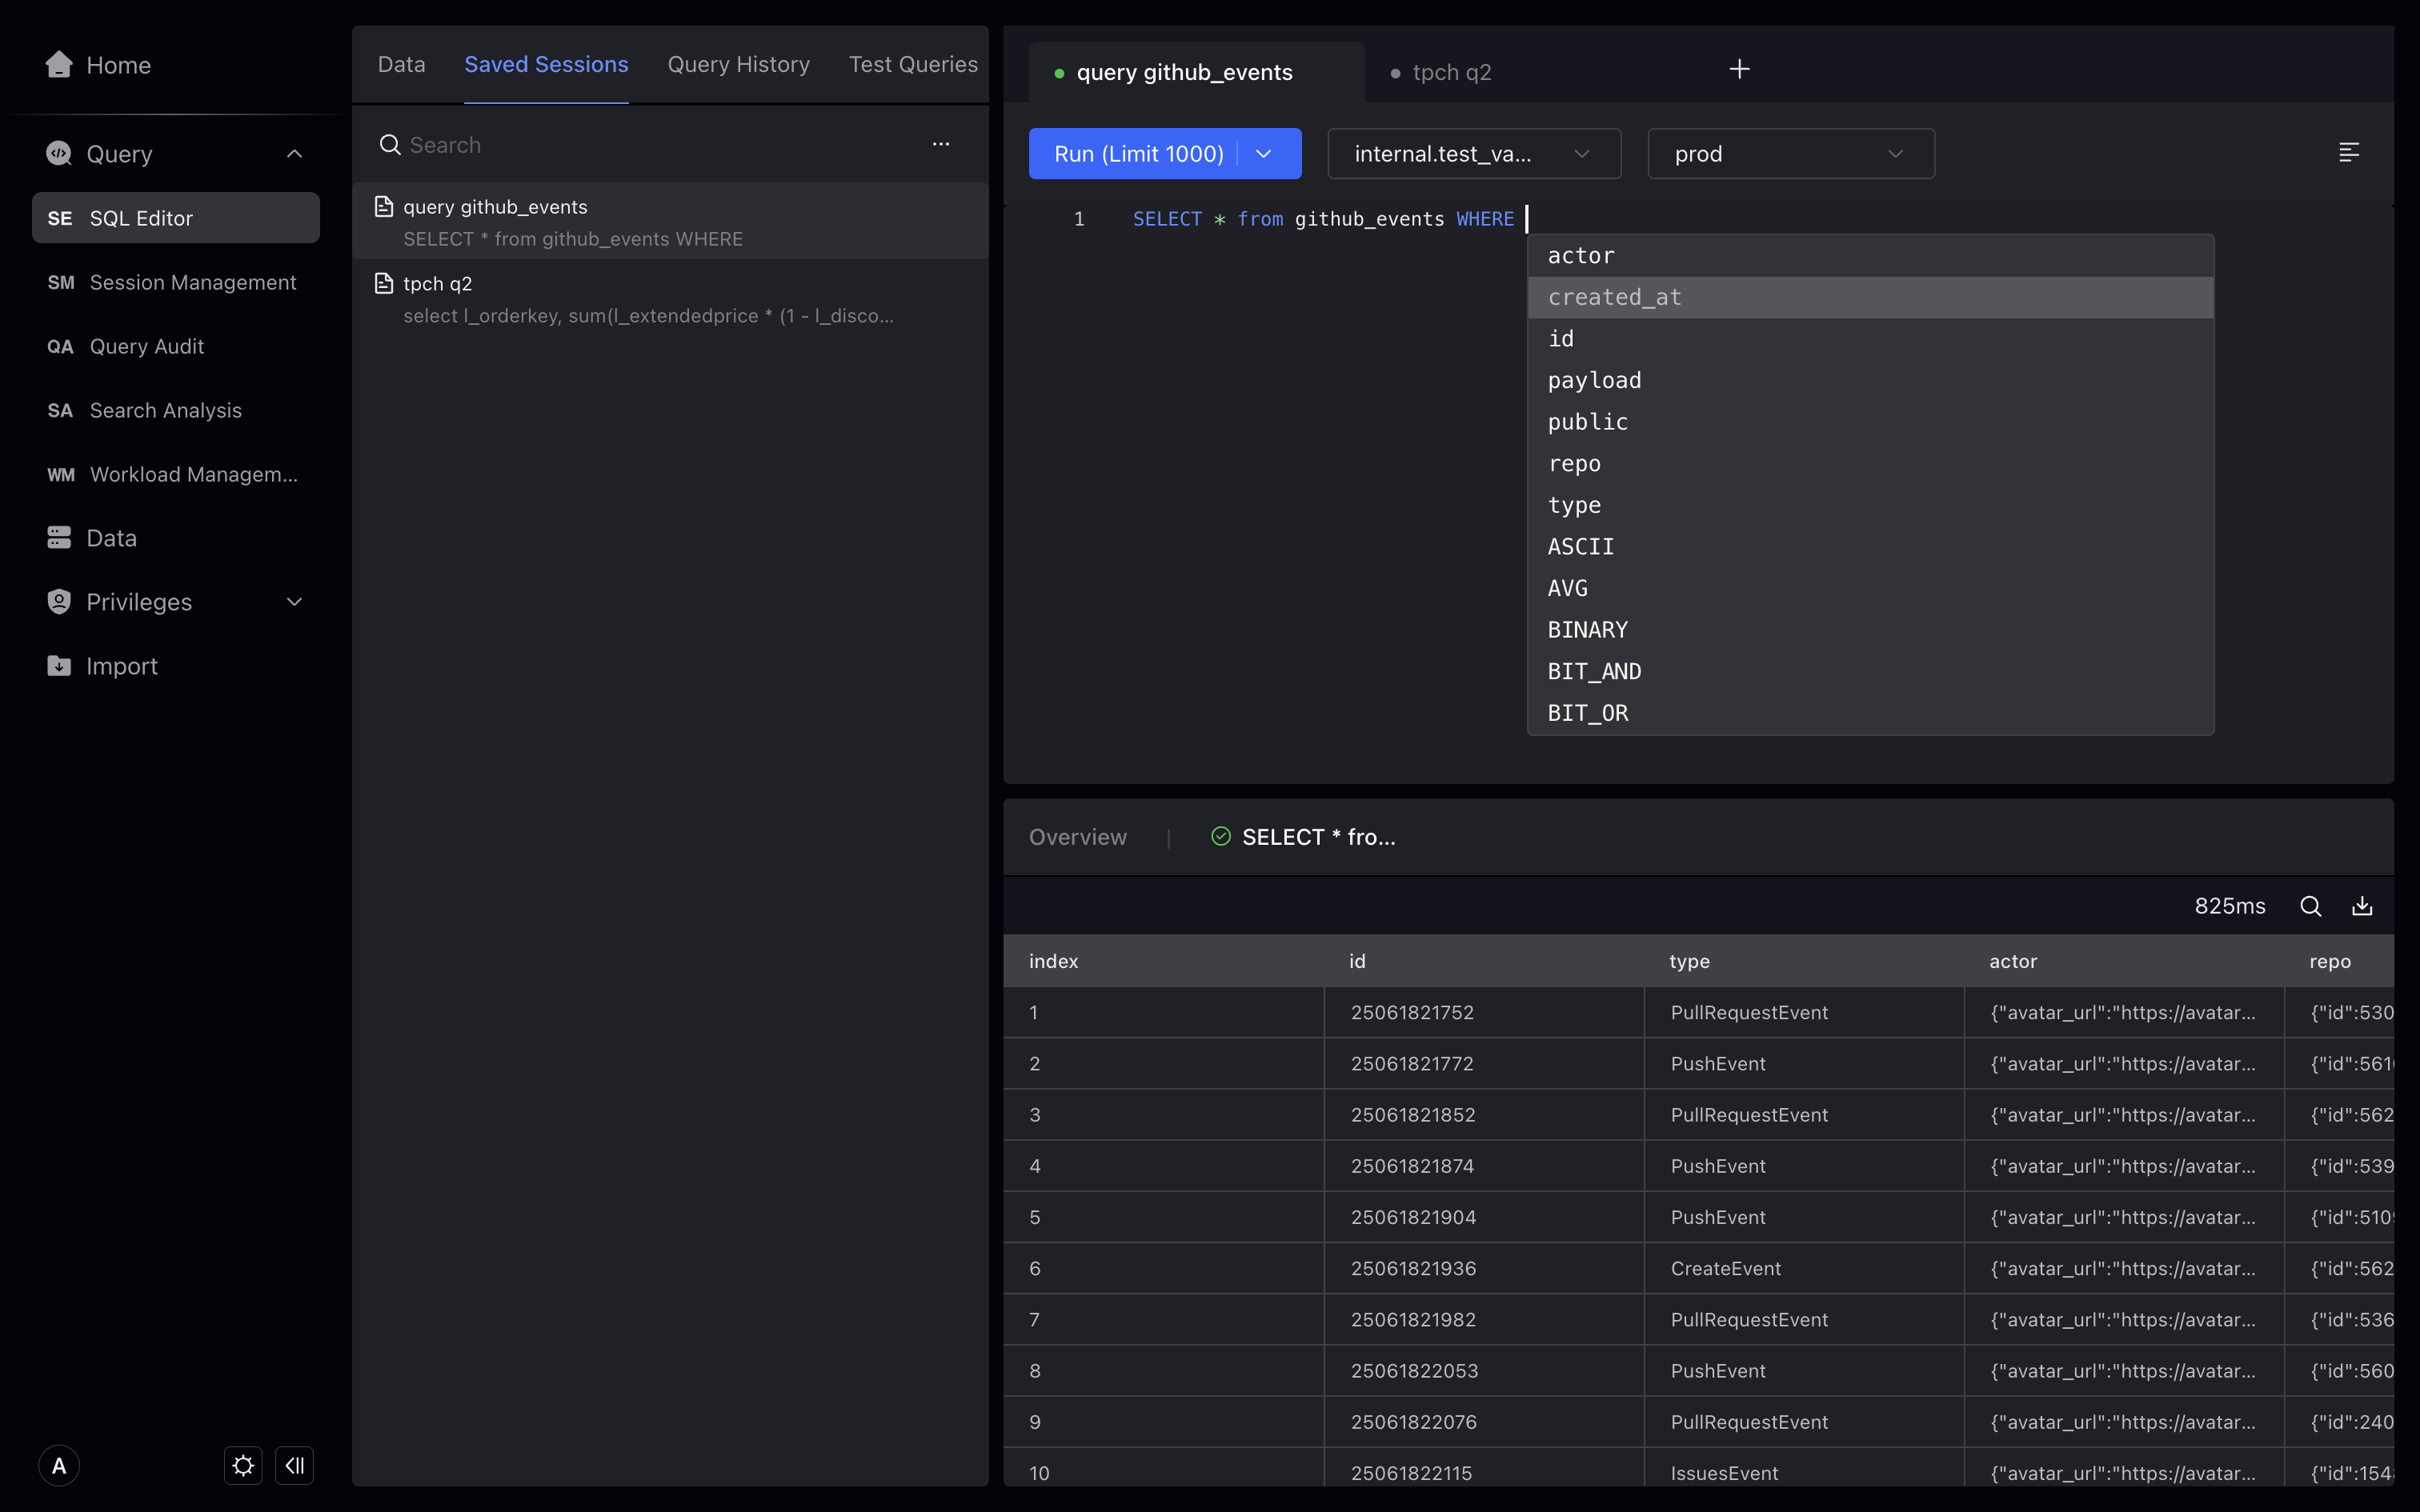
Smart Tips
-
By default, smart prompts will automatically prompt keywords, table names, field names and other information based on your input. But you can also use
⇧(Shift) + Spaceto manually trigger smart prompts. -
The smart prompts of the SQL editor will prompt based on the database you selected. For example, when you execute
SELECT *FROM, the smart prompt prompt will prompt the table in the__internal_schemalibrary selected in the drop-down box. When you continue to enterWHERE, the smart prompt will prompt the field of the table. However, for some DDL statements, smart prompts may ignore the selected database above. For example, when you enterUSE, smart prompts will prompt you both the catalog and the database under the currently selected catalog__internal_schema.
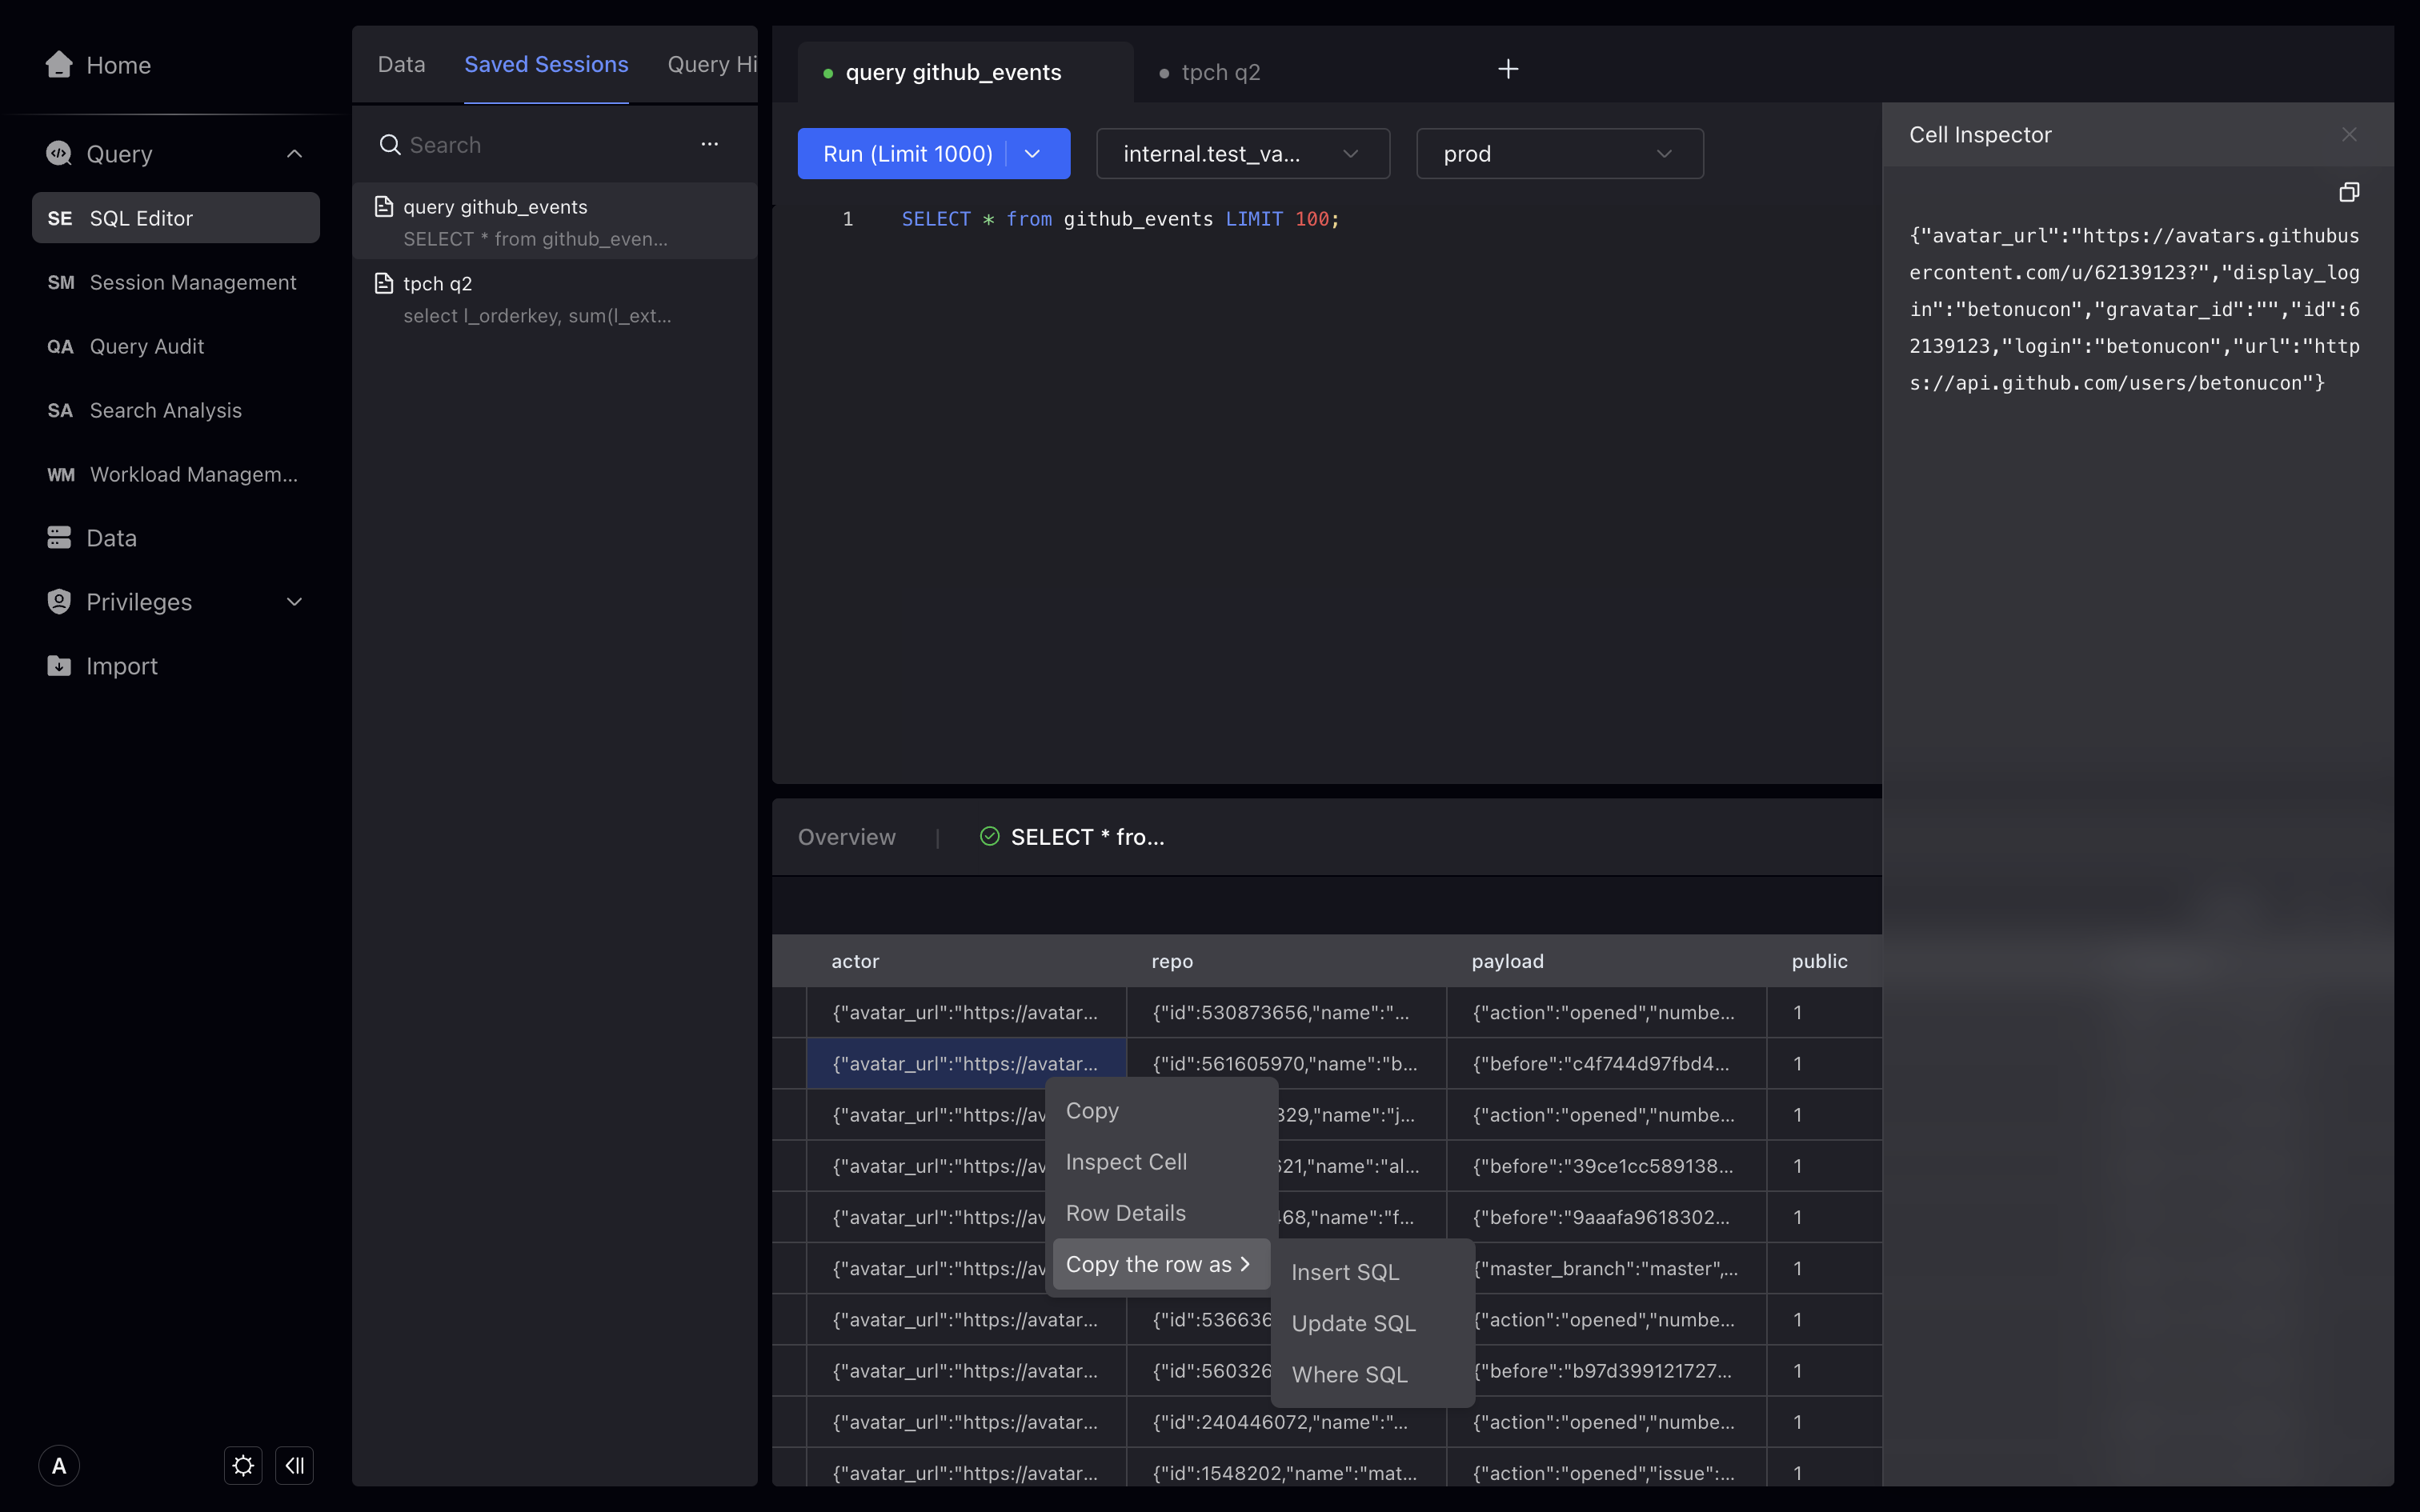
Results Panel
In the results panel, you can see the execution results of SQL statements, including query results, execution time, number of rows, etc. You can also search for results through the search box, or click the table header to sort the results.
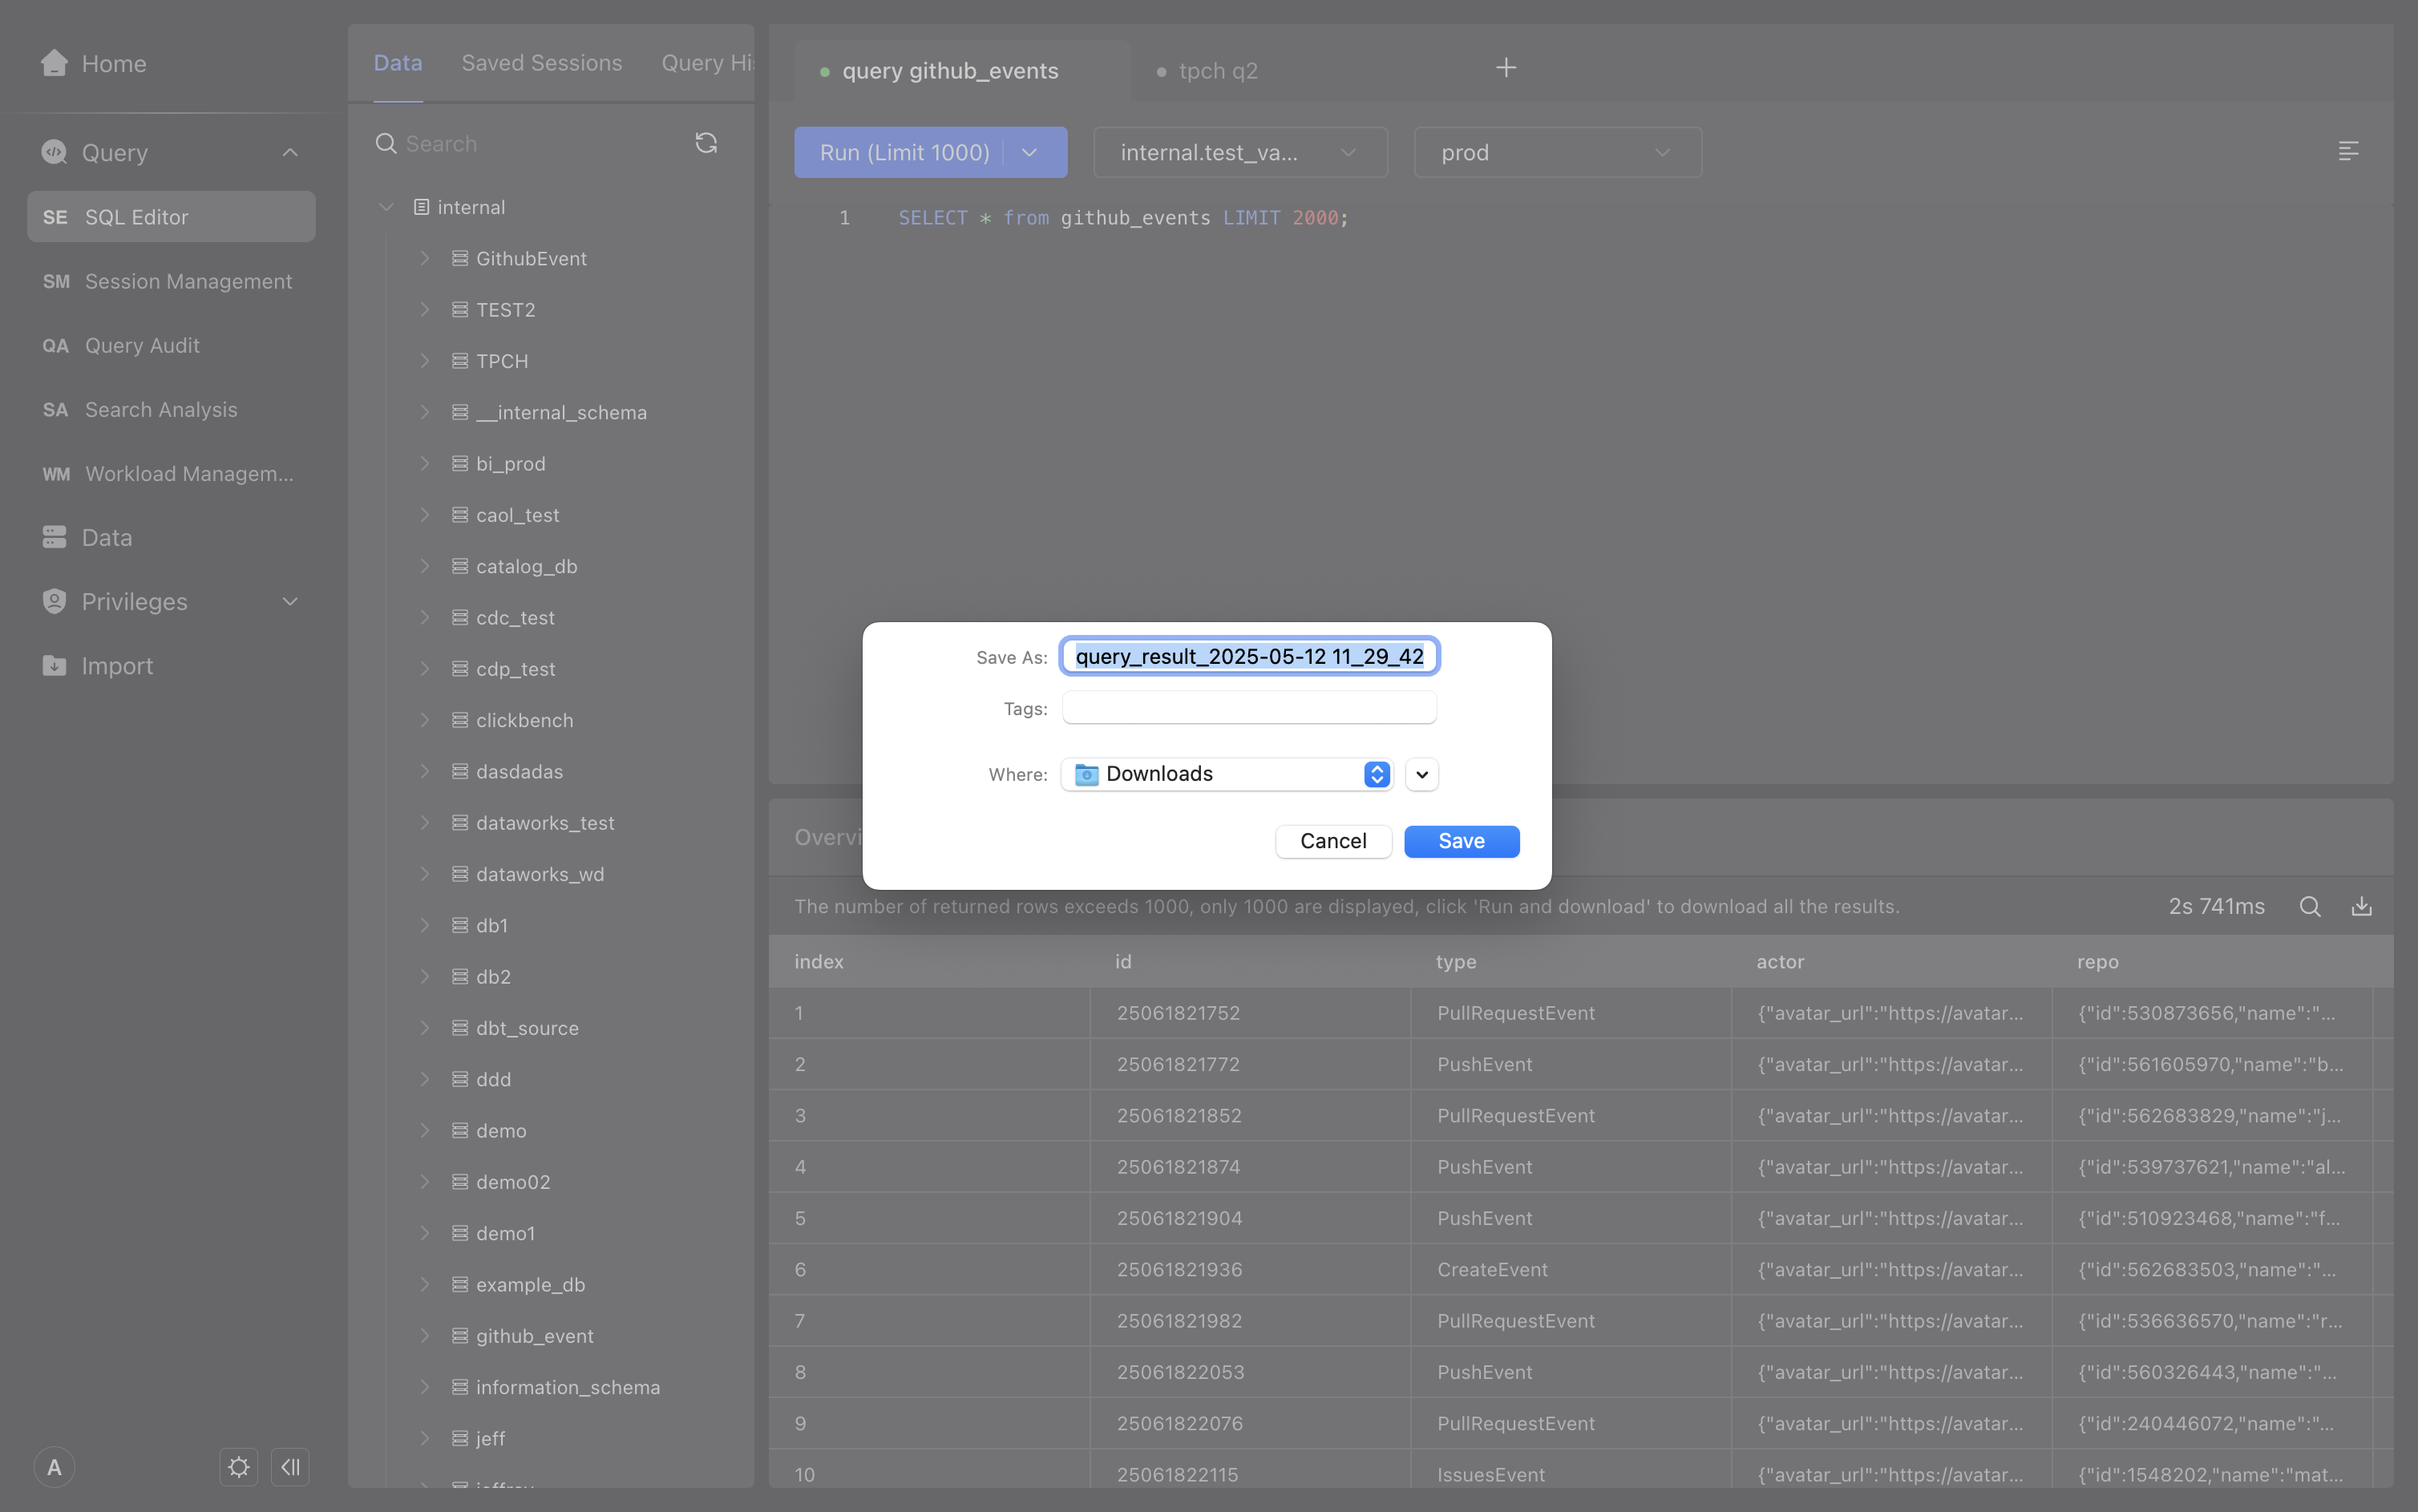
User Limitations
- The SQL editor defaults to query up to 1000 pieces of data. If the query results exceed 1000 pieces, only the first 1000 pieces of data will be displayed. You can click the "Query and Download" button to download and view all data.