Studio
VeloDB Cloud Studio ("Studio") is a data development platform for data development scenarios. It is a data development platform on the cloud provided by VeloDB, which can assist users in managing and exploring data, and can replace Navicat.
Main Function
- Warehouse Login : Use different database users to log in to the warehouse in the Studio.
- Data query :
- SQL Editor : An easy-to-use SQL query editor that supports query execution, automatic SQL saving, query profiles, historical query records, etc.
- Log Analytics : A user-friendly analysis tool for log scenarios, supporting SQL filtering, searching, and other functions.
- Session Management : Manage running SQL queries and allow viewing and terminating SQL queries.
- Query Audit : A one-stop historical query audit tool that can filter slow queries and view their execution.
- Workload Management : Support quick creation, editing and viewing of Workload Group.
- Data Management : View and manage data in the database, currently supports viewing.
- Privilege Management : Manage users and roles in the database, and grant and revoke permissions to them.
- Data Integration : Easily connect to data in object storage on the cloud, connect to data lakes, and import sample data.
- Import: Support the view of import tasks and operate on import tasks.
Register and Login
Using the Studio service
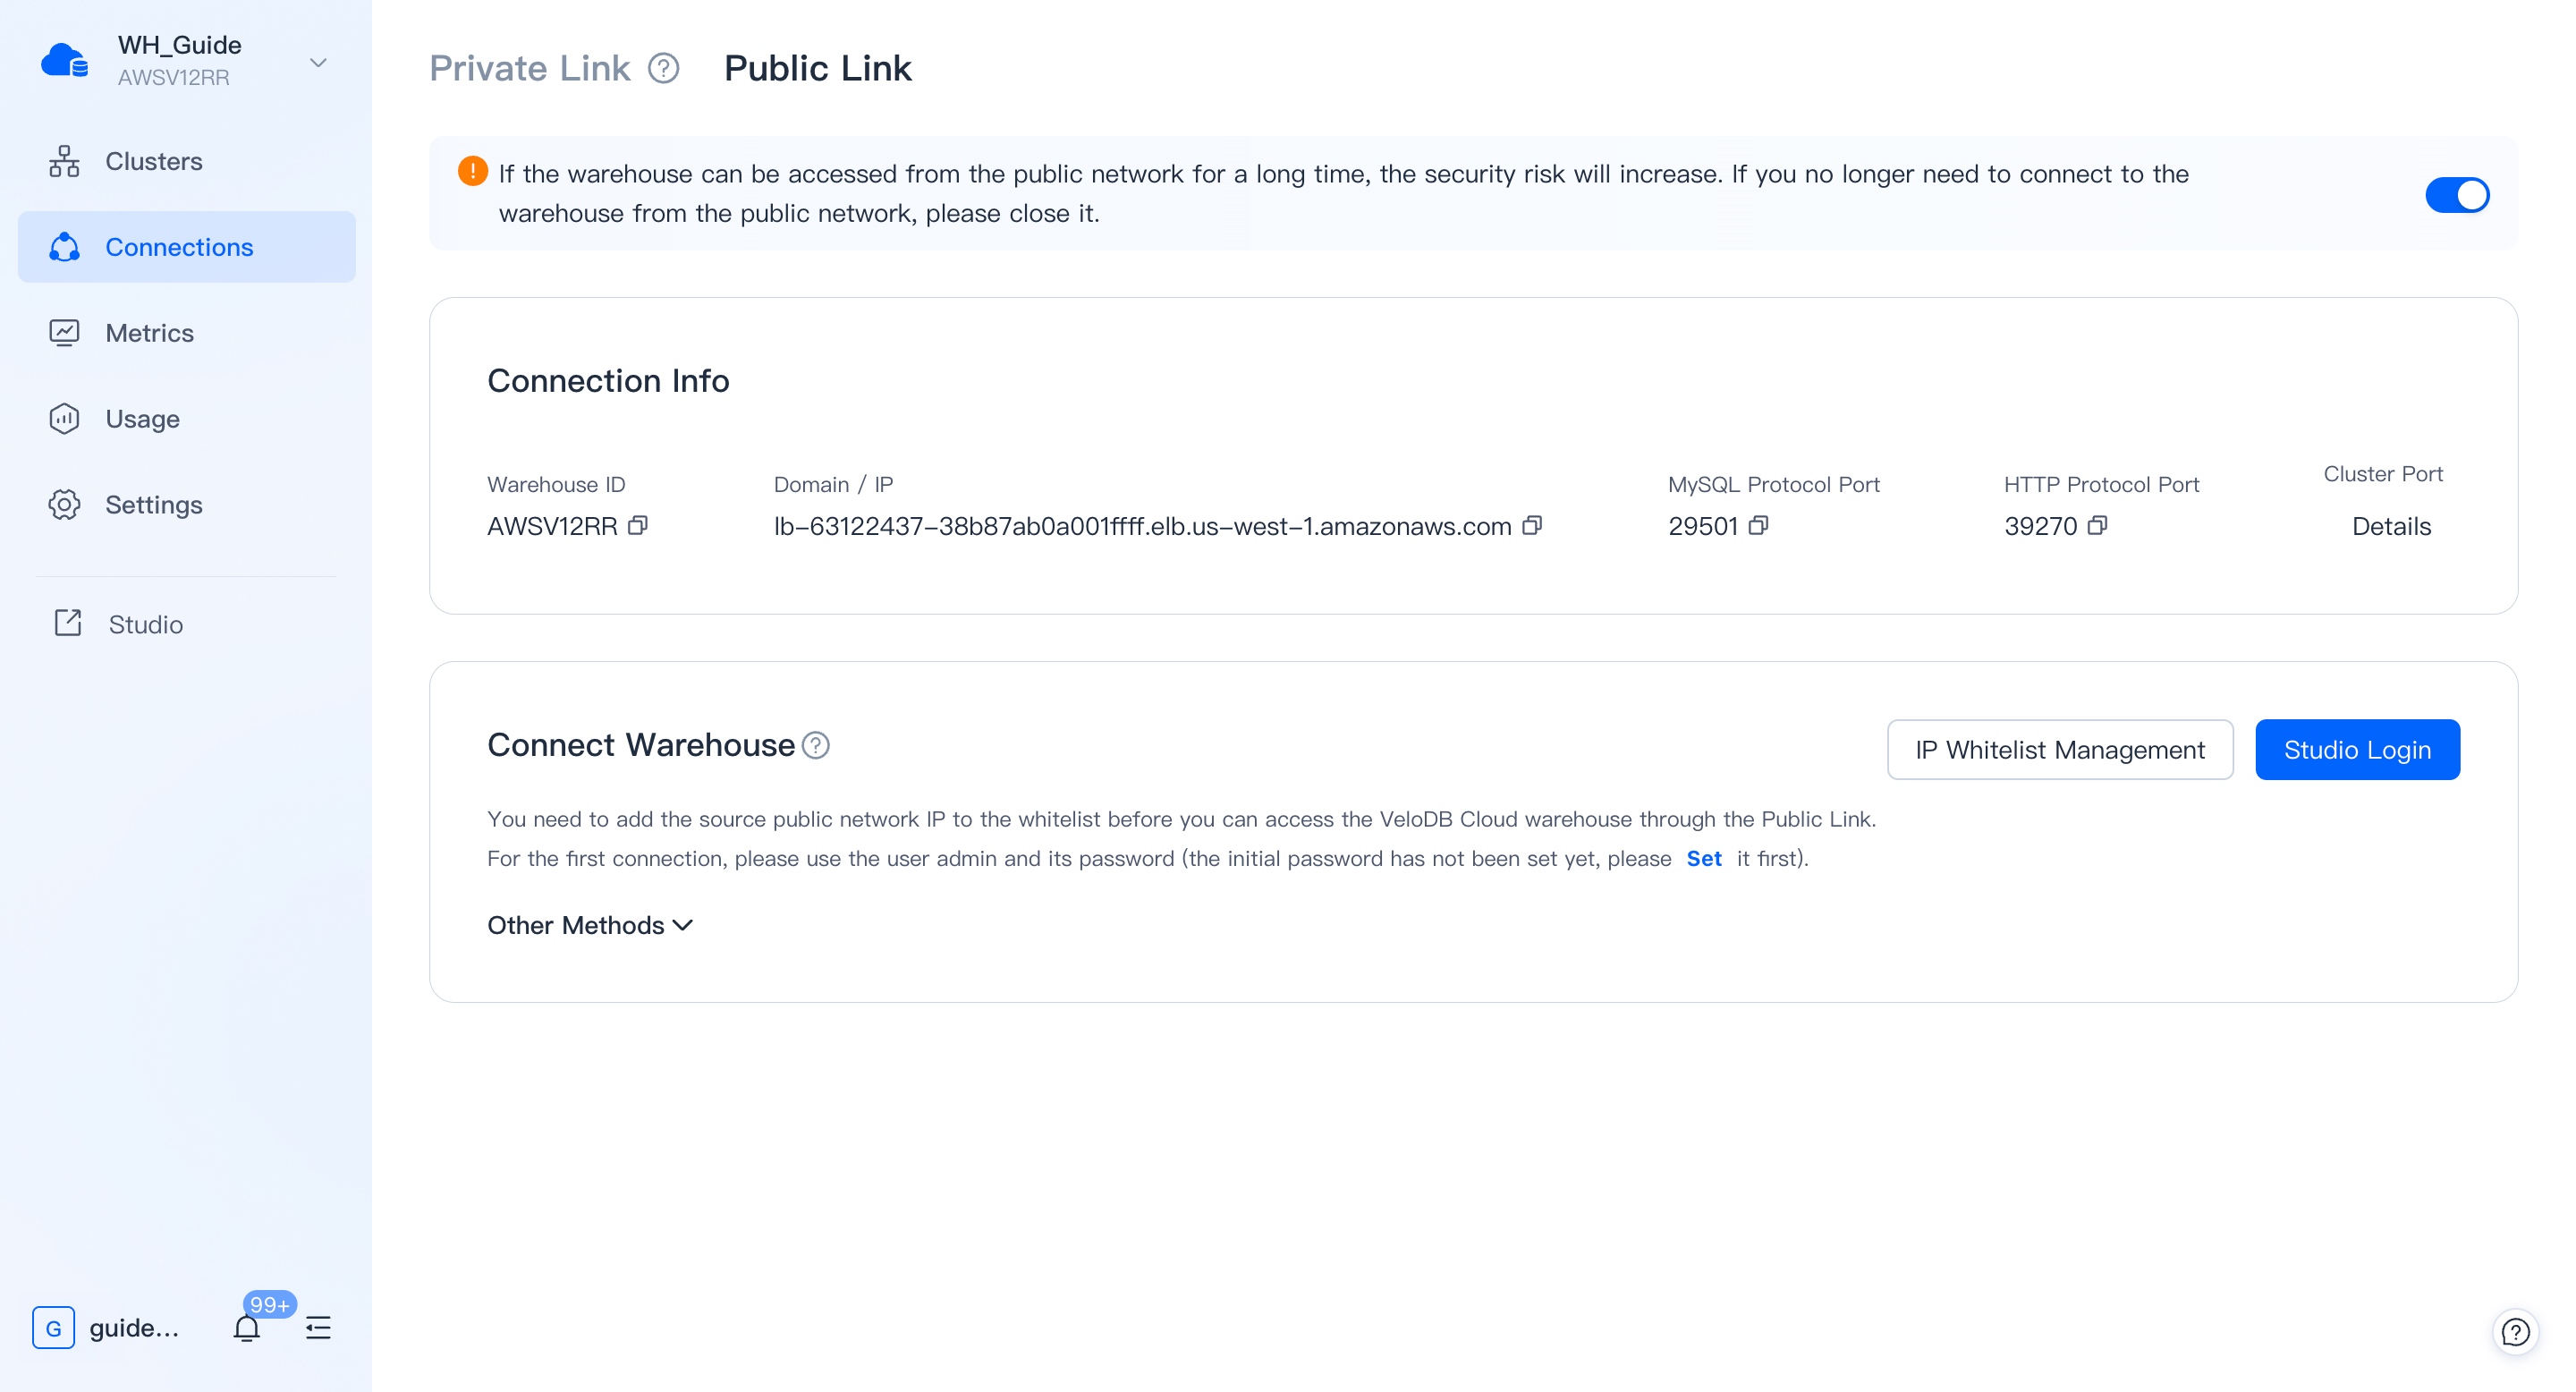
In VeloDB Cloud Manager ("Manager"), each warehouse has a corresponding Studio service. In the "Connection" module of Manager, you can find the entrance to the Studio through a private network or a public network.
You can also save the entry address of the Studio for direct access.
Login to Studio
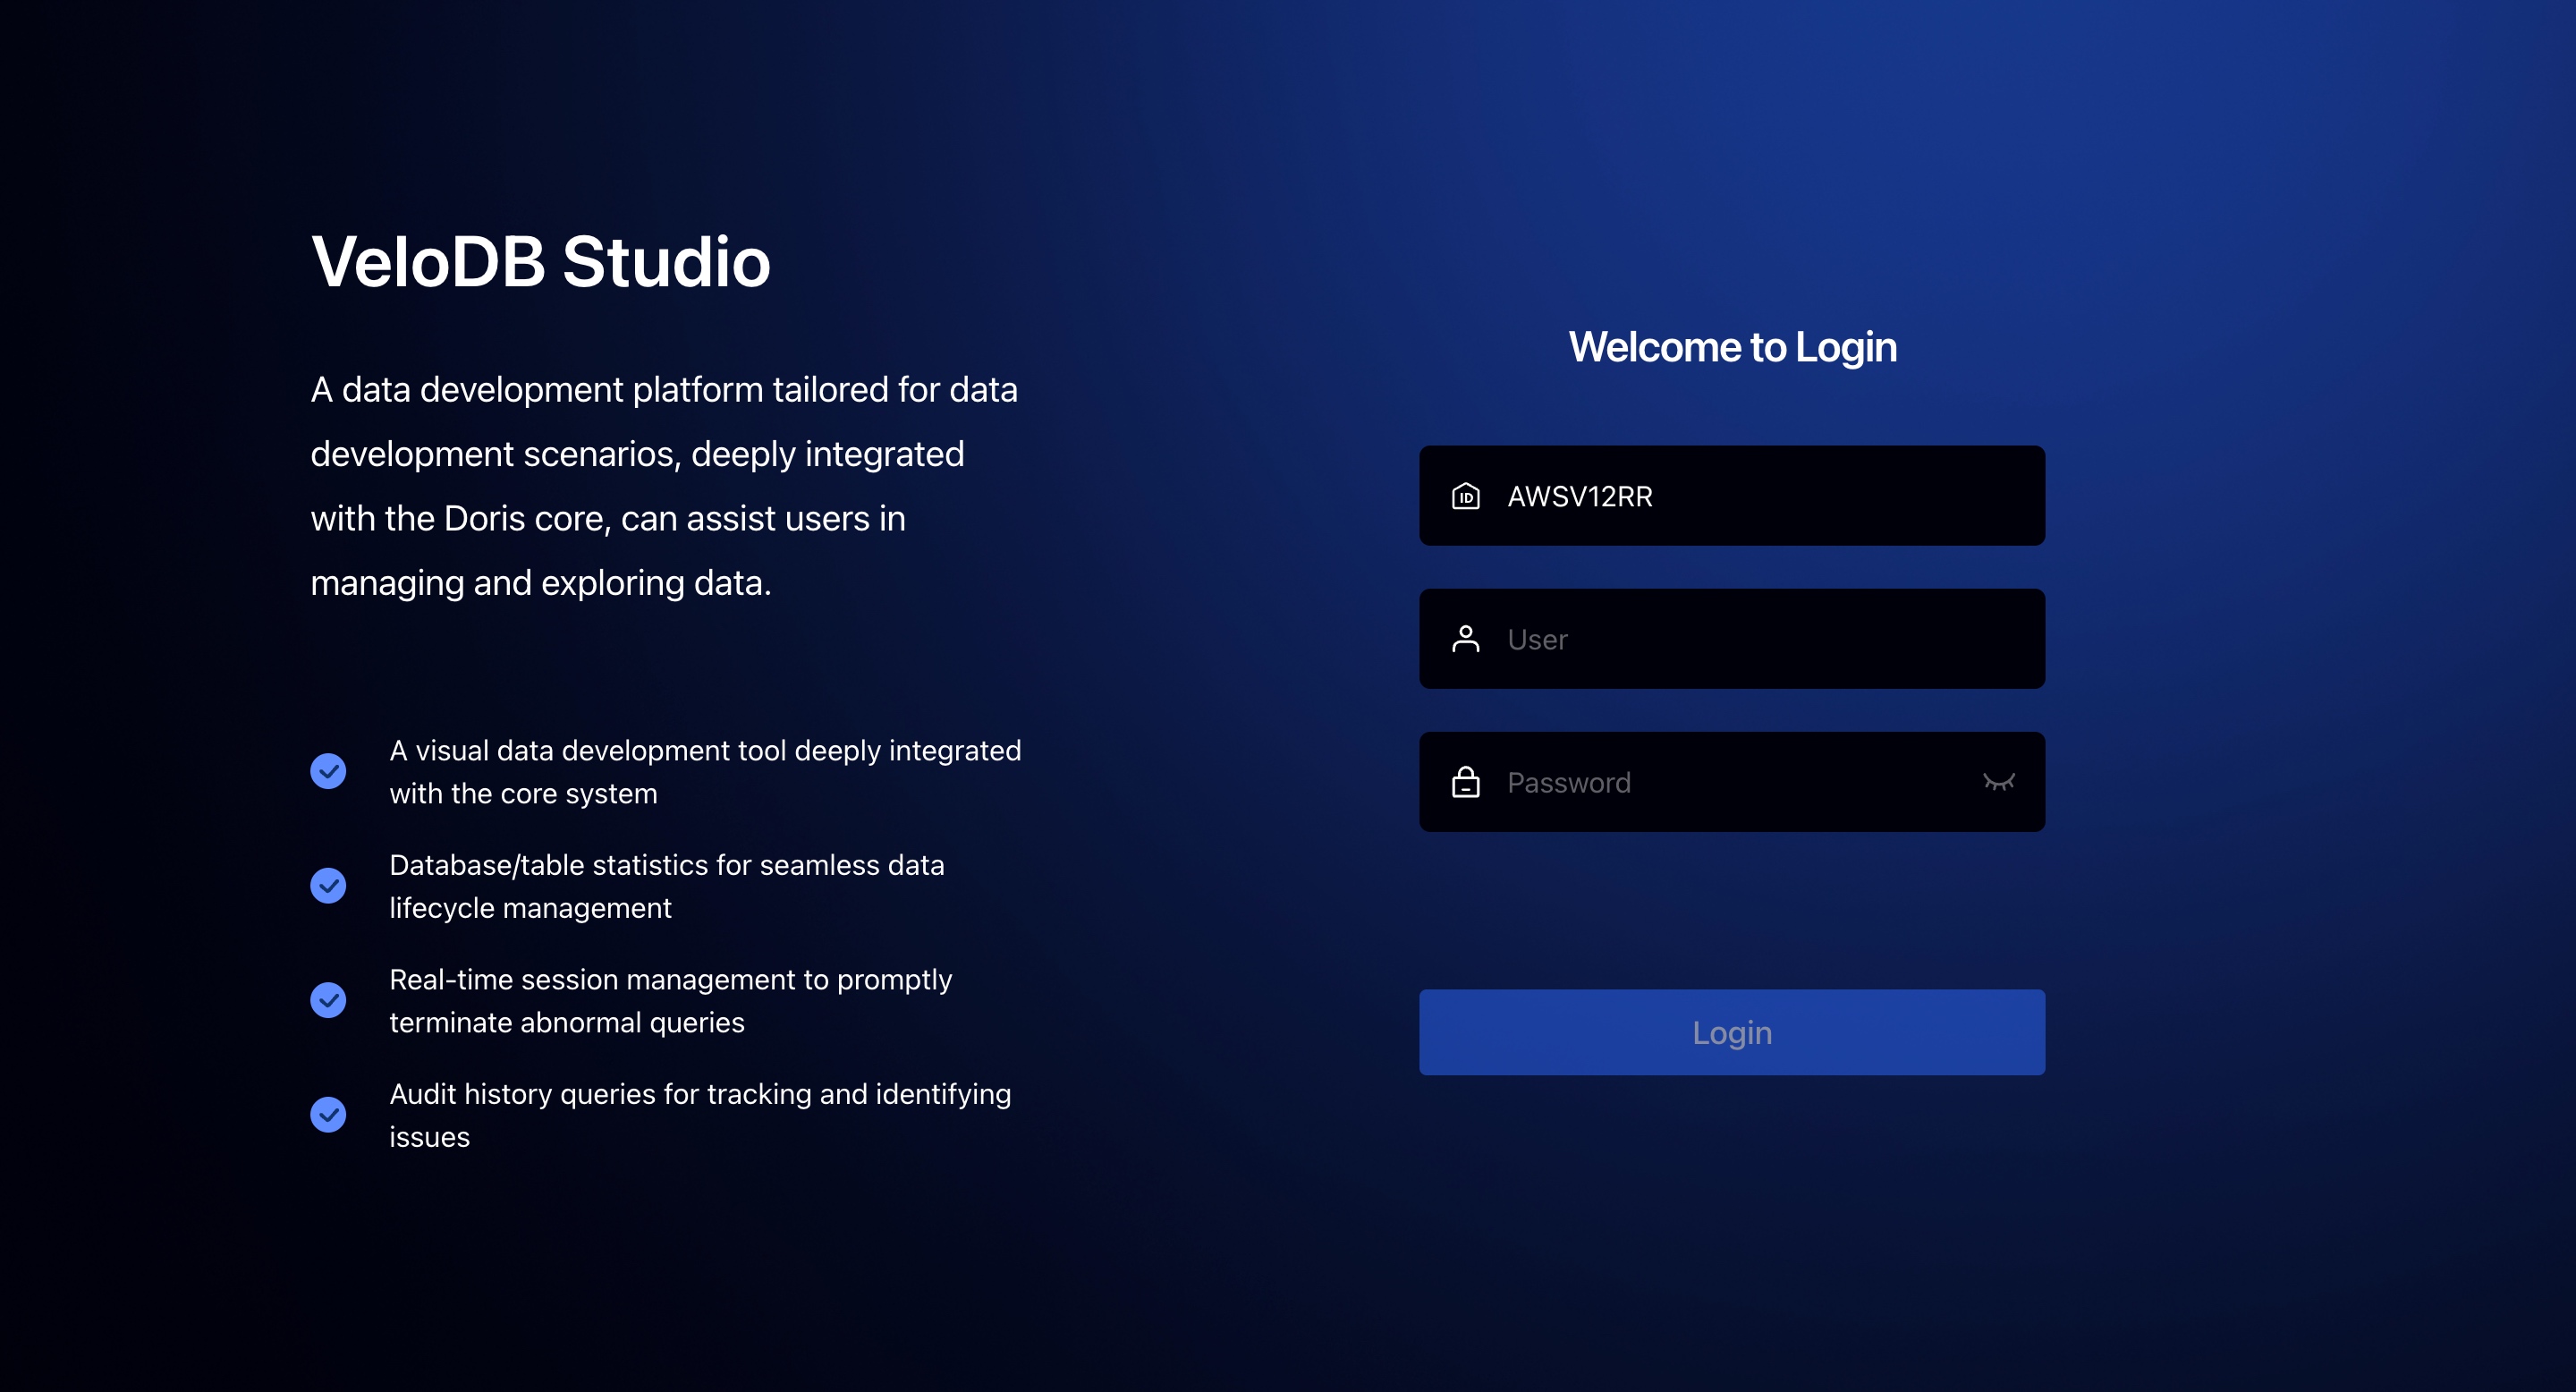
You need to enter the Username and Password of the warehouse on the login page. If you clicked the link to log in from the Manager, the warehouse name should be pre-filled.
We will not record your login account and password, but you can use the recording function that comes with your browser.
Data
The "data" module is the basic function of Studio to manage the database, and it mainly has two functions:
-
Check the data and its organizational form, such as database table structure, data size, table creation statement, table field information, data preview, etc.
-
Add, delete and modify database objects, including new creation, deletion, and renaming of database objects.
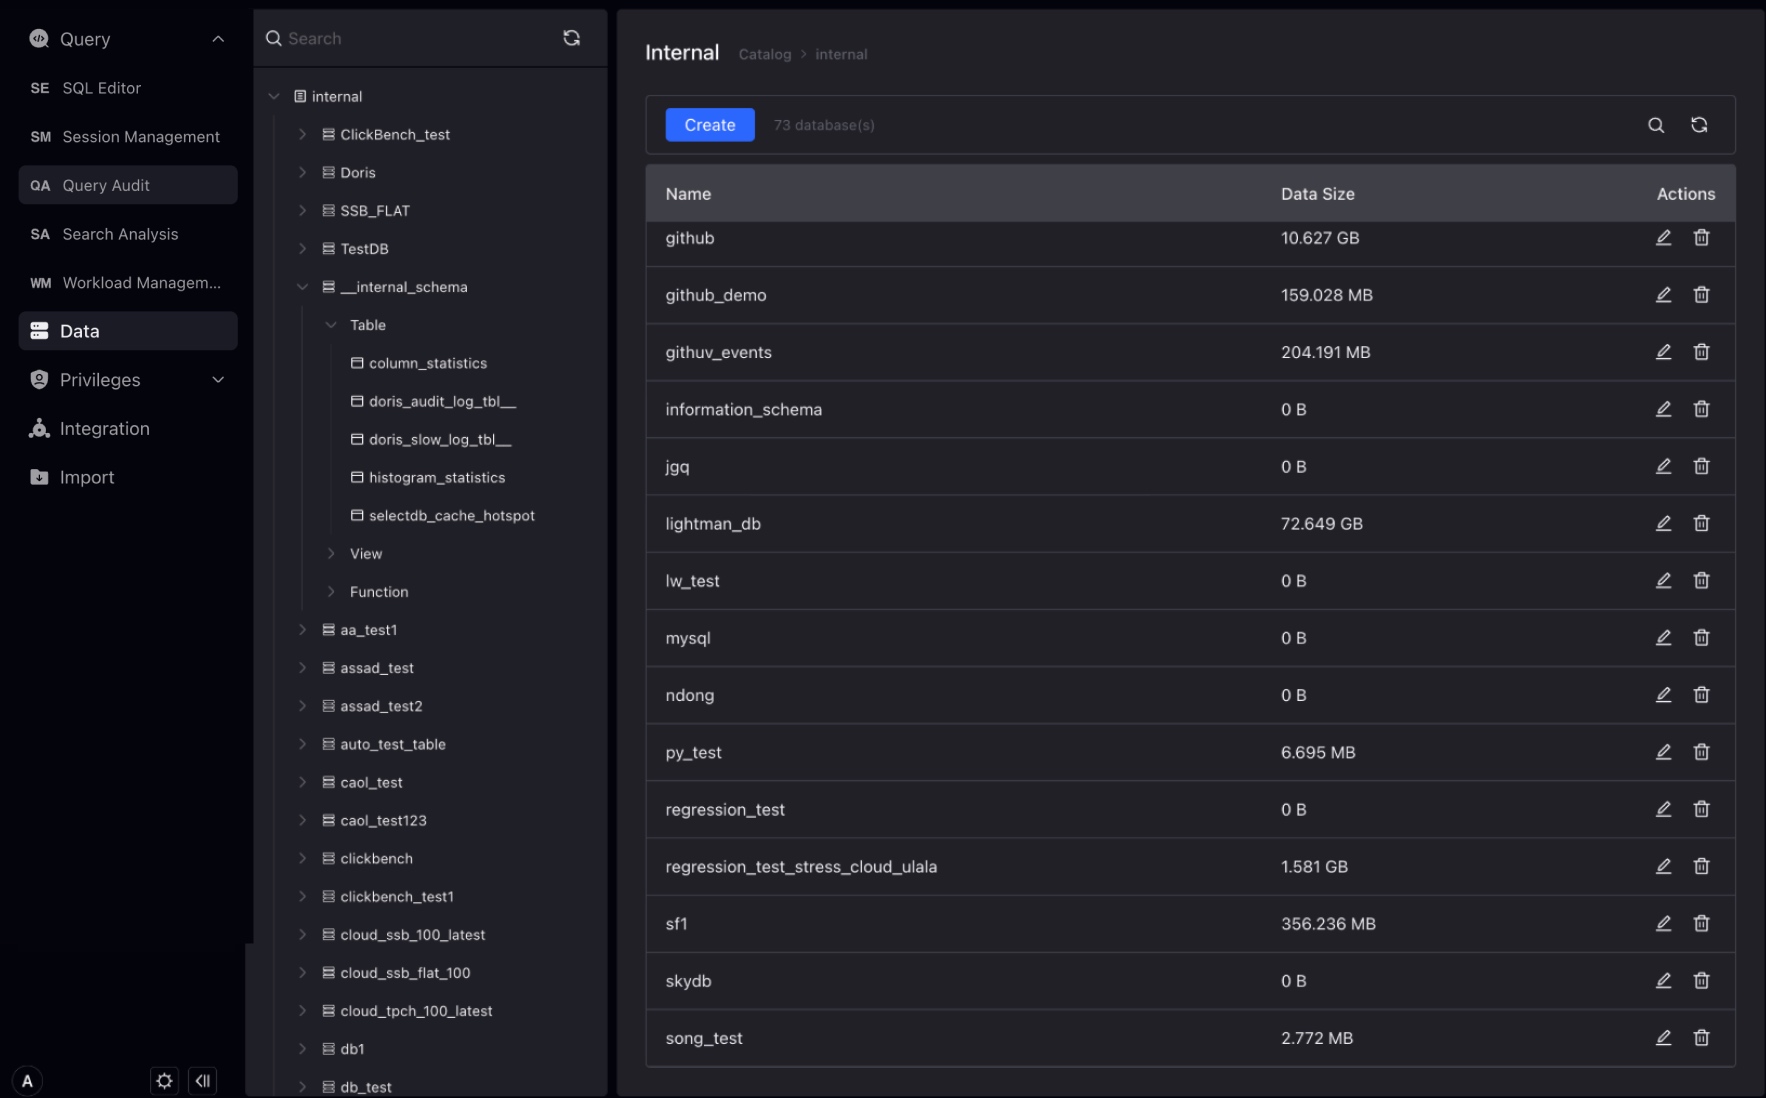
The data module is displayed according to the organizational form of the data in the database, and is divided into Catalog -Database -Table /View .
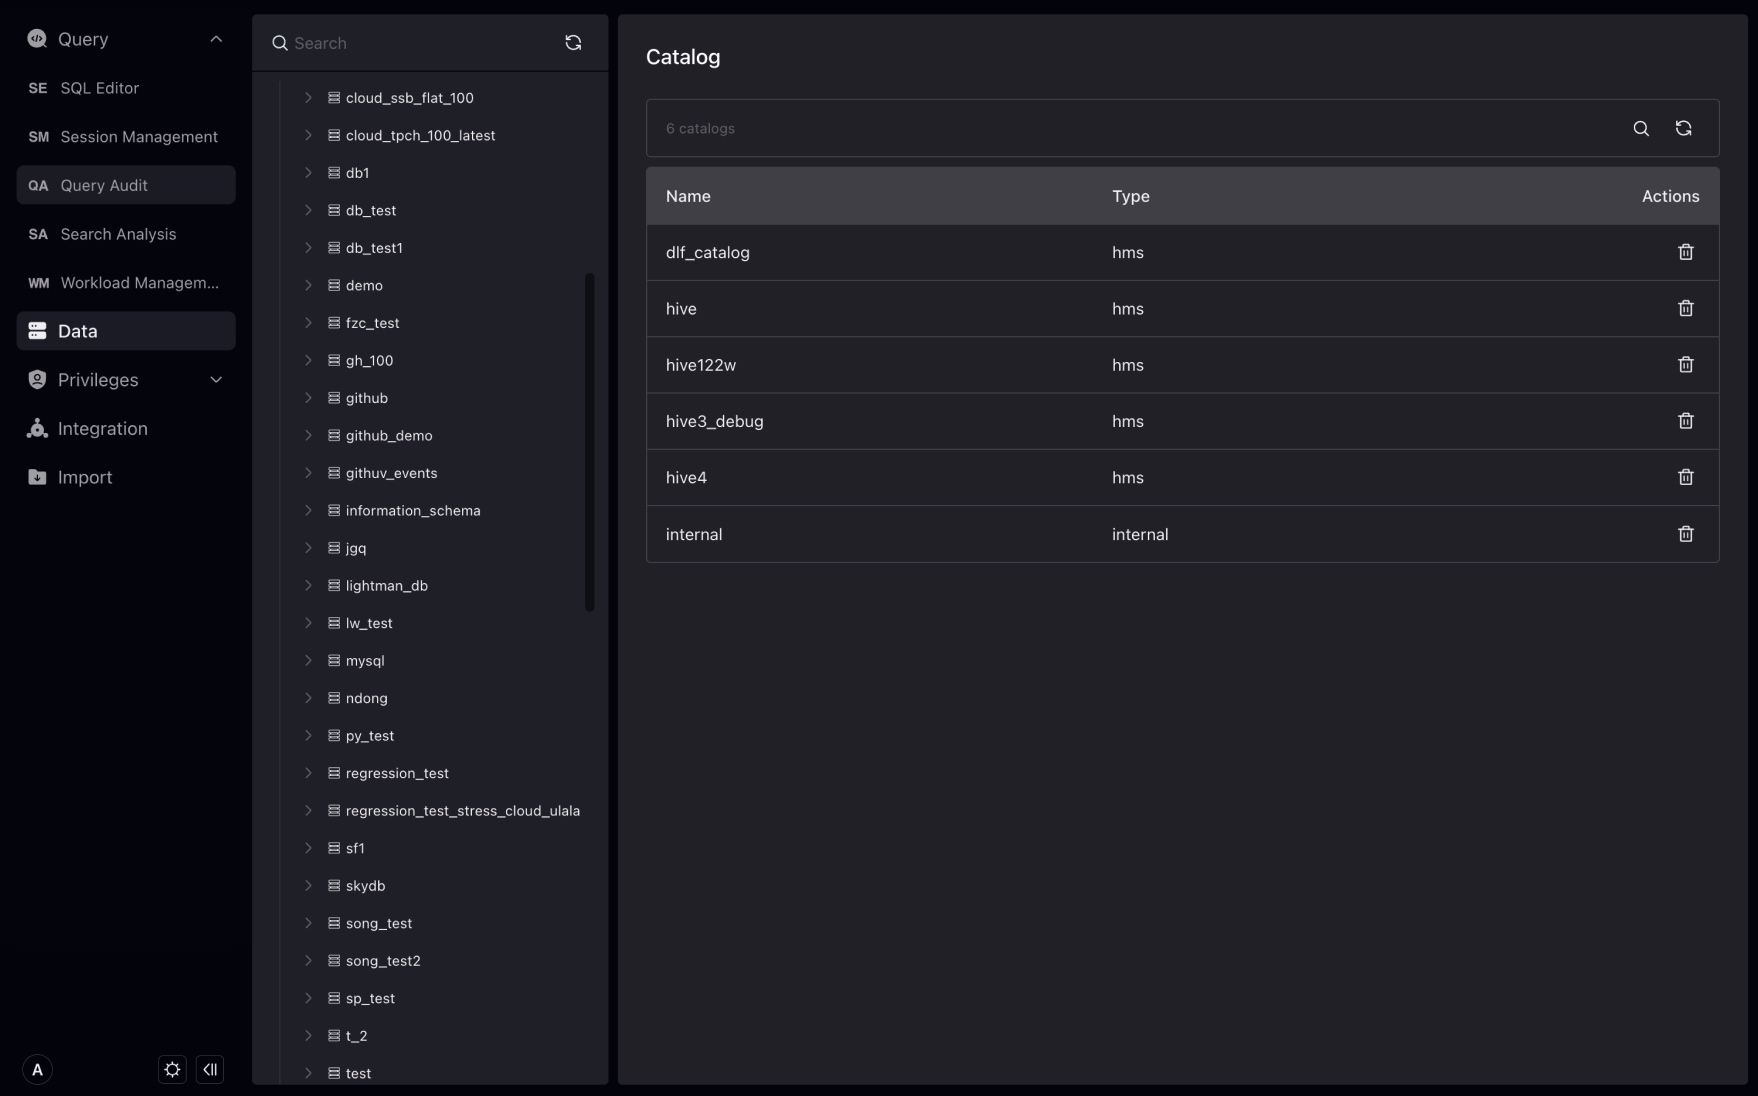
Catalog
Catalog is a collection of databases.
Catalog is divided into internal catalog and external catalog. Internal catalog contains VeloDB's own database, external directories can be connected to Hive, Iceberg, Hudi, etc., as VeloDB supports the data lake features. VeloDB Studio supports direct deletion of Catalog objects.
Database
A database is a collection of tables, views, materialized views, and functions. The database belongs to the directory. When a directory is selected, you can view the database under the directory and the size of the database. At the same time, you can create, delete, and rename the database under the page.
Table
Table is the basic unit of VeloDB data warehouse, and table belongs to database.
When a database is selected, you can see the tables under the database, as well as the size of the table, creation and modification time.
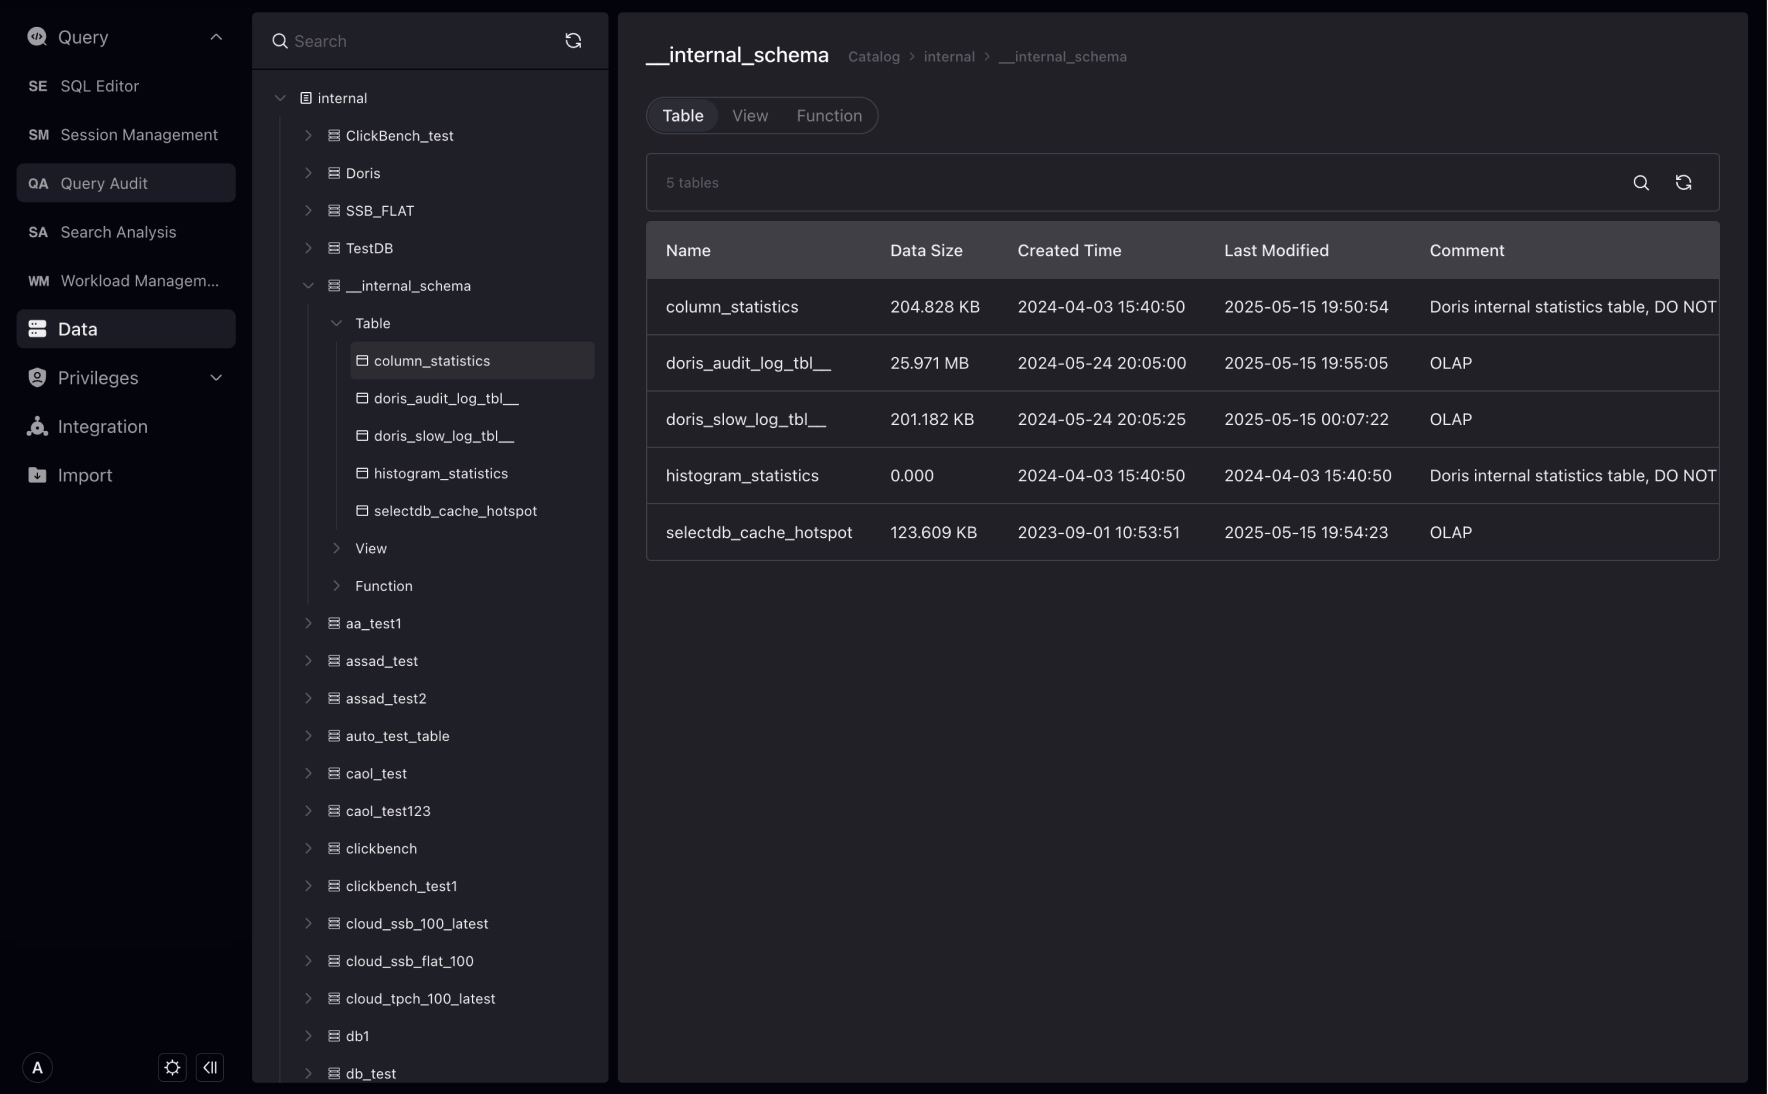
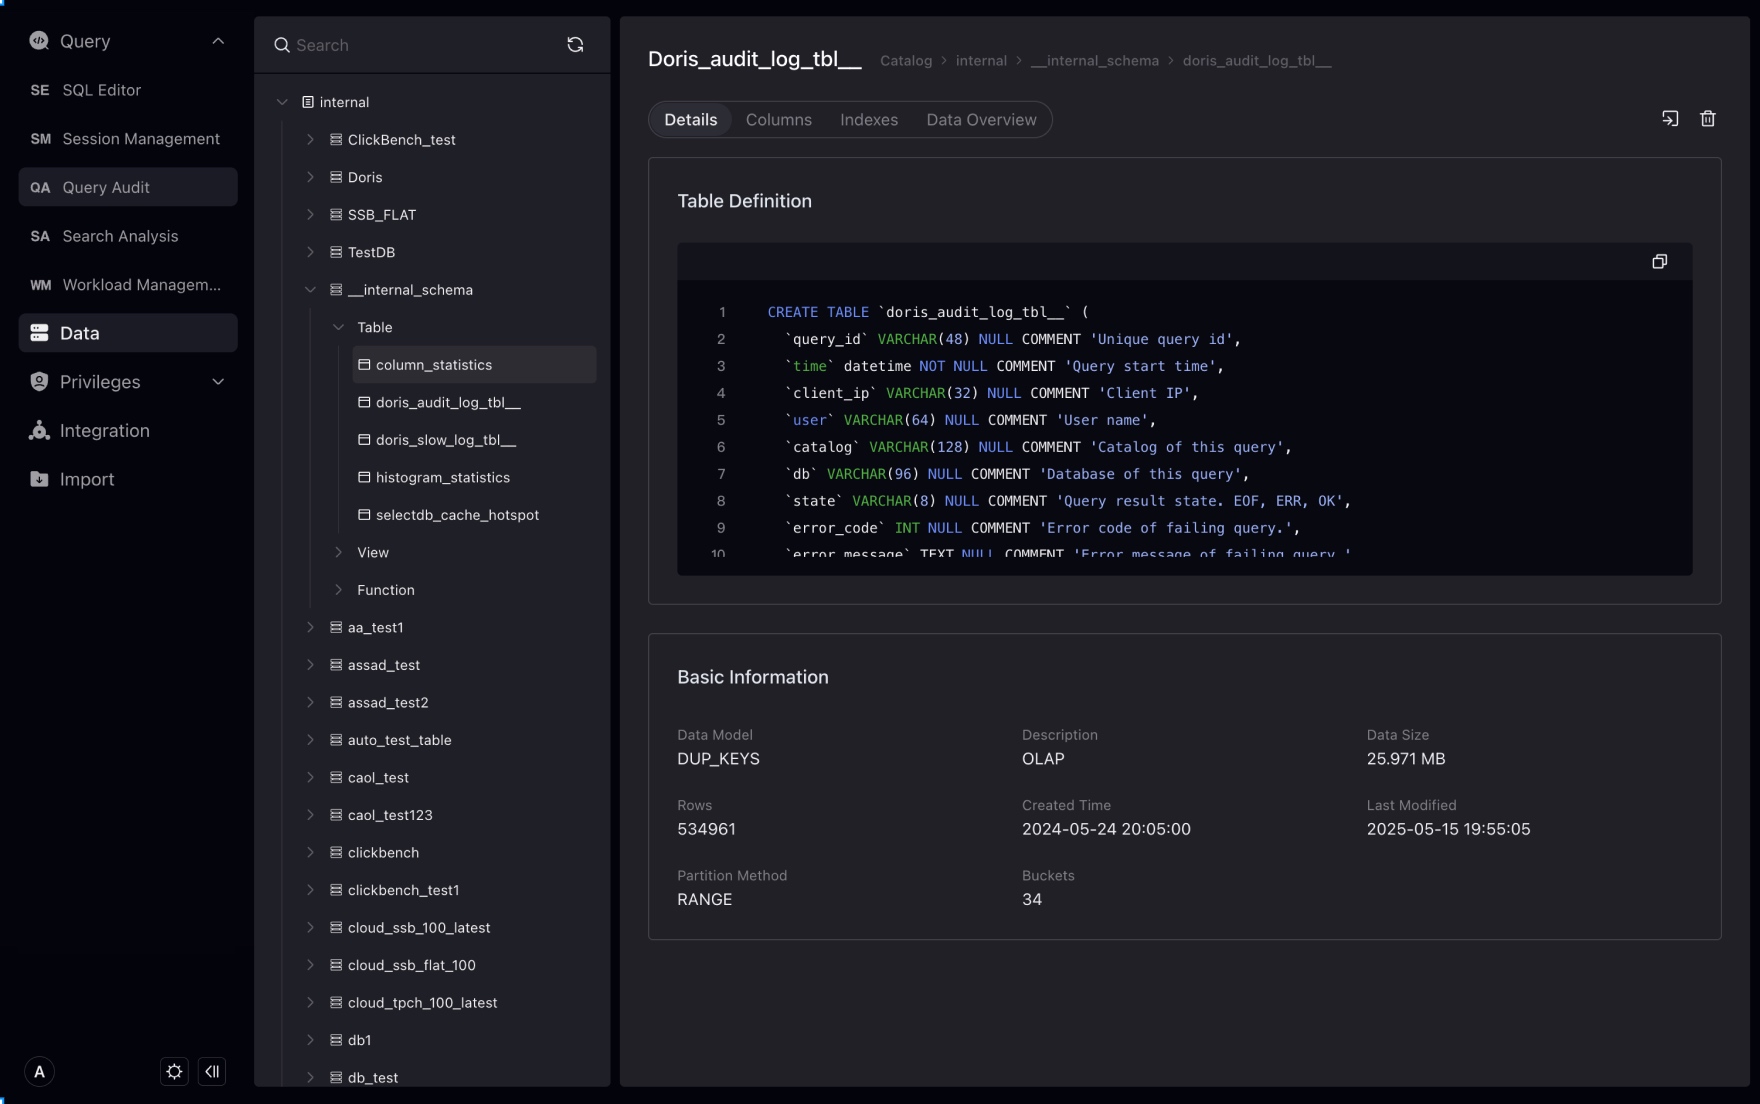
When you click on a table, you can enter the details management page of the table and view the DDL definition, fields, index and other information of the table.
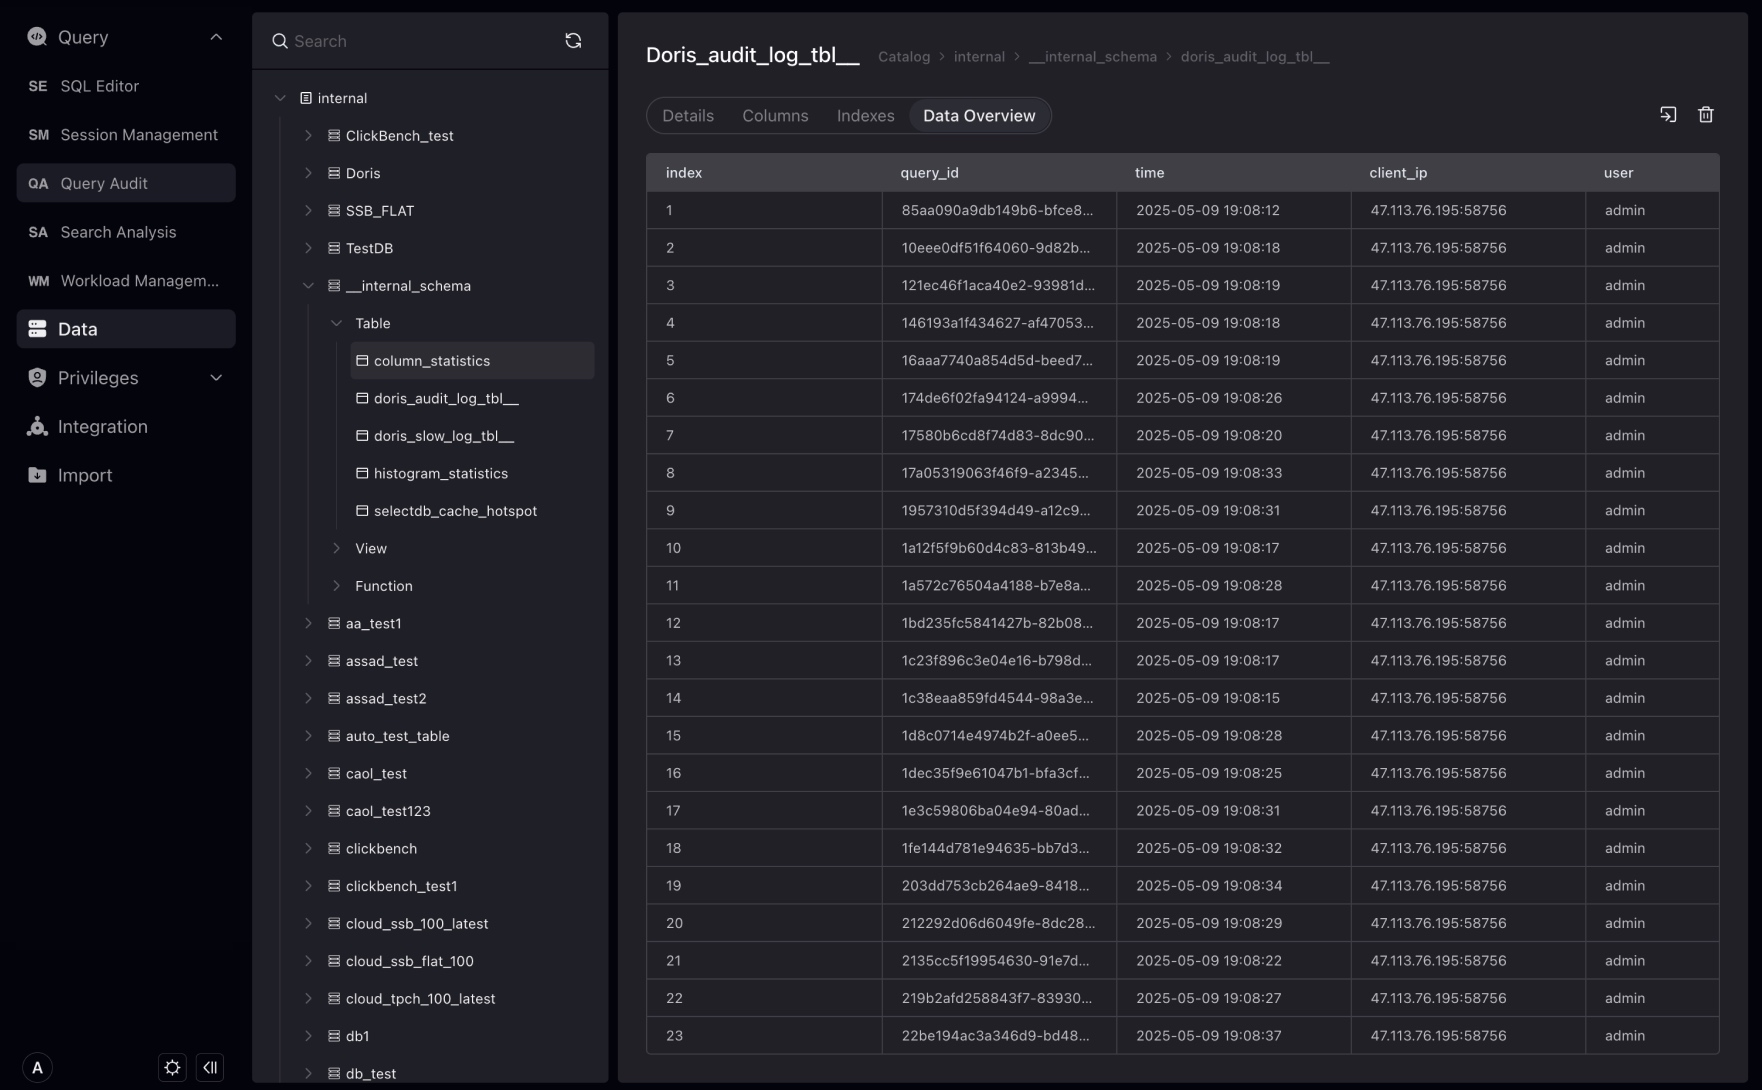
The Data Preview page is used to quickly preview the data data of the table, and by default preview of the first 100 pieces of data of the table from the interface. "Total x data" is obtained from the metadata service, so there may be delays.
View
A view is a visual table based on the result set of SQL statements. The view page is roughly similar to the table page. Attributes (such as indexes, details) that the view does not have will not be displayed. The view also supports data preview function (the first 100 pieces of data).
Materialized View
Materialized View is a table that pre-calculates query results and stores, which can be used to accelerate query performance and reduce real-time computing pressure. The Studio database page can list the materialized view information under the database.
Function
The Studio database page can list the function information under the database, and supports viewing the function type, return type, creation statement and other information.
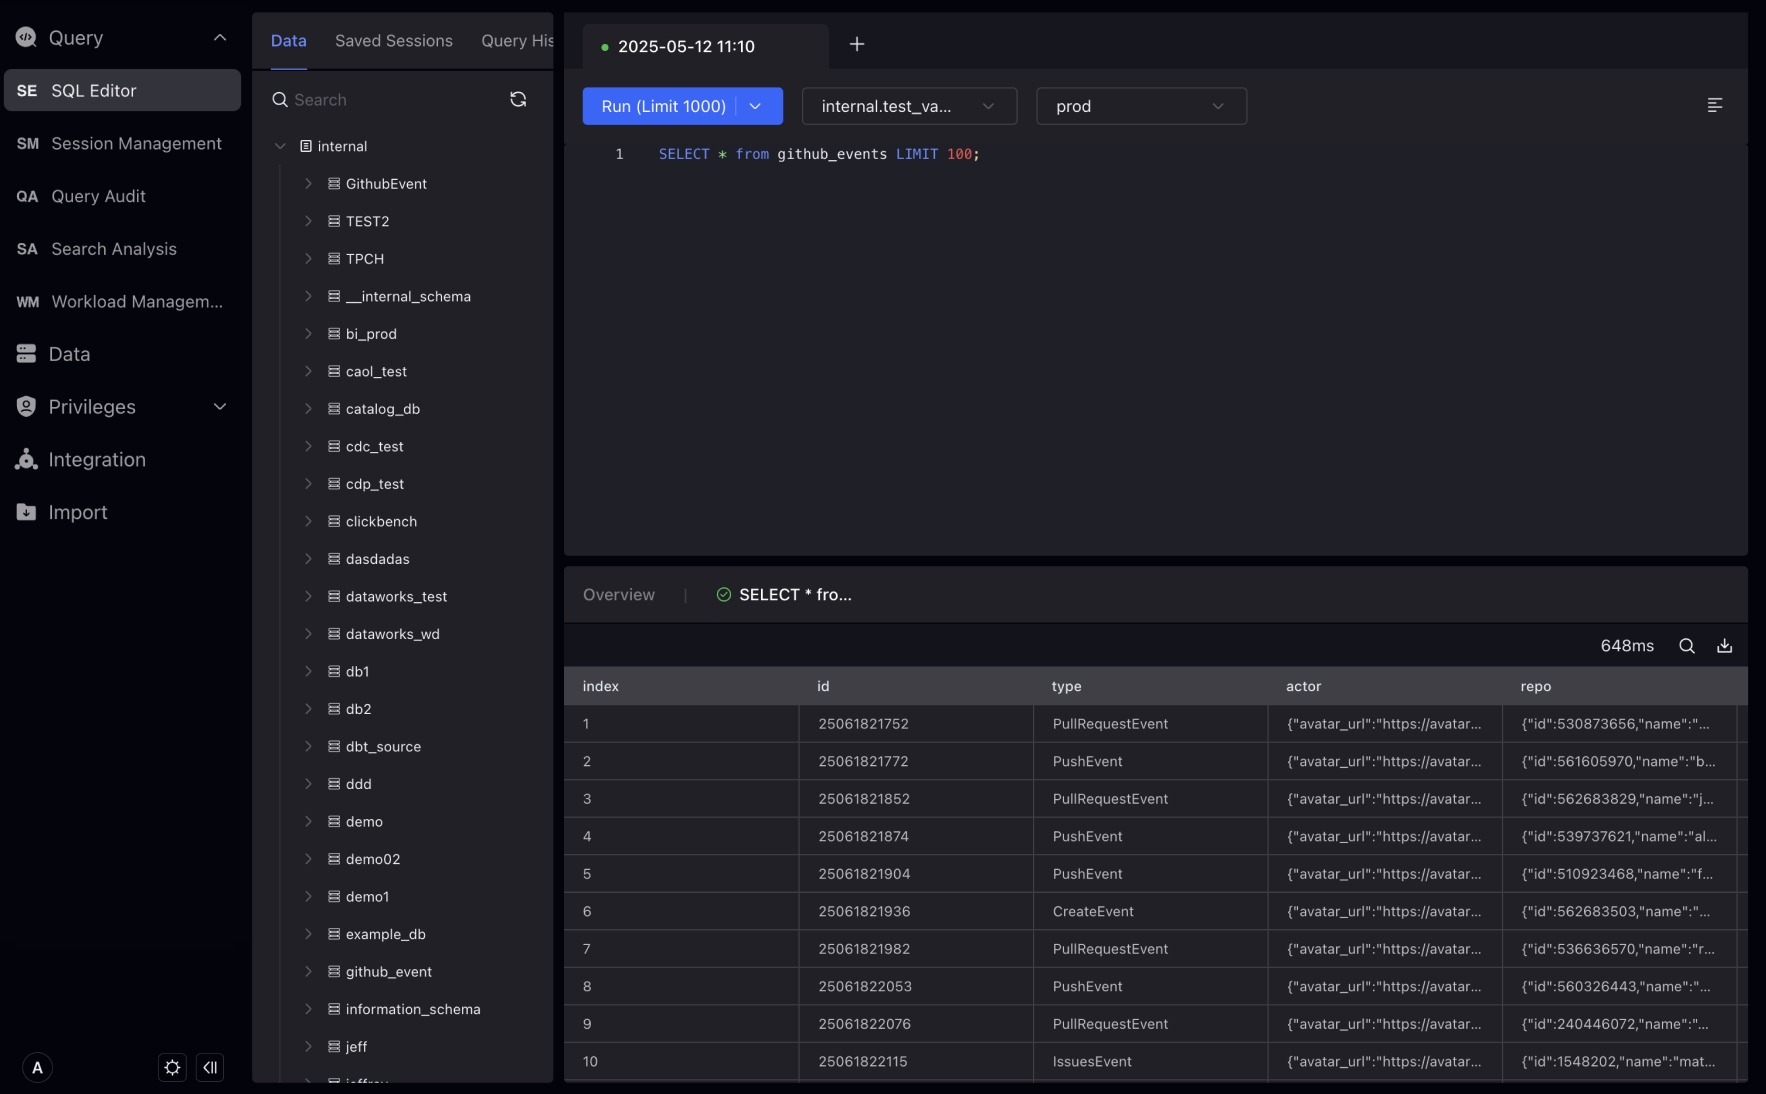
SQL Editor
The query result will be returned below the edit box, and the error or success status and information returned by the query will also be displayed at the query result.
At the same time, you can click the drop-down button on the right side of Run (LIMIT 1000) and switch to Run and Download to download your query results.
Session records are the history of the Tab you open in the SQL Editor. You can click on the SQL statement in the record and copy it to the SQL Editor for execution.
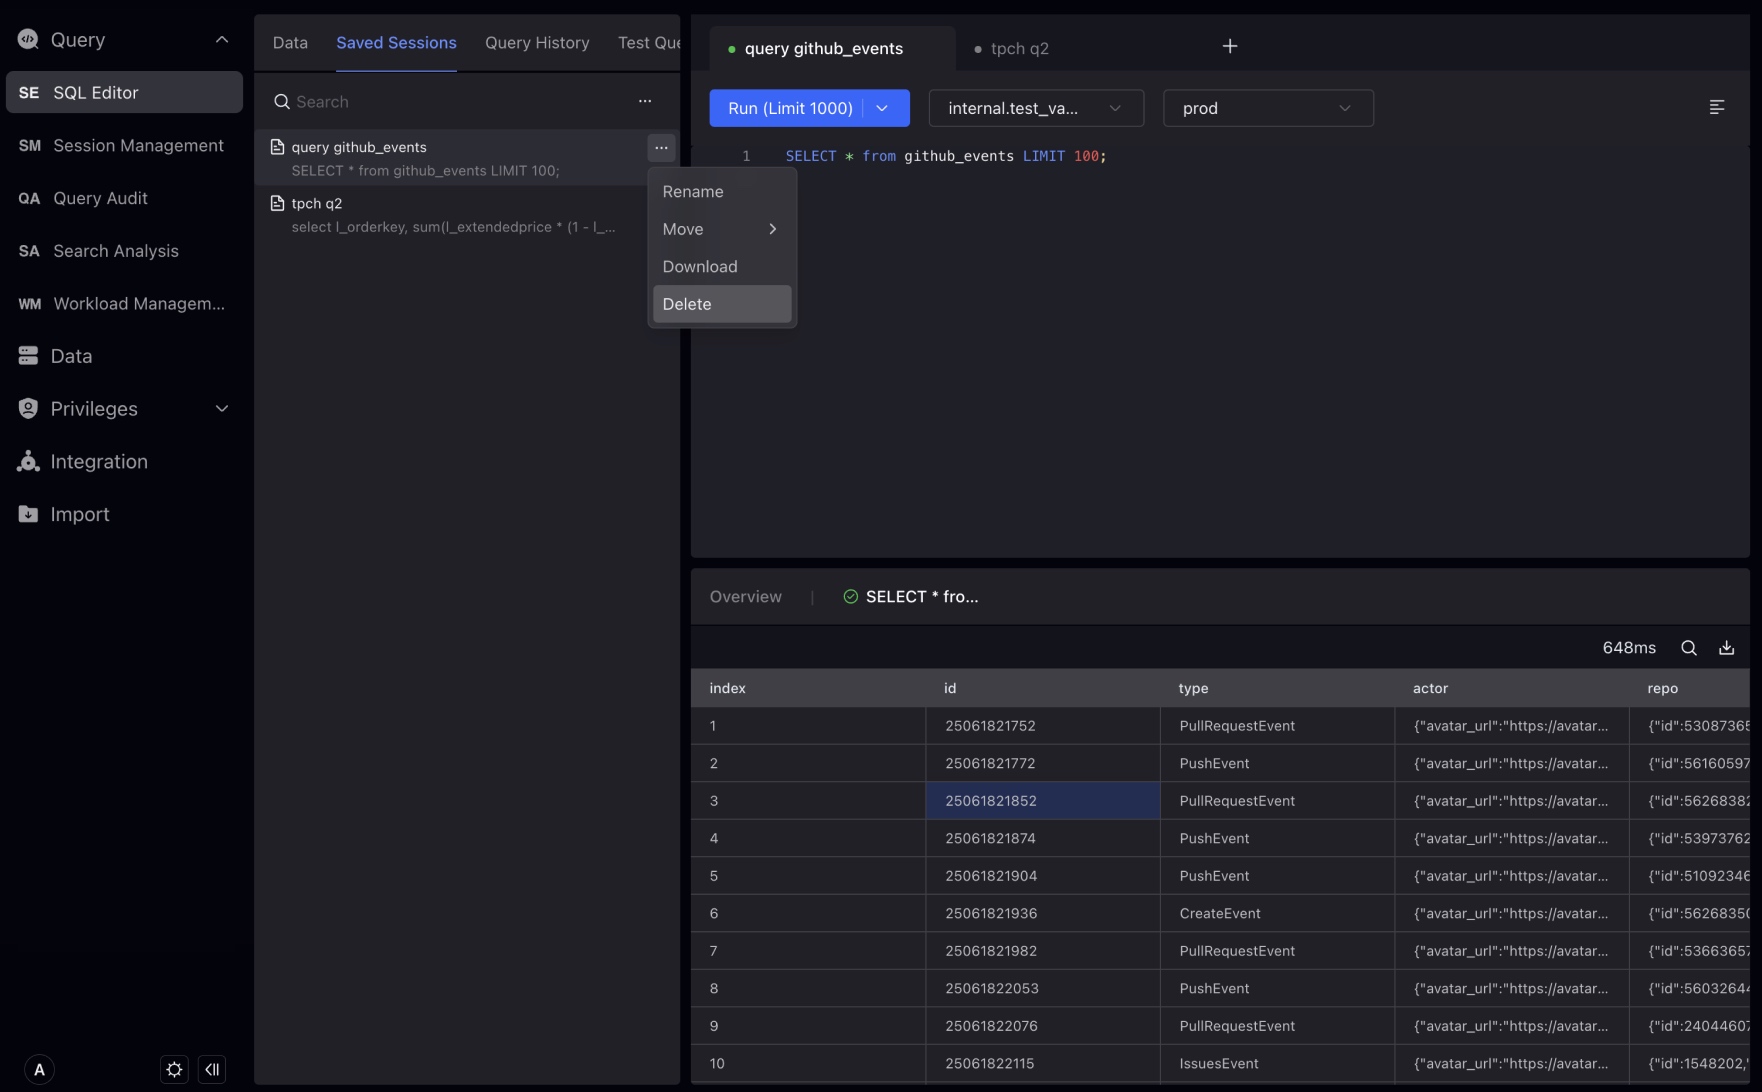
Query history is the history of the SQL statement you execute in the SQL editor. You can click on the SQL statement in the record to view the Profile information of the statement.
NOTE There is no Query ID for non-query statements, nor for failed statements.

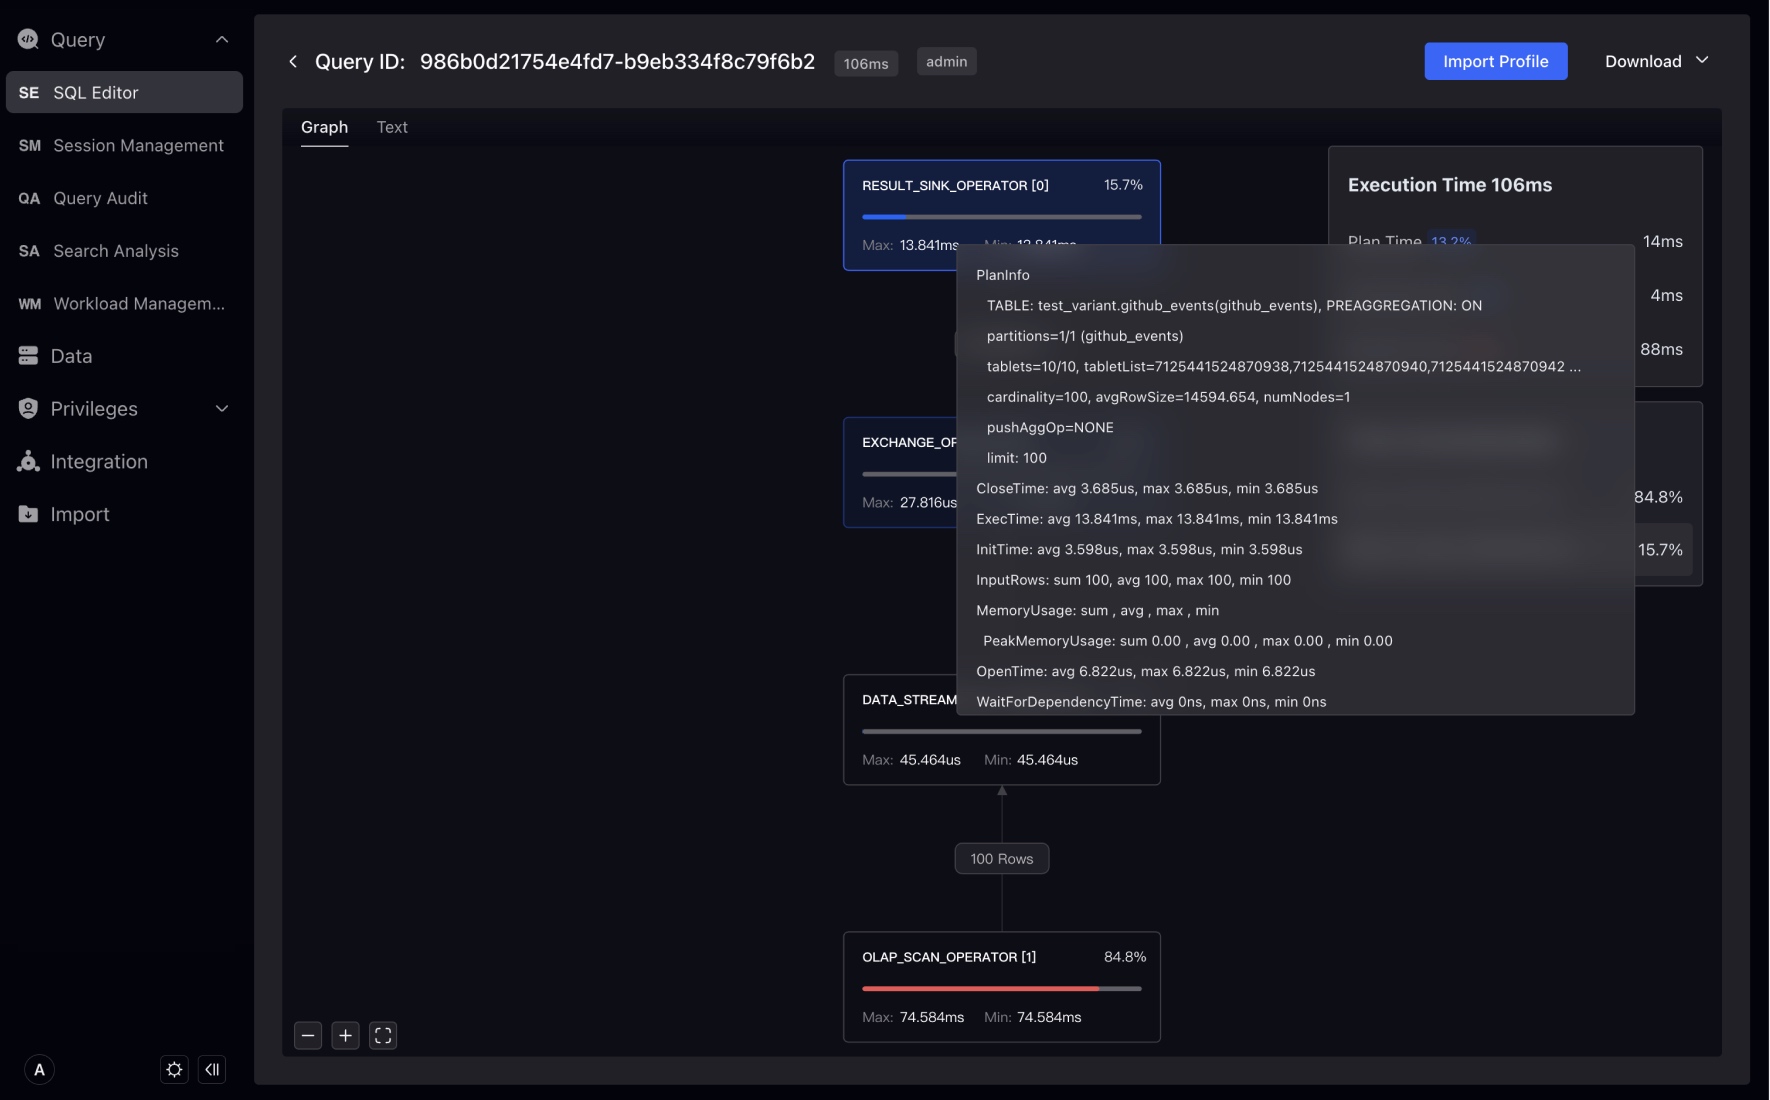
By default, query plans are enabled for queries initiated in the Studio, which will not affect the performance of a single query. Click "Query Statement" to enter the execution plan page.
The download button can download Profile information, including Profile information in pure TEXT format and visual Profile images.
The Import Profile button can import Profile information in the TEXT format, and after importing, you can visually view the Profile. This helps you visually analyze queries initiated from other clients.
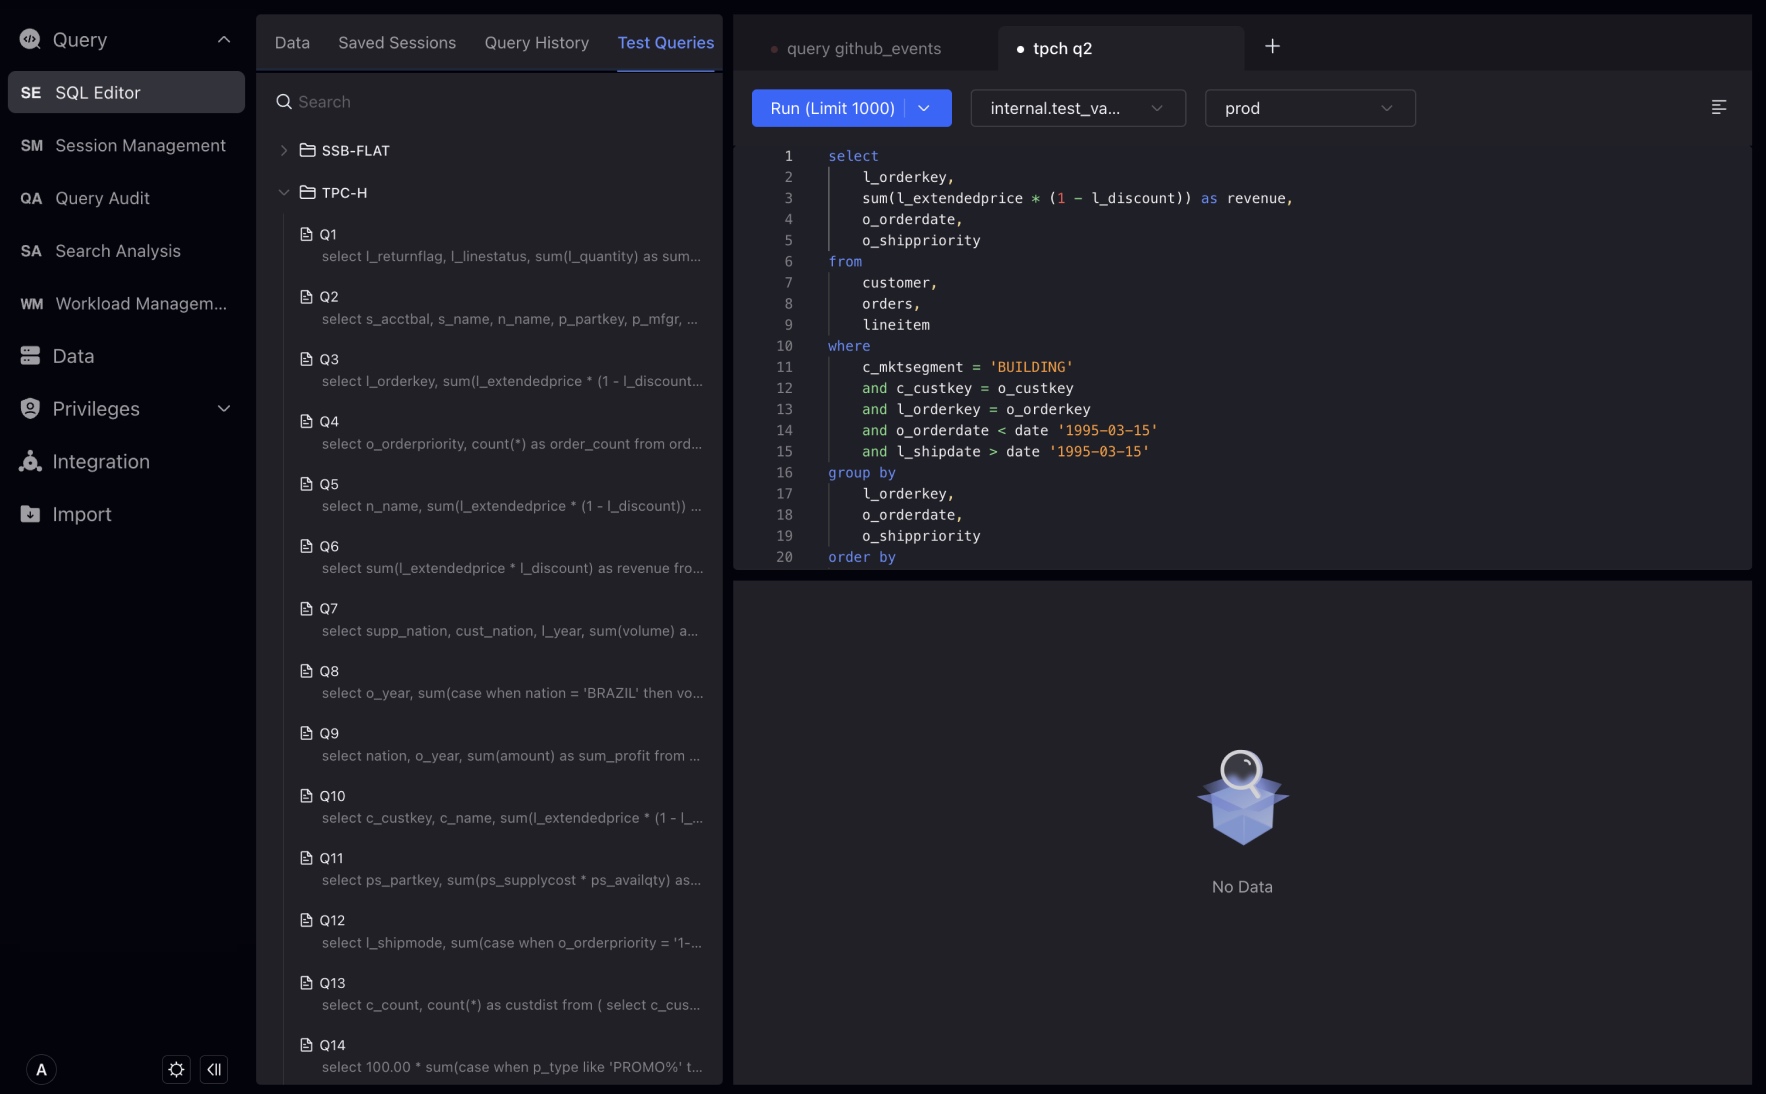
We have built-in sample query statements for some test datasets in Studio to help you do some simple performance testing.
In the results panel, you can see the execution results of SQL statements, including query results, execution time, number of rows, etc. You can also search for results through the search box, or click the table header to sort the results.
Session Management
Session management allows administrator users to manage the use of resources and prioritize critical queries to improve system performance and provides detailed information about each session, such as execution time, the user who initiated the query, and the resources being used.
You can view all currently running SQL queries and terminate any queries that cause problems or run time exceeds expectations.
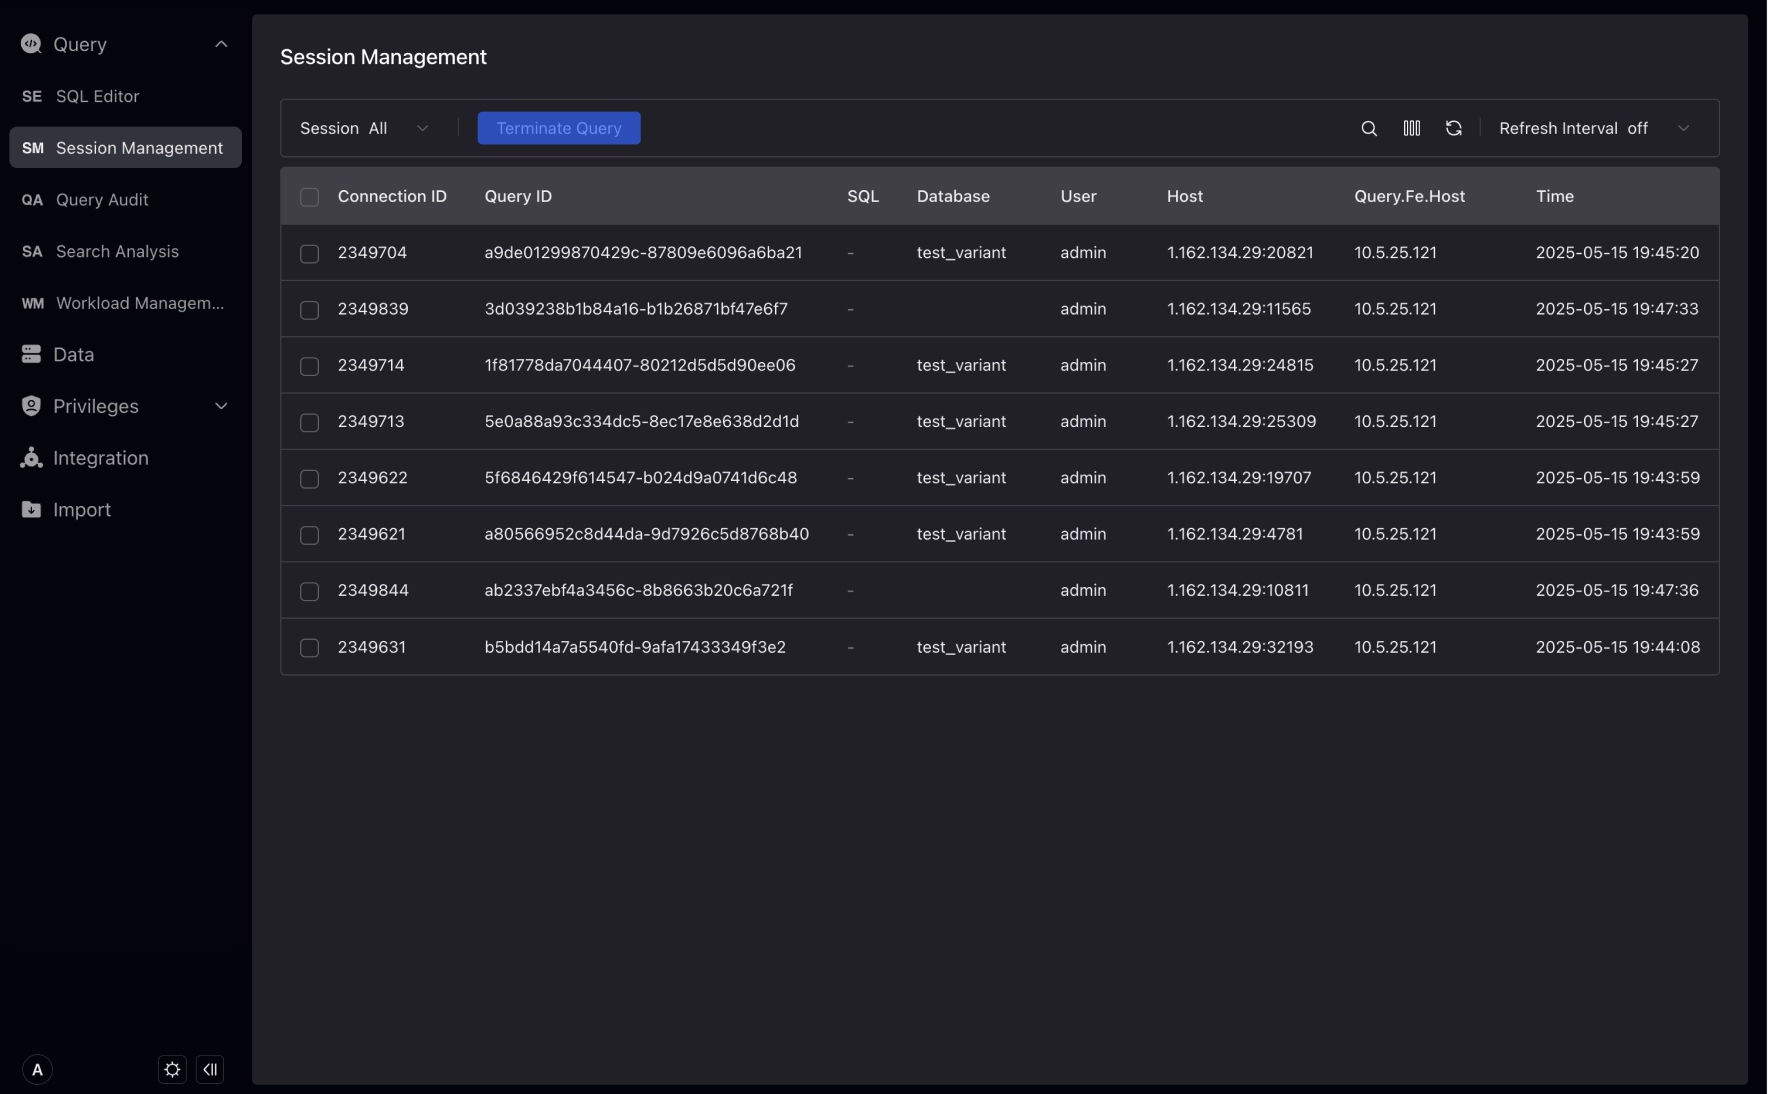
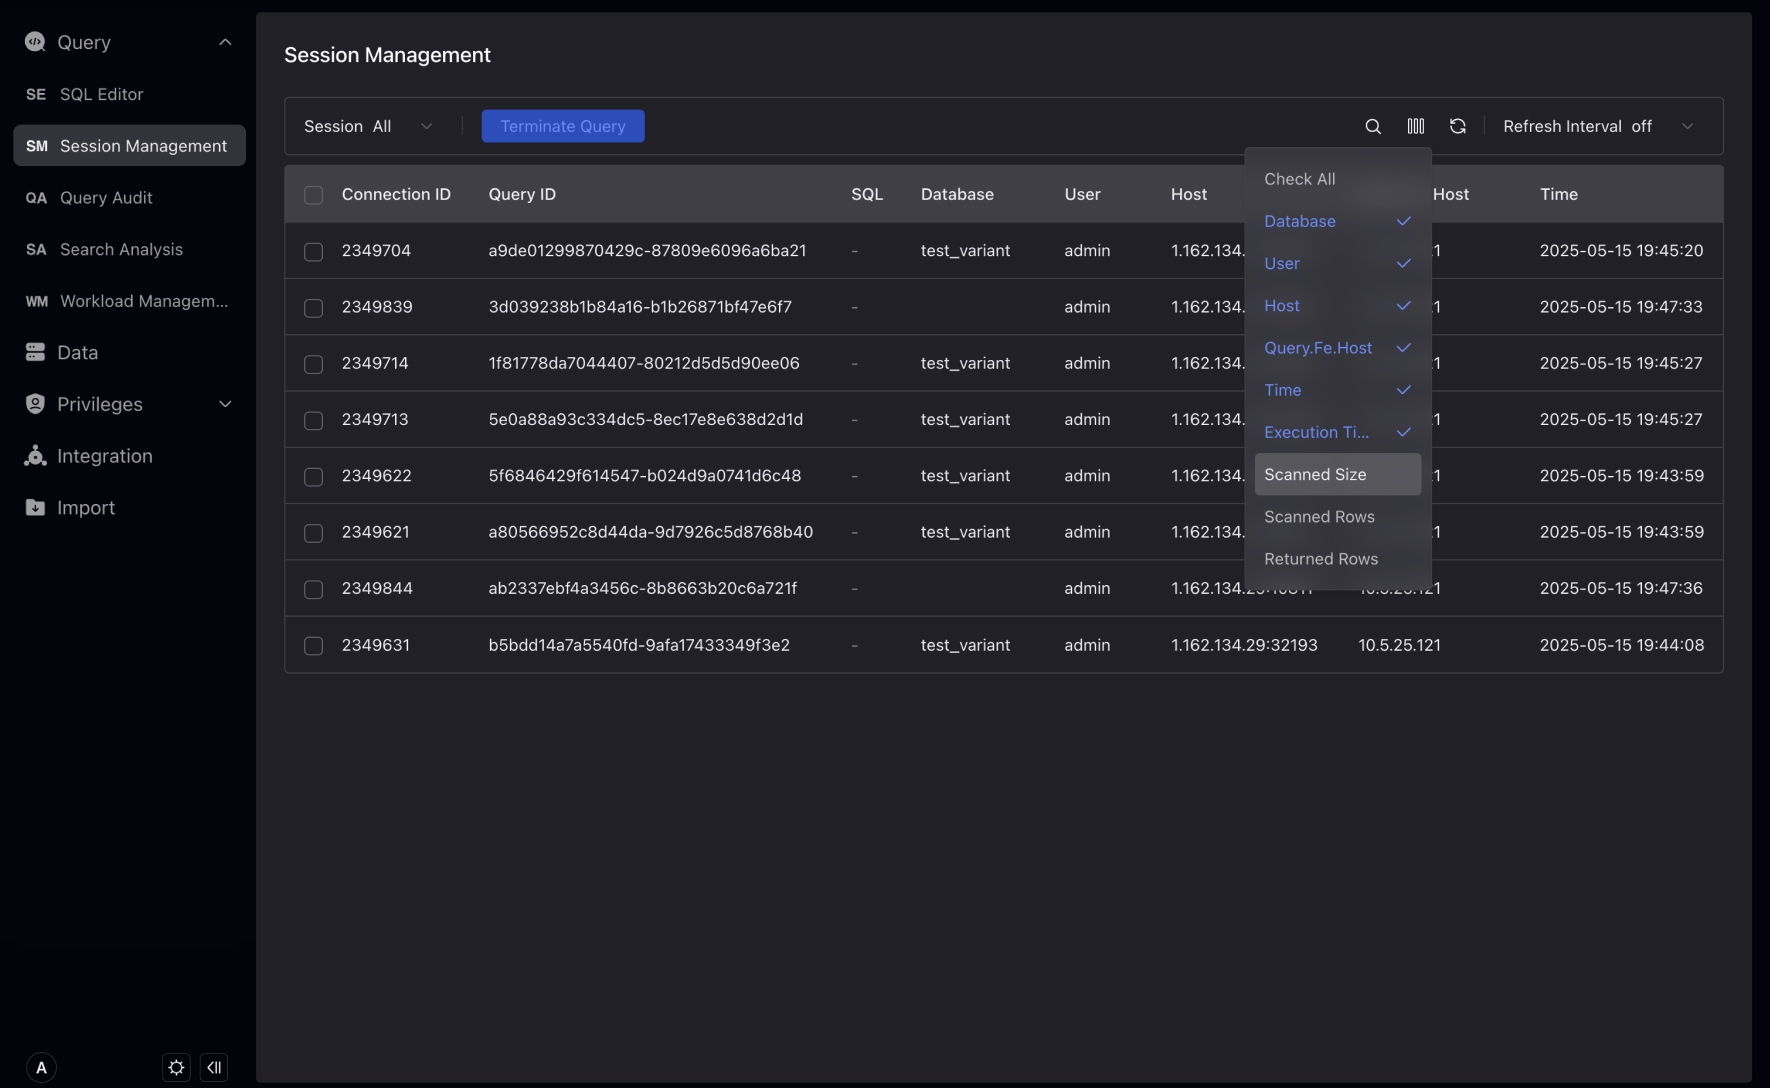
You can check the table to display more information about running SQL queries, such as scan size, scan number of rows, return number of rows, etc.
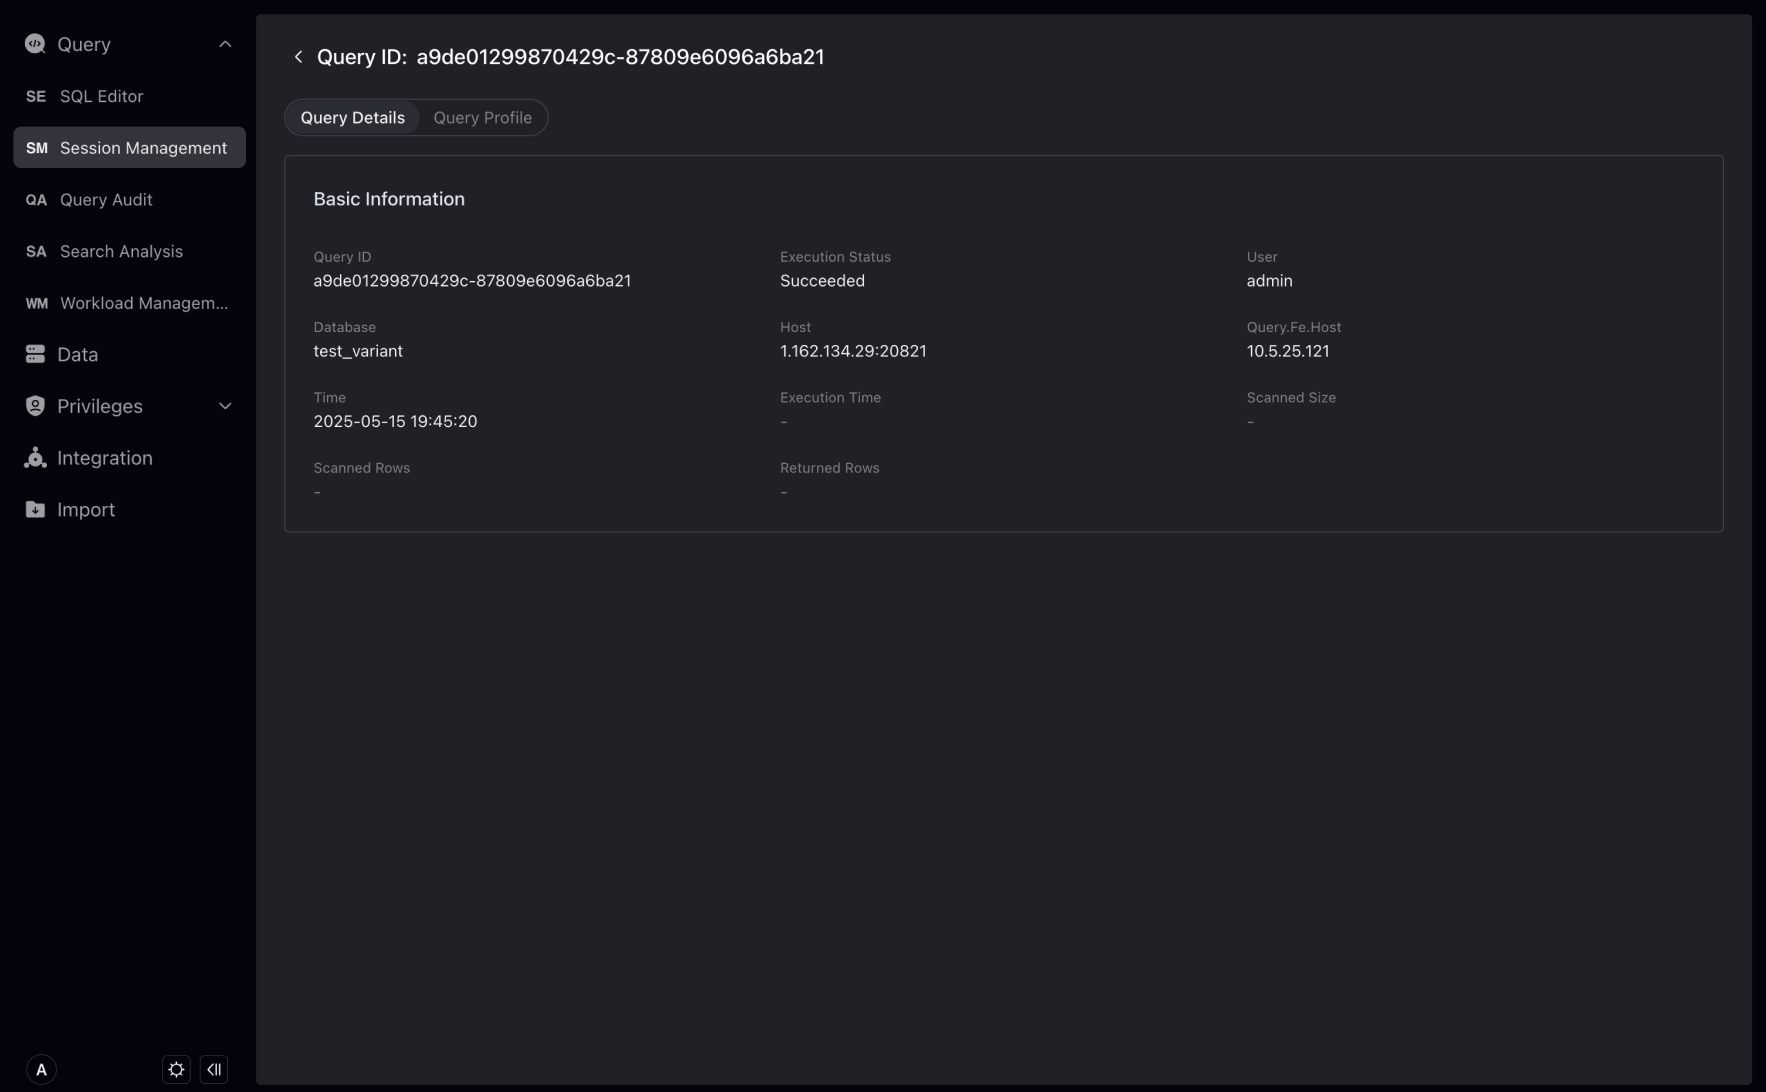
Click the Query ID of the session to further view the complete information of the session, including the executing user, the FE node that received the session, and the execution plan (Profile) of the SQL.
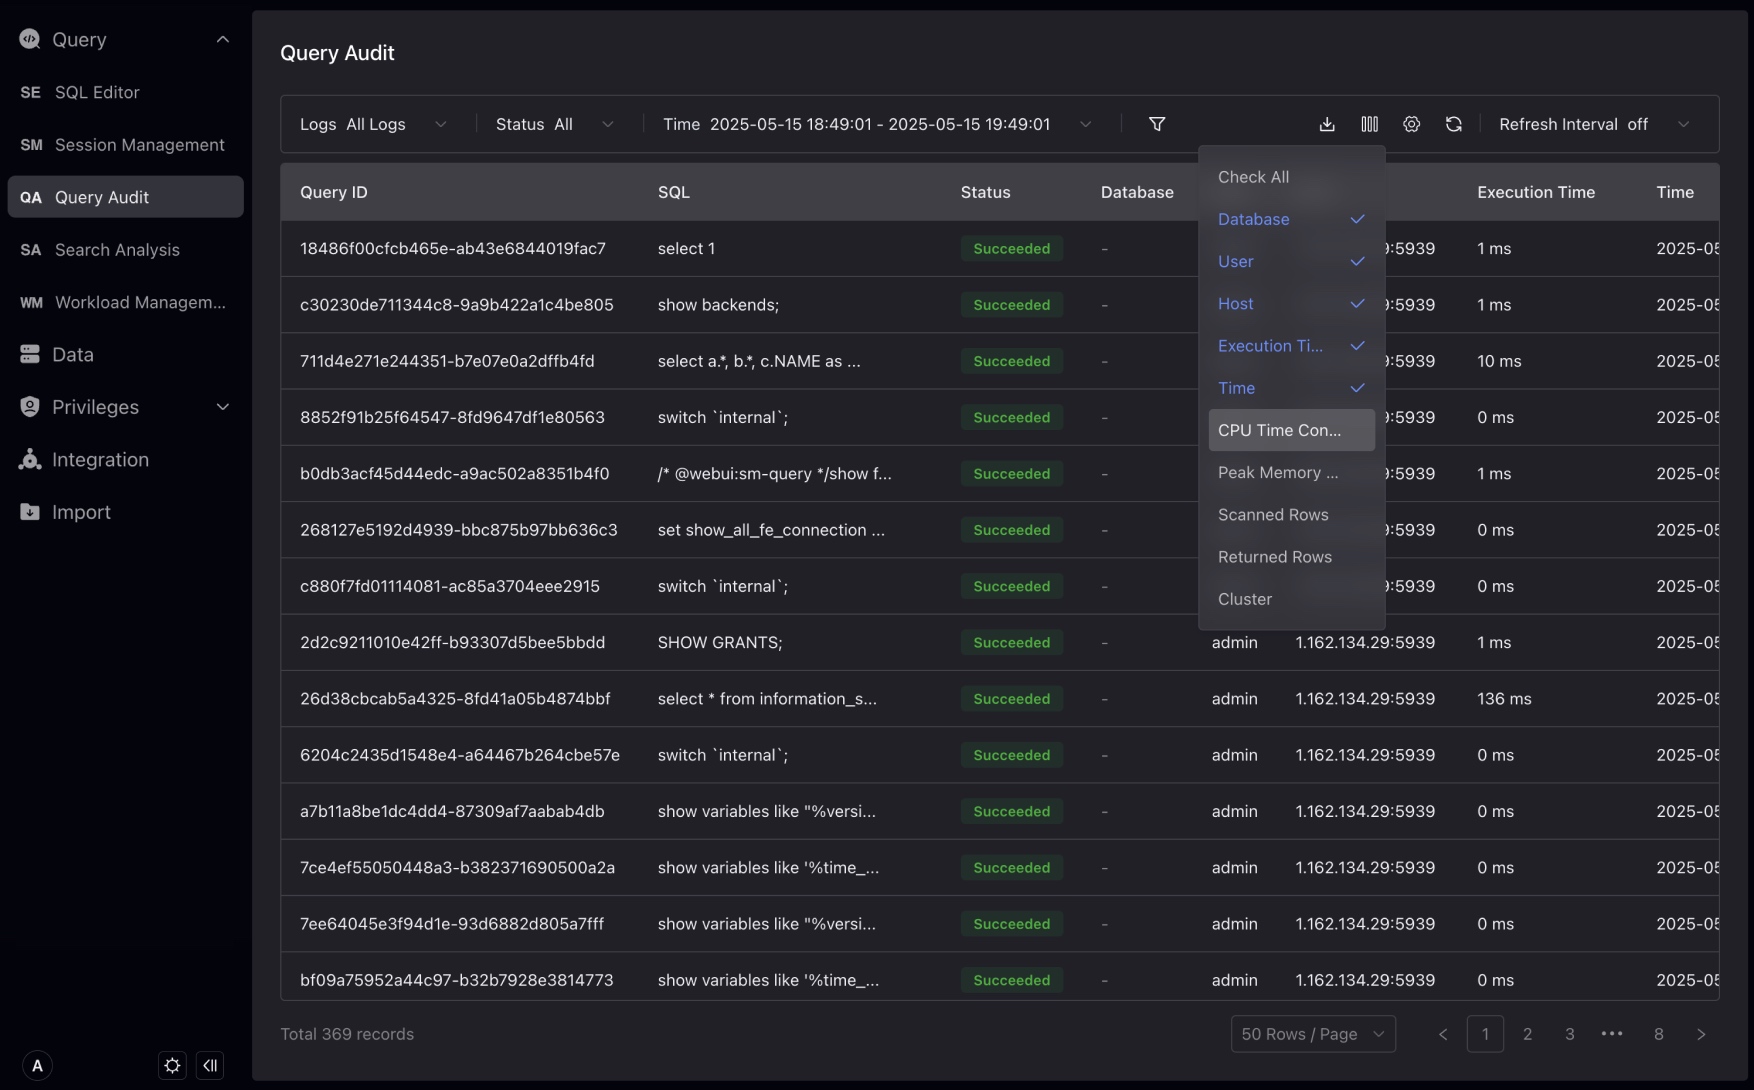
Query Audit
Query audits are used to audit and analyze query history executed in the system. It allows you to filter and identify poor performance queries to optimize database performance.
The tool includes analytics to gain insight into the execution plan and resource usage of each query. As a one-stop solution for tracking query performance, discovering trends, and diagnosing problems.
You can filter historical queries and in List Selection, select more dimensions to assist in analysis.
Click "Query ID" to enter the query detailed page. You can view more Query information. If Profile is enabled, you can view the query profile on this page.
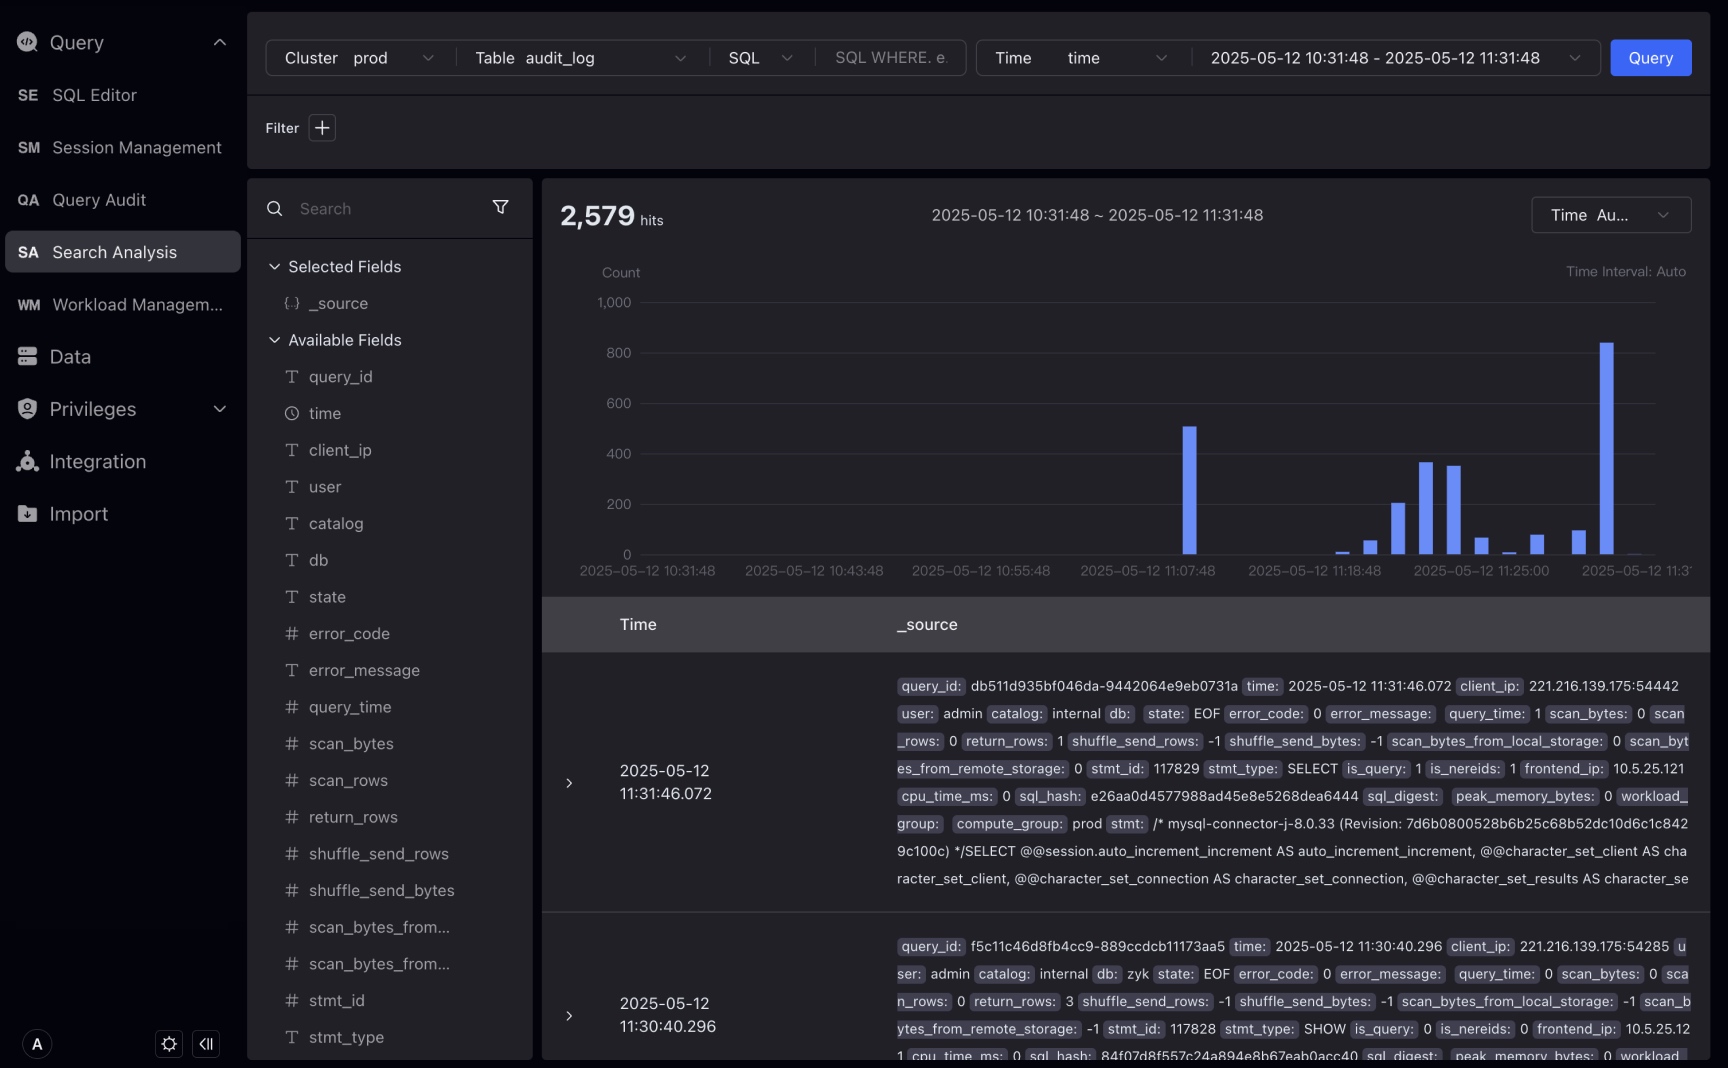
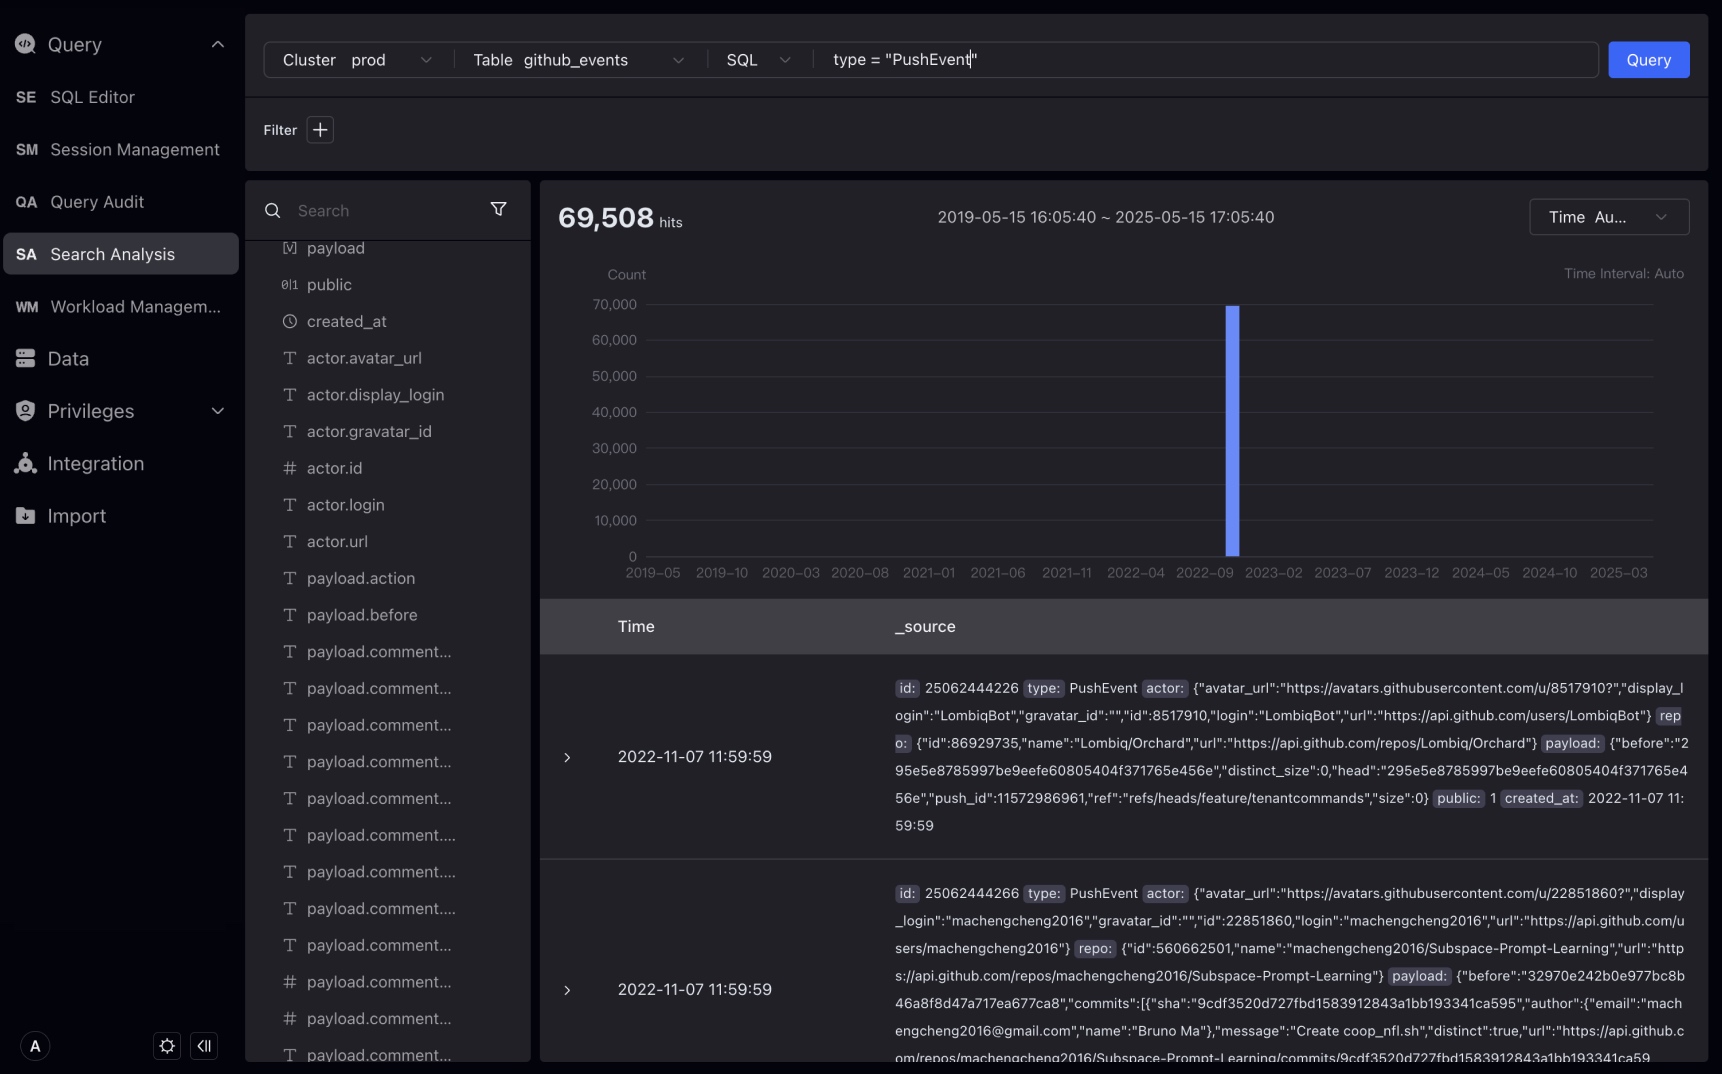
Search Analysis
Search and analysis is launched by VeloDB Studio. It is a query tool for log analysis scenarios, which can easily search, query and count logs.
The interactive search and analysis interface is similar to the Kibana Discover page, which optimizes in-depth experience for log retrieval and is divided into 4 areas:
-
Input area at the top : Select the cluster, table, time field, and query time period. The main input box supports two modes: keyword retrieval and SQL.
-
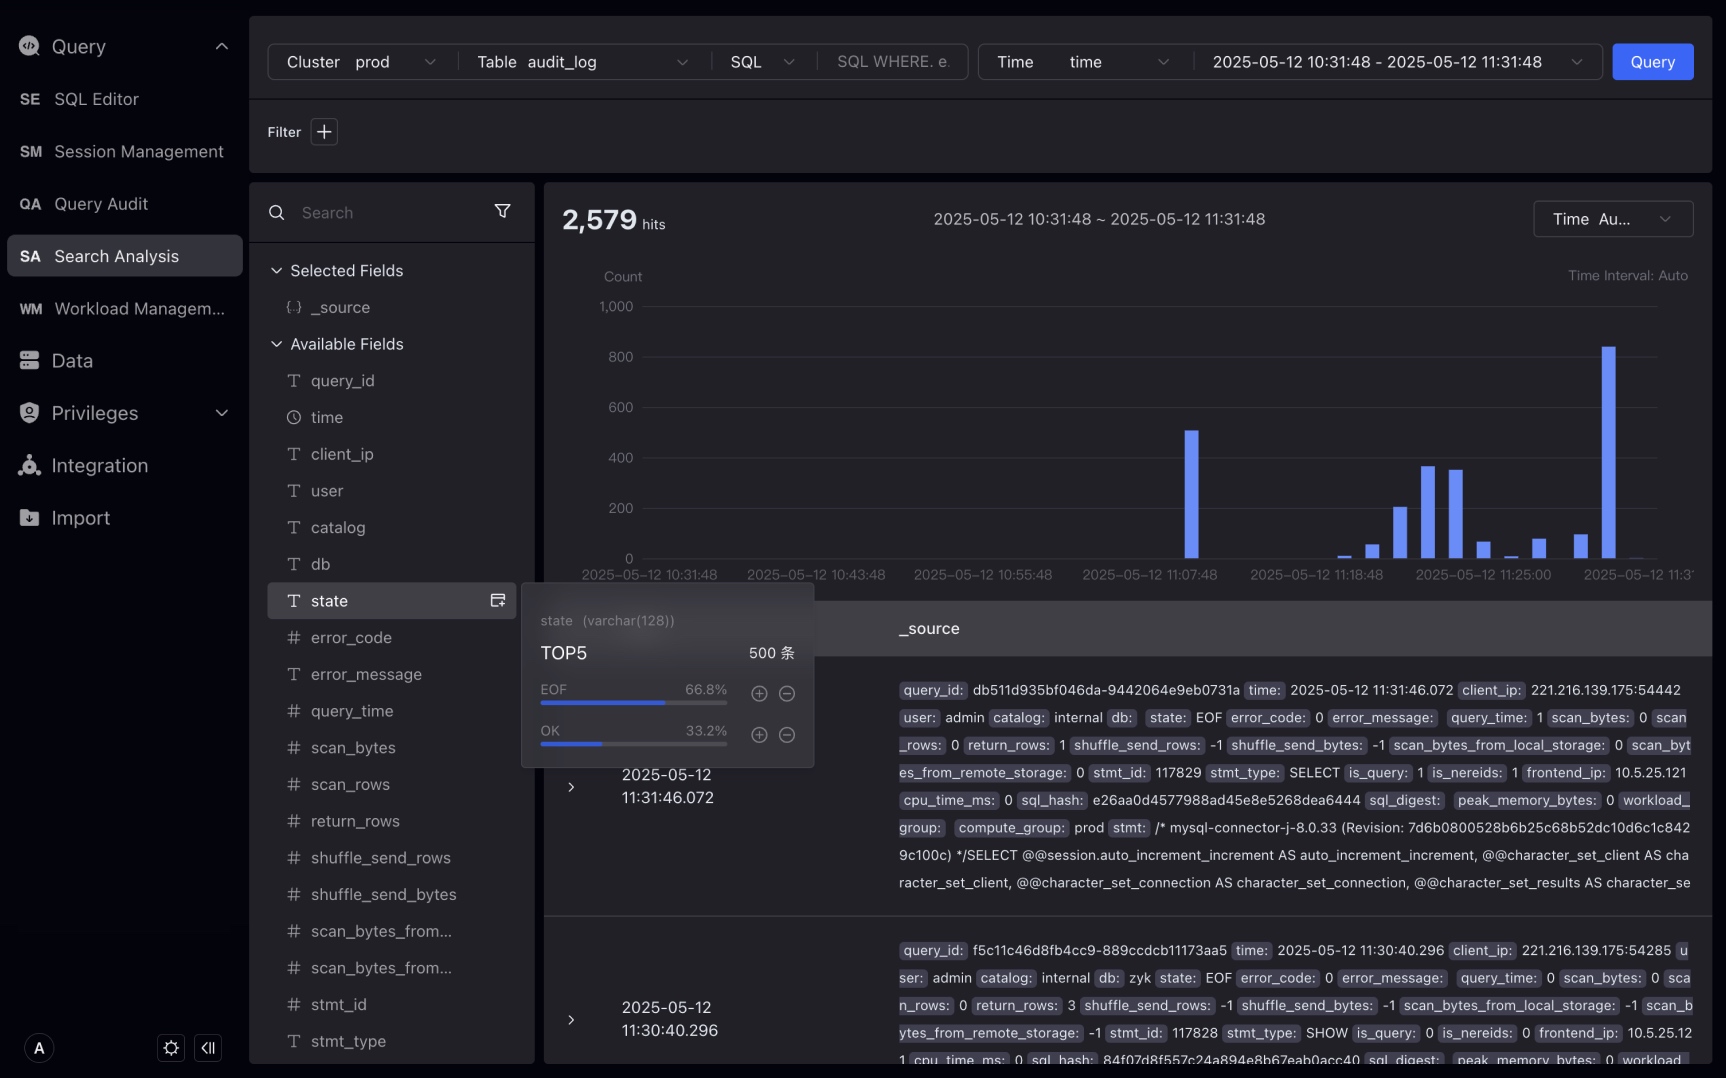
The field display and selection area on the left : Display all fields in the current table. You can select which fields are displayed in the detailed display area on the right. Hovering over the field will show the 5 values and the proportion of the occurrence of this field. You can further filter by value. The filtering conditions are reflected in the filtering part of the input area.
-
The trend chart display and interaction area in the middle : Display the number of logs that meet the conditions at a certain time interval. Users can select a period of time in the box on the trend chart to adjust the query time period.
-
Detailed data display and interaction area below :: Display log details, you can click to view the details of a certain log. It supports two formats: table and JSON. The table form also supports interactive creation of filter conditions.
Click Query > Search Analysis and select the table as internal_schema > audit_log, Studio will automatically query the fields in the table and select the first time field.
Hover over the state field on the left to display the highest frequency state values EOF, OK, ERR, and you can also view the proportion. In addition, you can also create filter conditions by clicking the plus sign (+) or minus sign (—) button, for example, by clicking the minus sign (—) button to the right of ERR, state != ERR is displayed in the filter conditions by clicking the minus sign (—) button to the right of ERR.
In the main input box, use search and SQL modes to query keywords.Search mode is supported only on tables with inverted indexes.
Under the search box, select Search, and then enter GET on the right, click Query. In search mode, search for a log containing the keyword GET. The GET in the details will be highlighted, and the number of data strips in the trend chart will change accordingly.
NOTE Searching for the MATCH_ANY statement that matches any keyword can match any field in the log. Note that the highlighting of the search results will match all search keywords as much as possible, but due to some special characters, it does not always match the search keywords exactly.
You can use double quotes to wrap phrases in searches, such as "GET /api/v1/user". Will match the entire phrase. The phrase uses MATCH_PHRASE to match the phrase.
If more precise matches are required, you can use SQL pattern.
Under the search box, select SQL, and in SQL mode, enter the SQL WHERE condition and click Query.
Expand log details, optionally in Table or JSON format, the Table format supports interactive creation of filters.

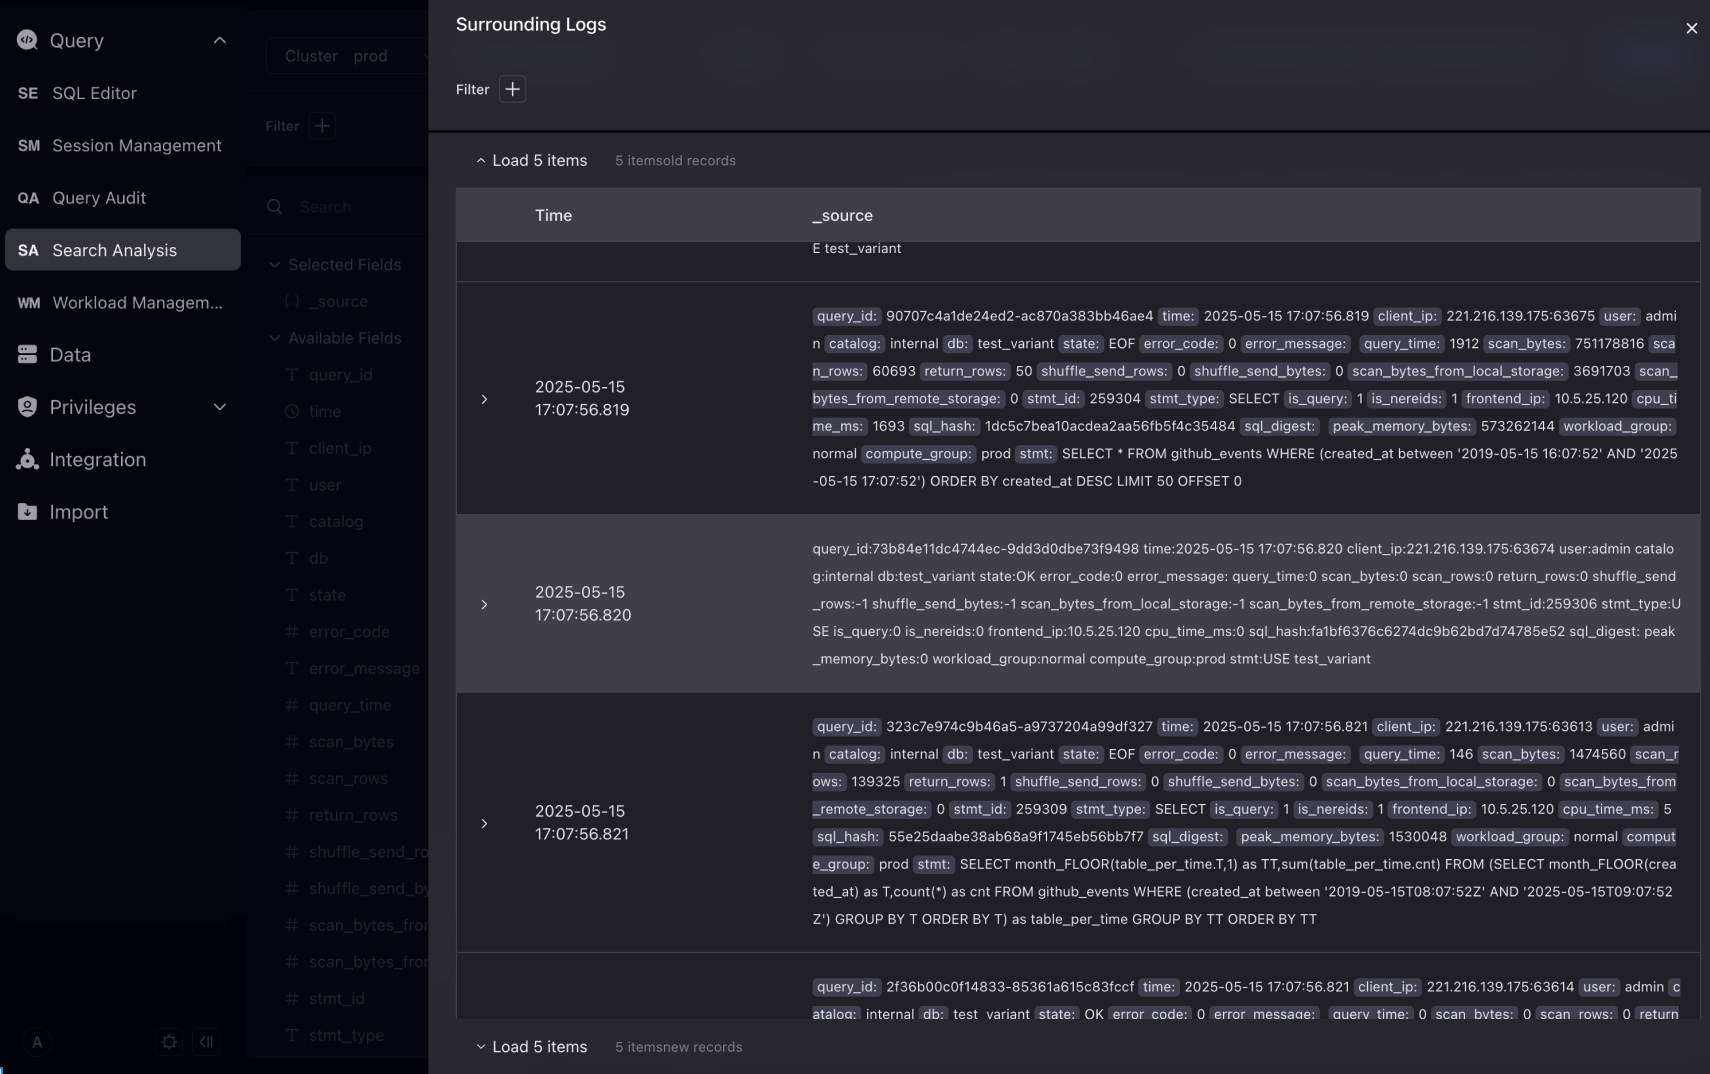
Click the context search on the right to view the 10 logs before and after this log. You can continue to add filter conditions in the context search.
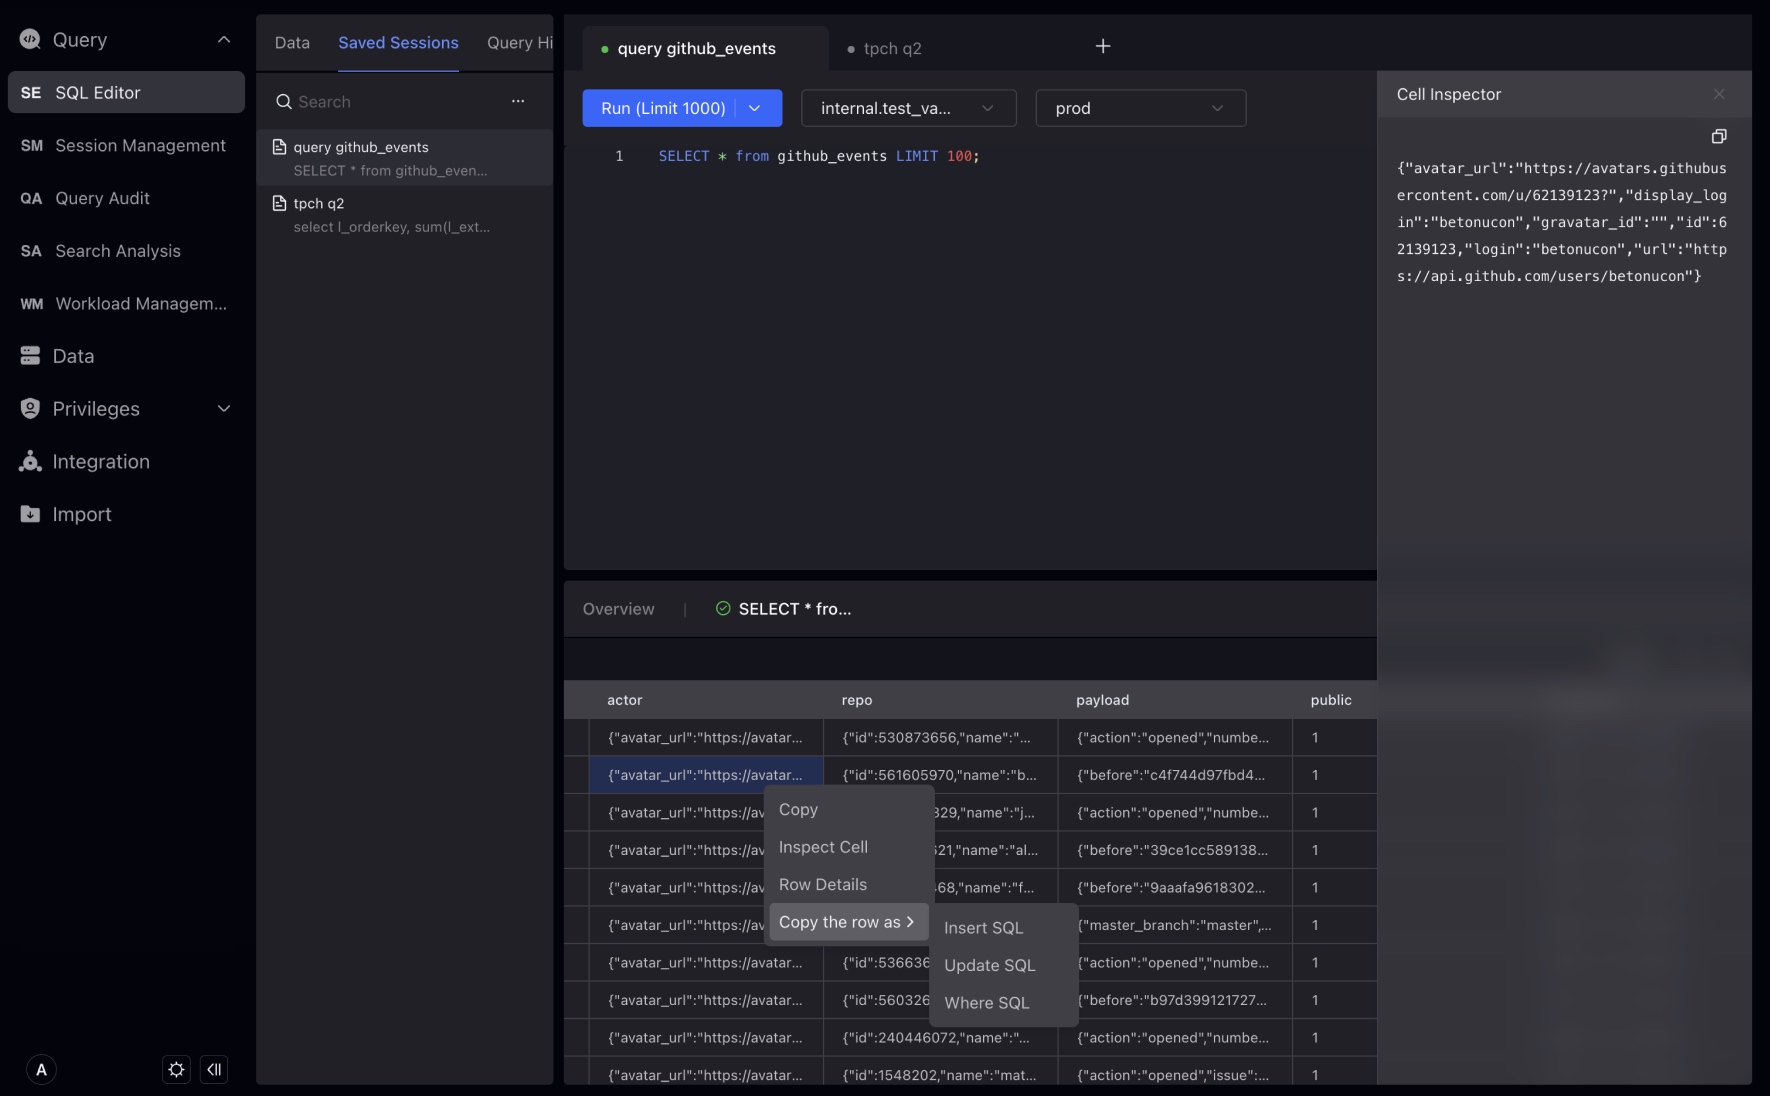
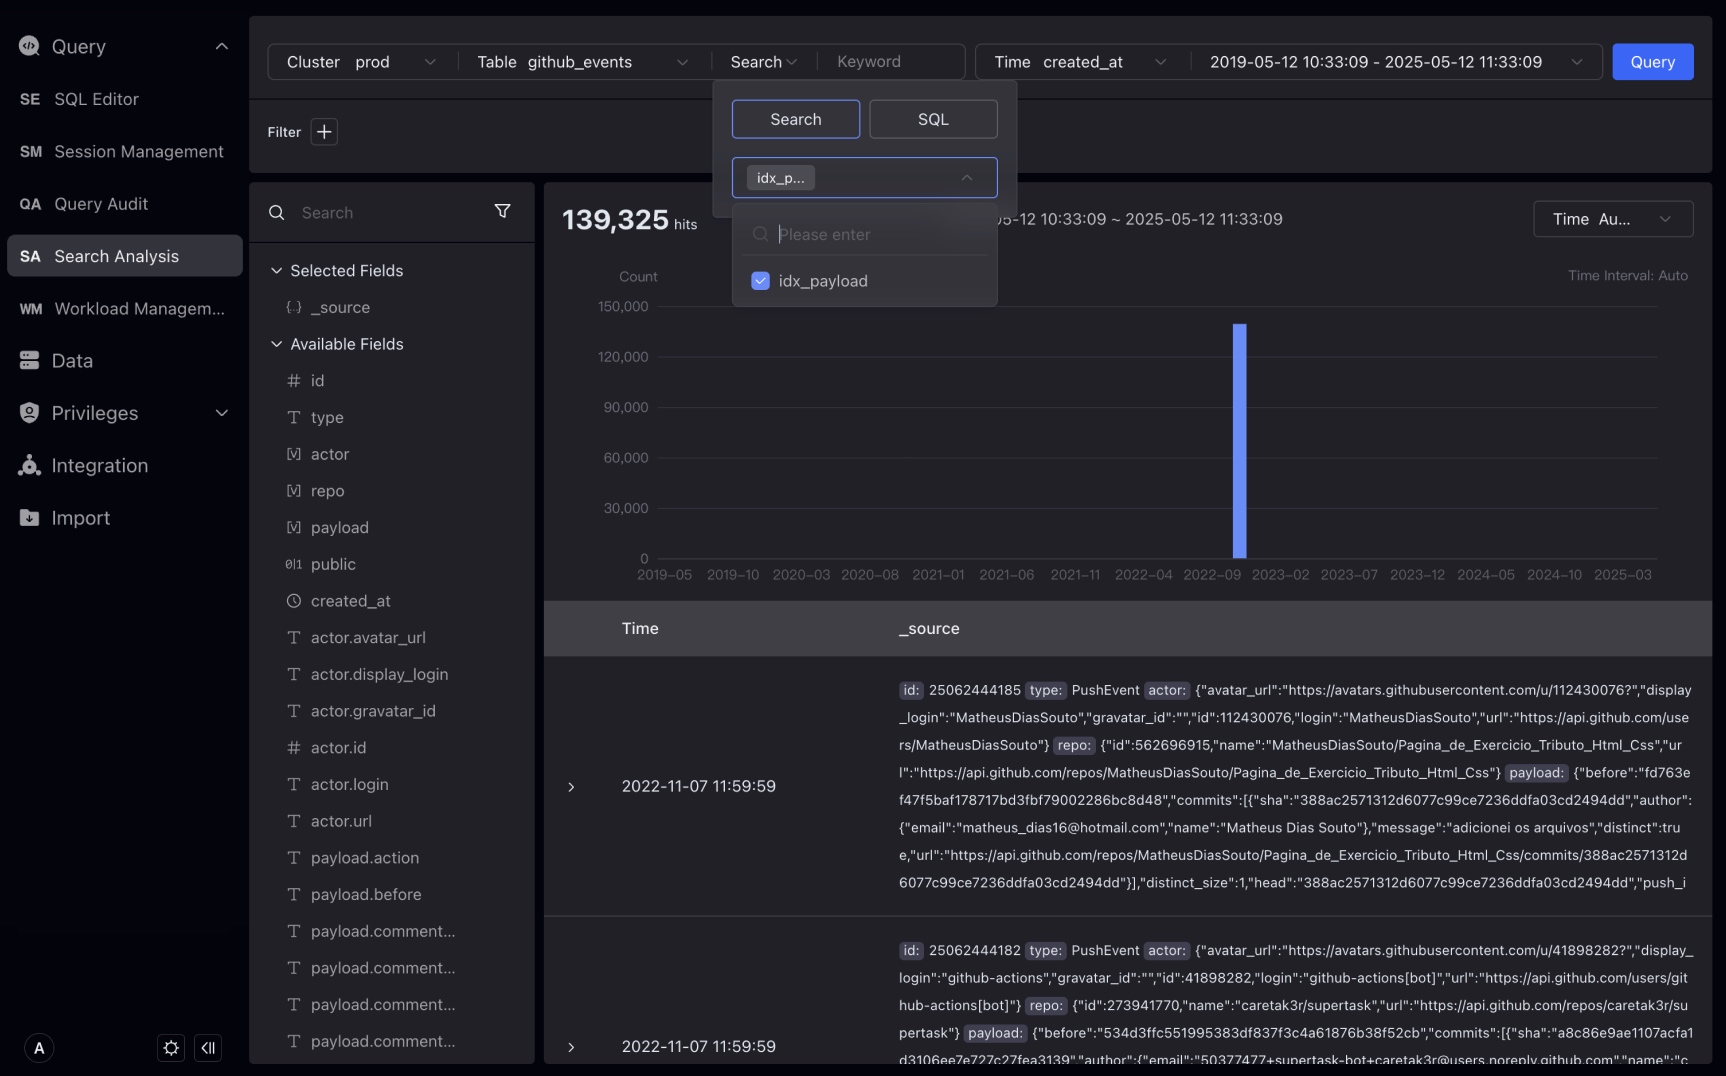
Introduced a new data type VARIANT, it can store semi-structured JSON data. The VARIANT type is especially suitable for handling complex nested structures that may change at any time.
Studio will recognize the VARIANT data type, automatically expand the hierarchy of that data type, and provide a special filtering method.
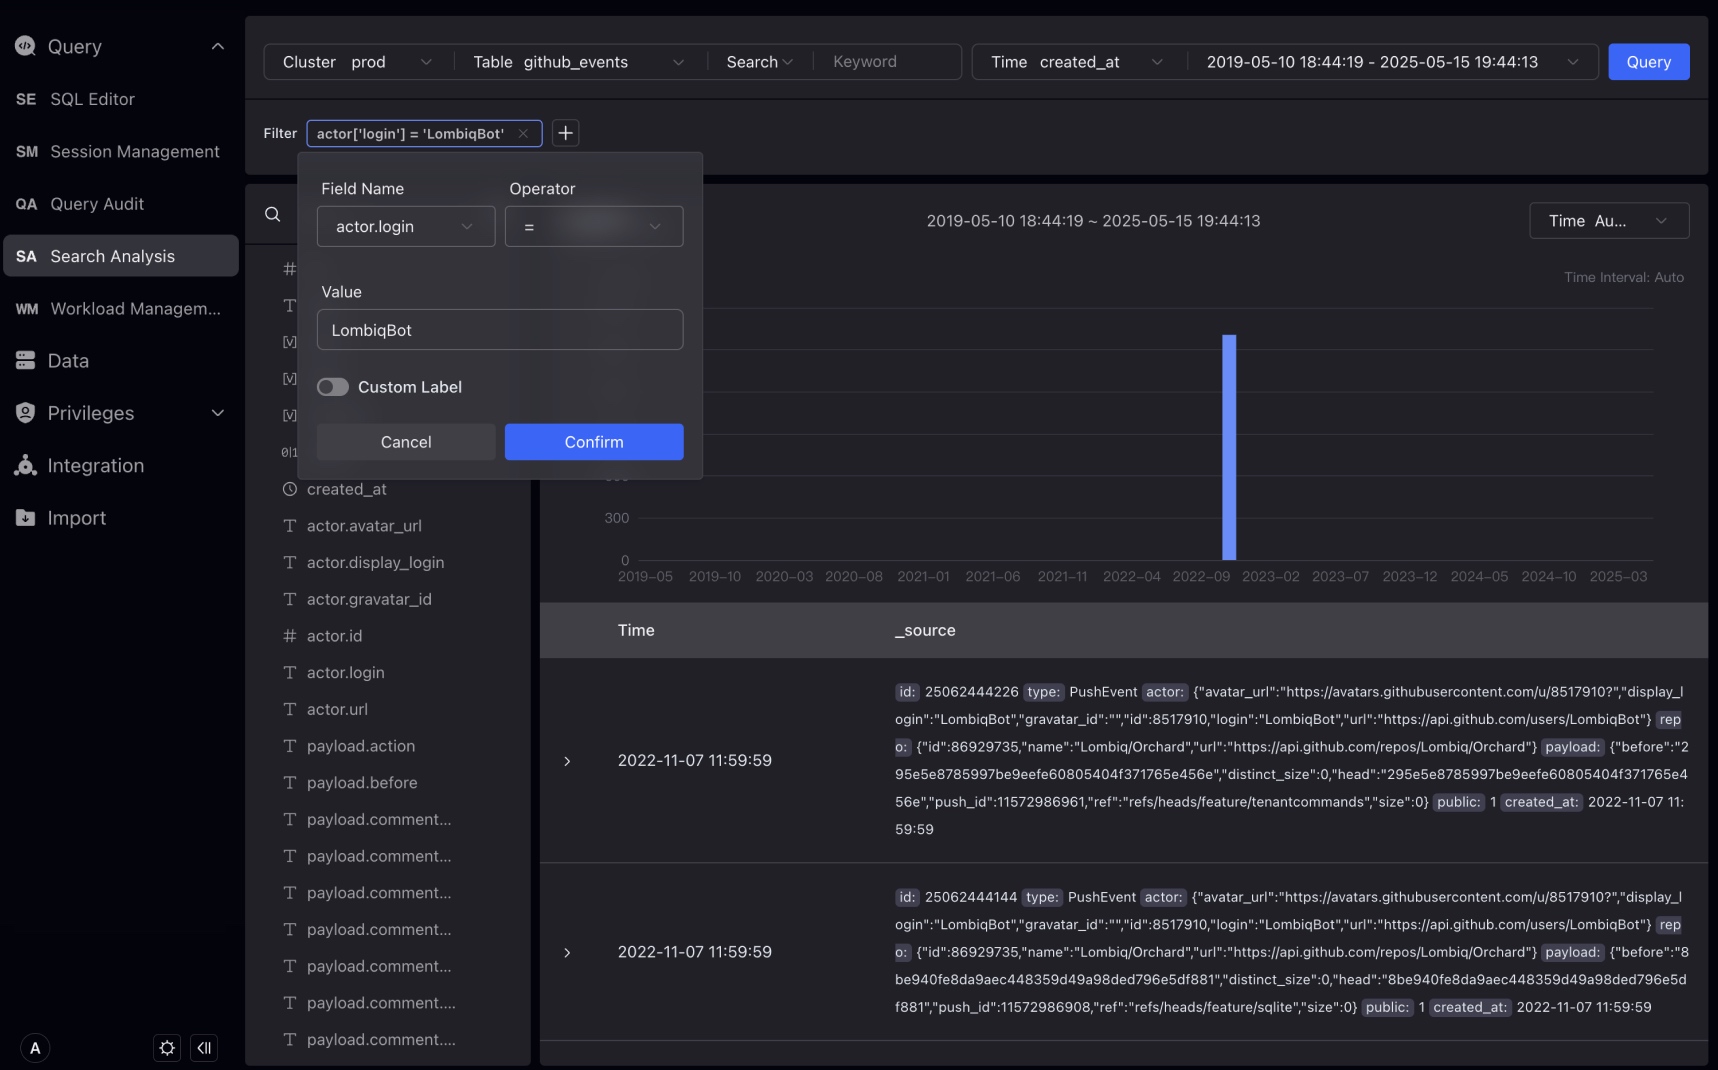
Let's take the github_events table as an example to show how to filter fields of VARIANT data type.
In the filtering condition, we can select the field of the VARIANT data type and select the subfields in it for filtering.
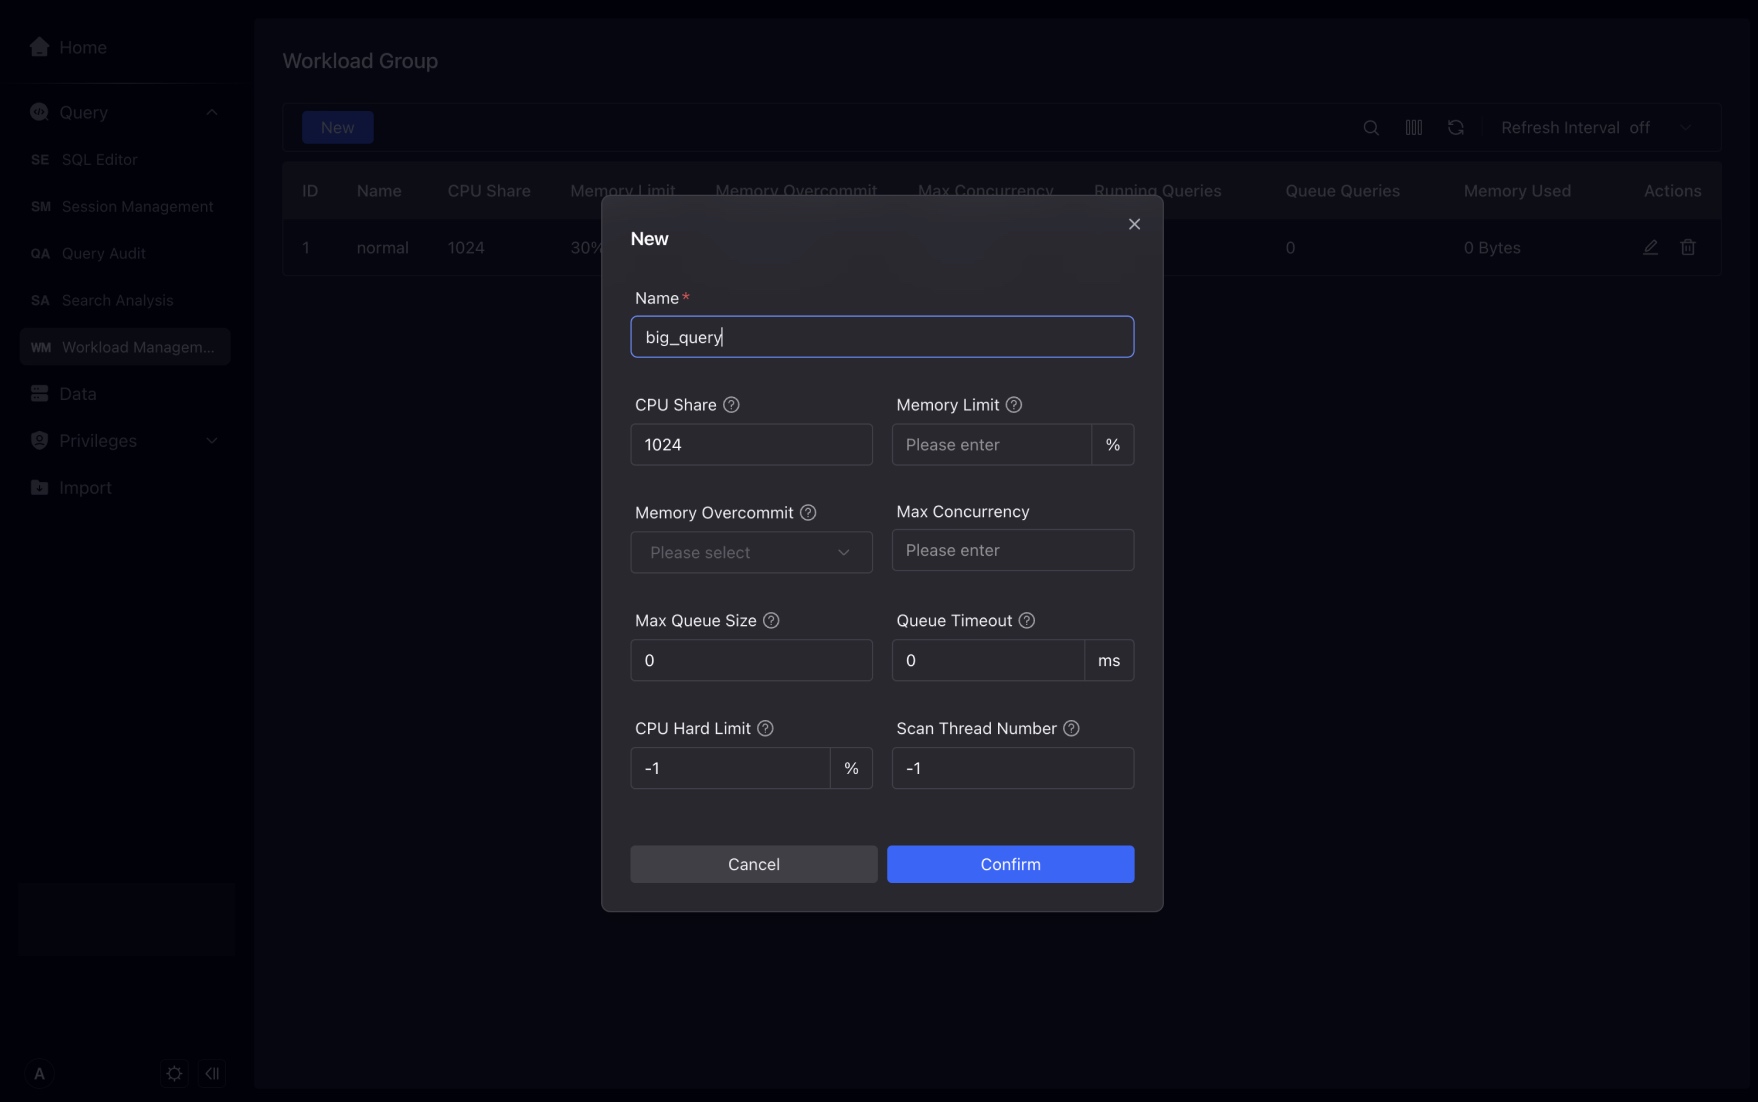
Workload Group Management
NOTE Workload Group Management supports VeloDB Cloud 4.0.0 and above.
Workload Group Management supports the rapid creation, editing and viewing of Workload Group. Using Workload Group, you can manage the CPU/memory/IO resource usage used by querying and importing loads in the cluster, and control the maximum concurrency of queries in the cluster.
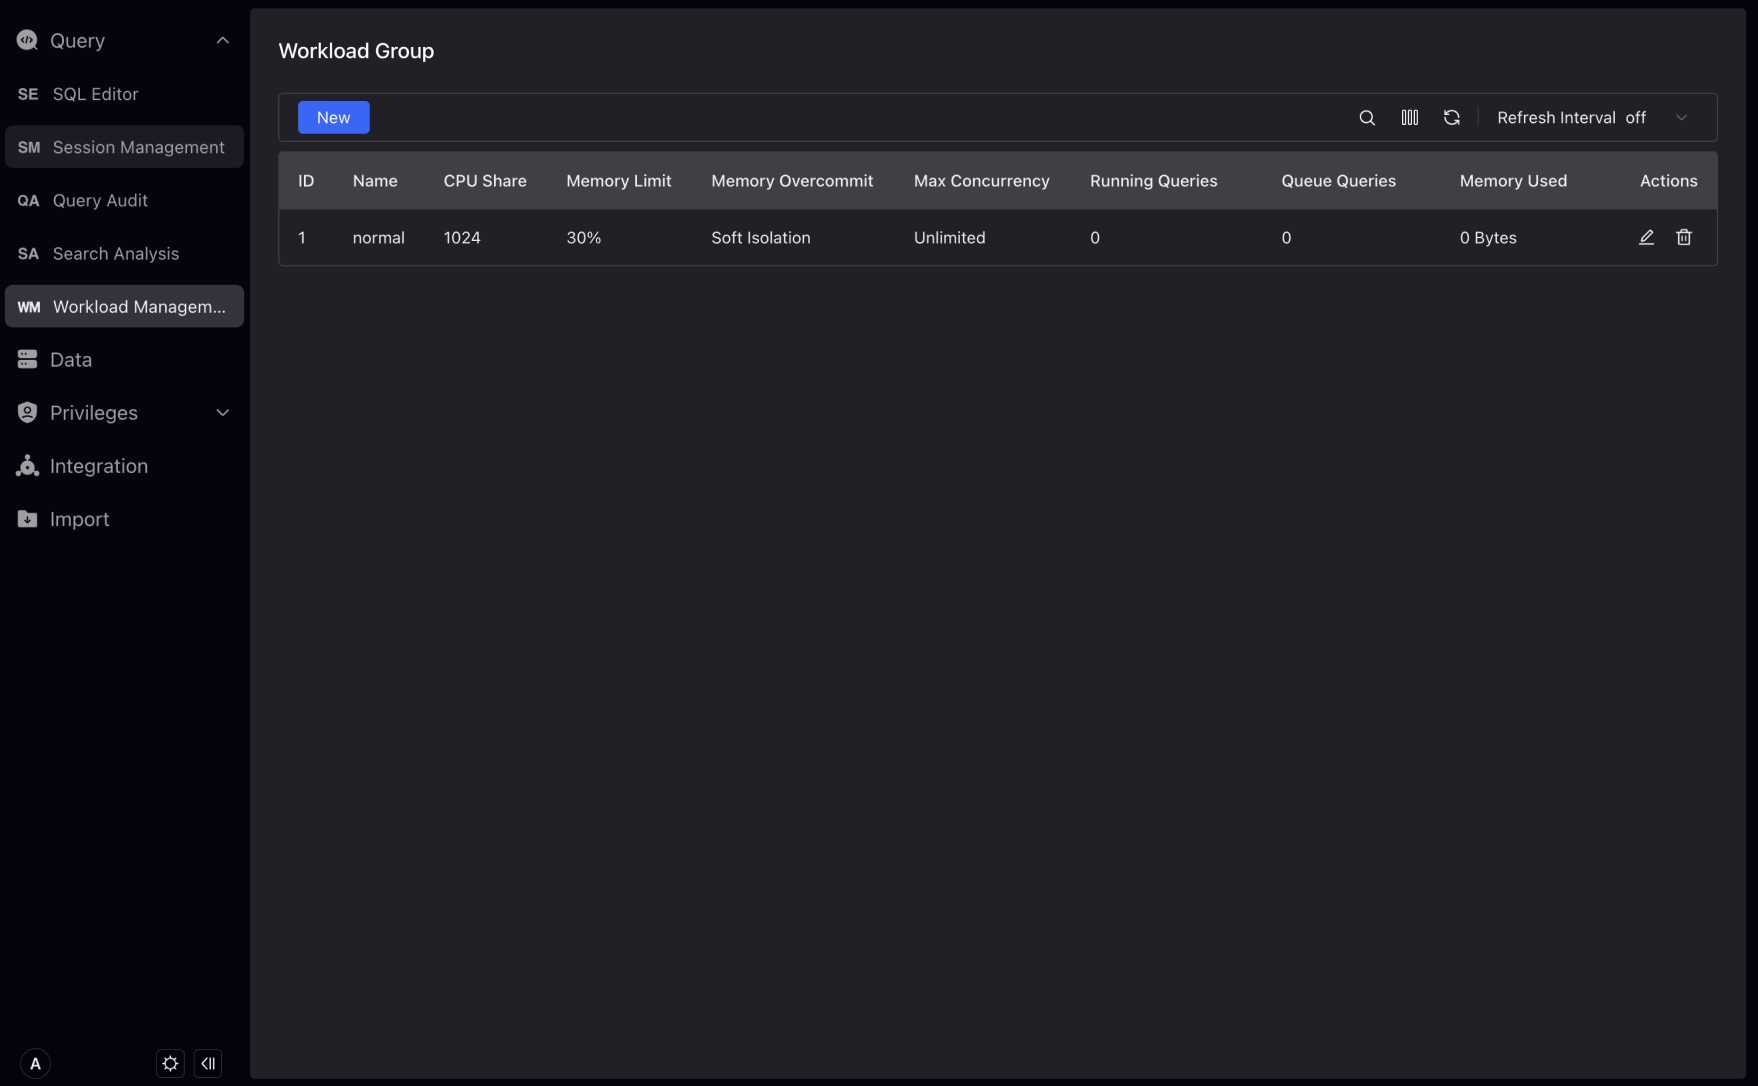
You can view more items in the table filter above the Workload Group list.
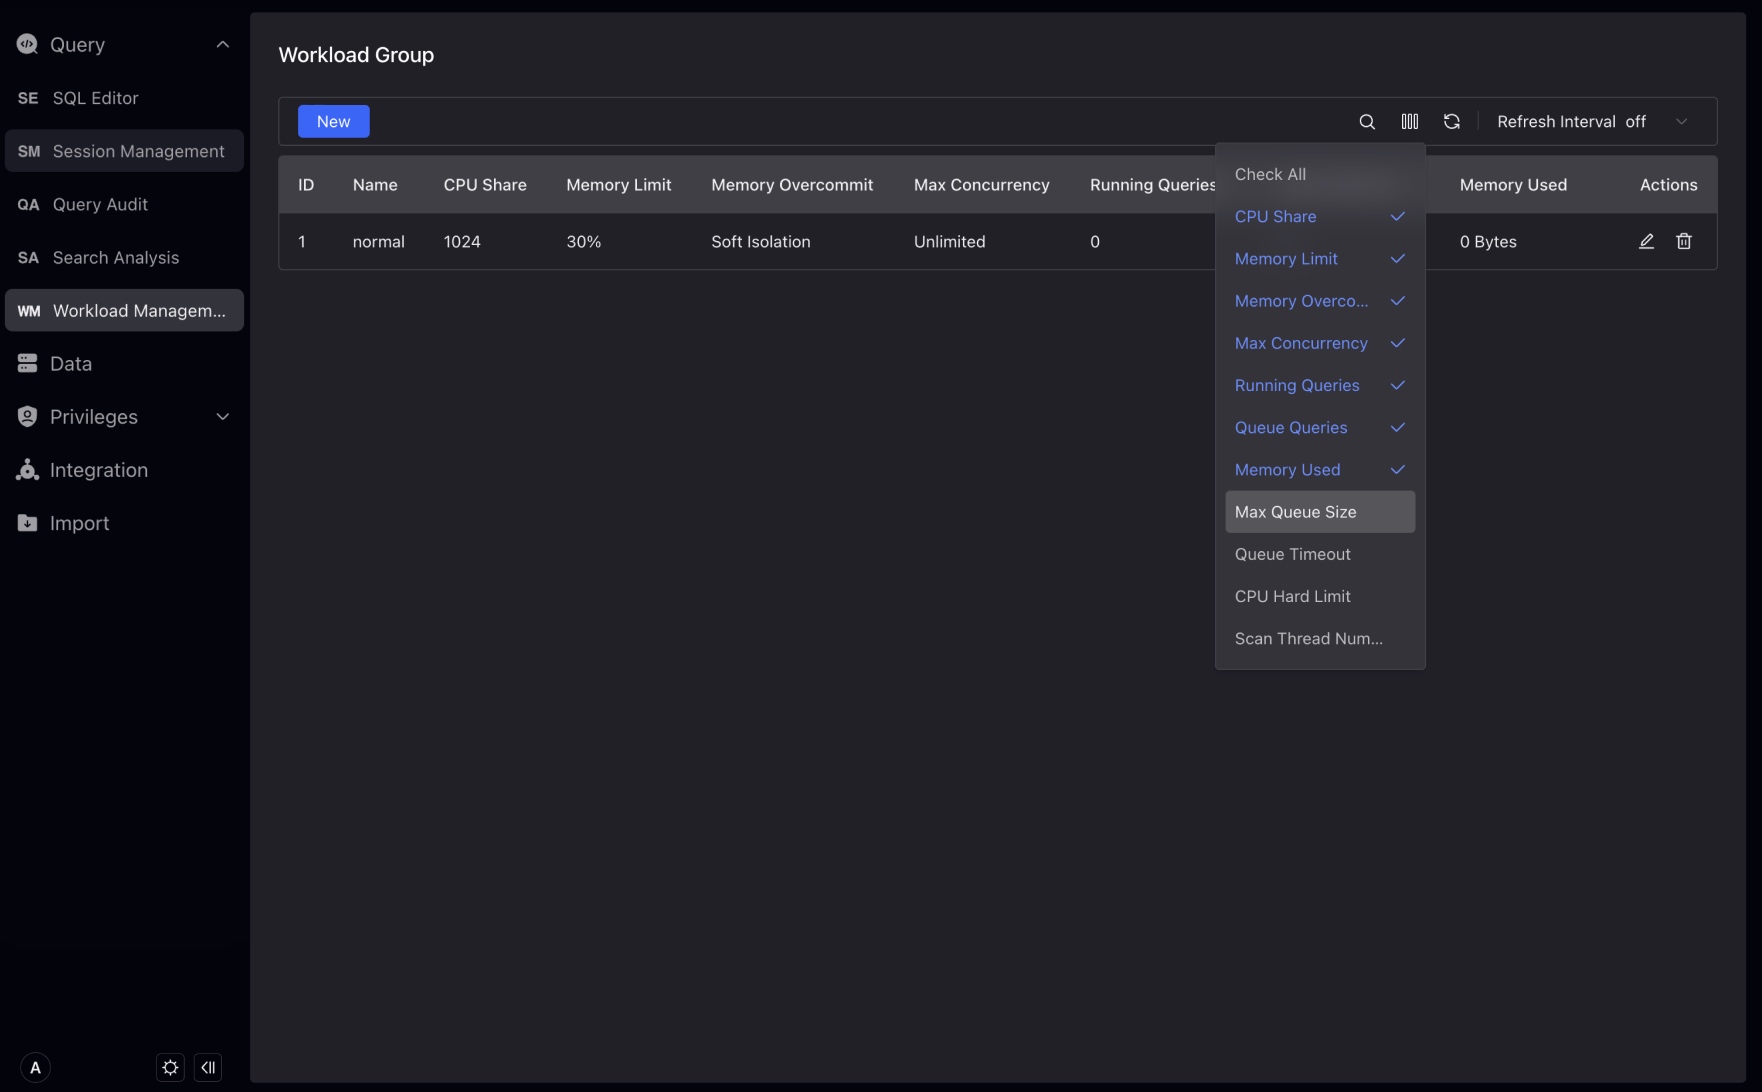
In the New Workload Group interface, you can click on the question mark of the parameter, and the description of the parameter will be displayed.
Integrations
Integrations are portals connecting VeloDB Cloud with data outside the warehouse.
Currently, you can create two new integrations, namely Stage integration (object storage) and sample data.
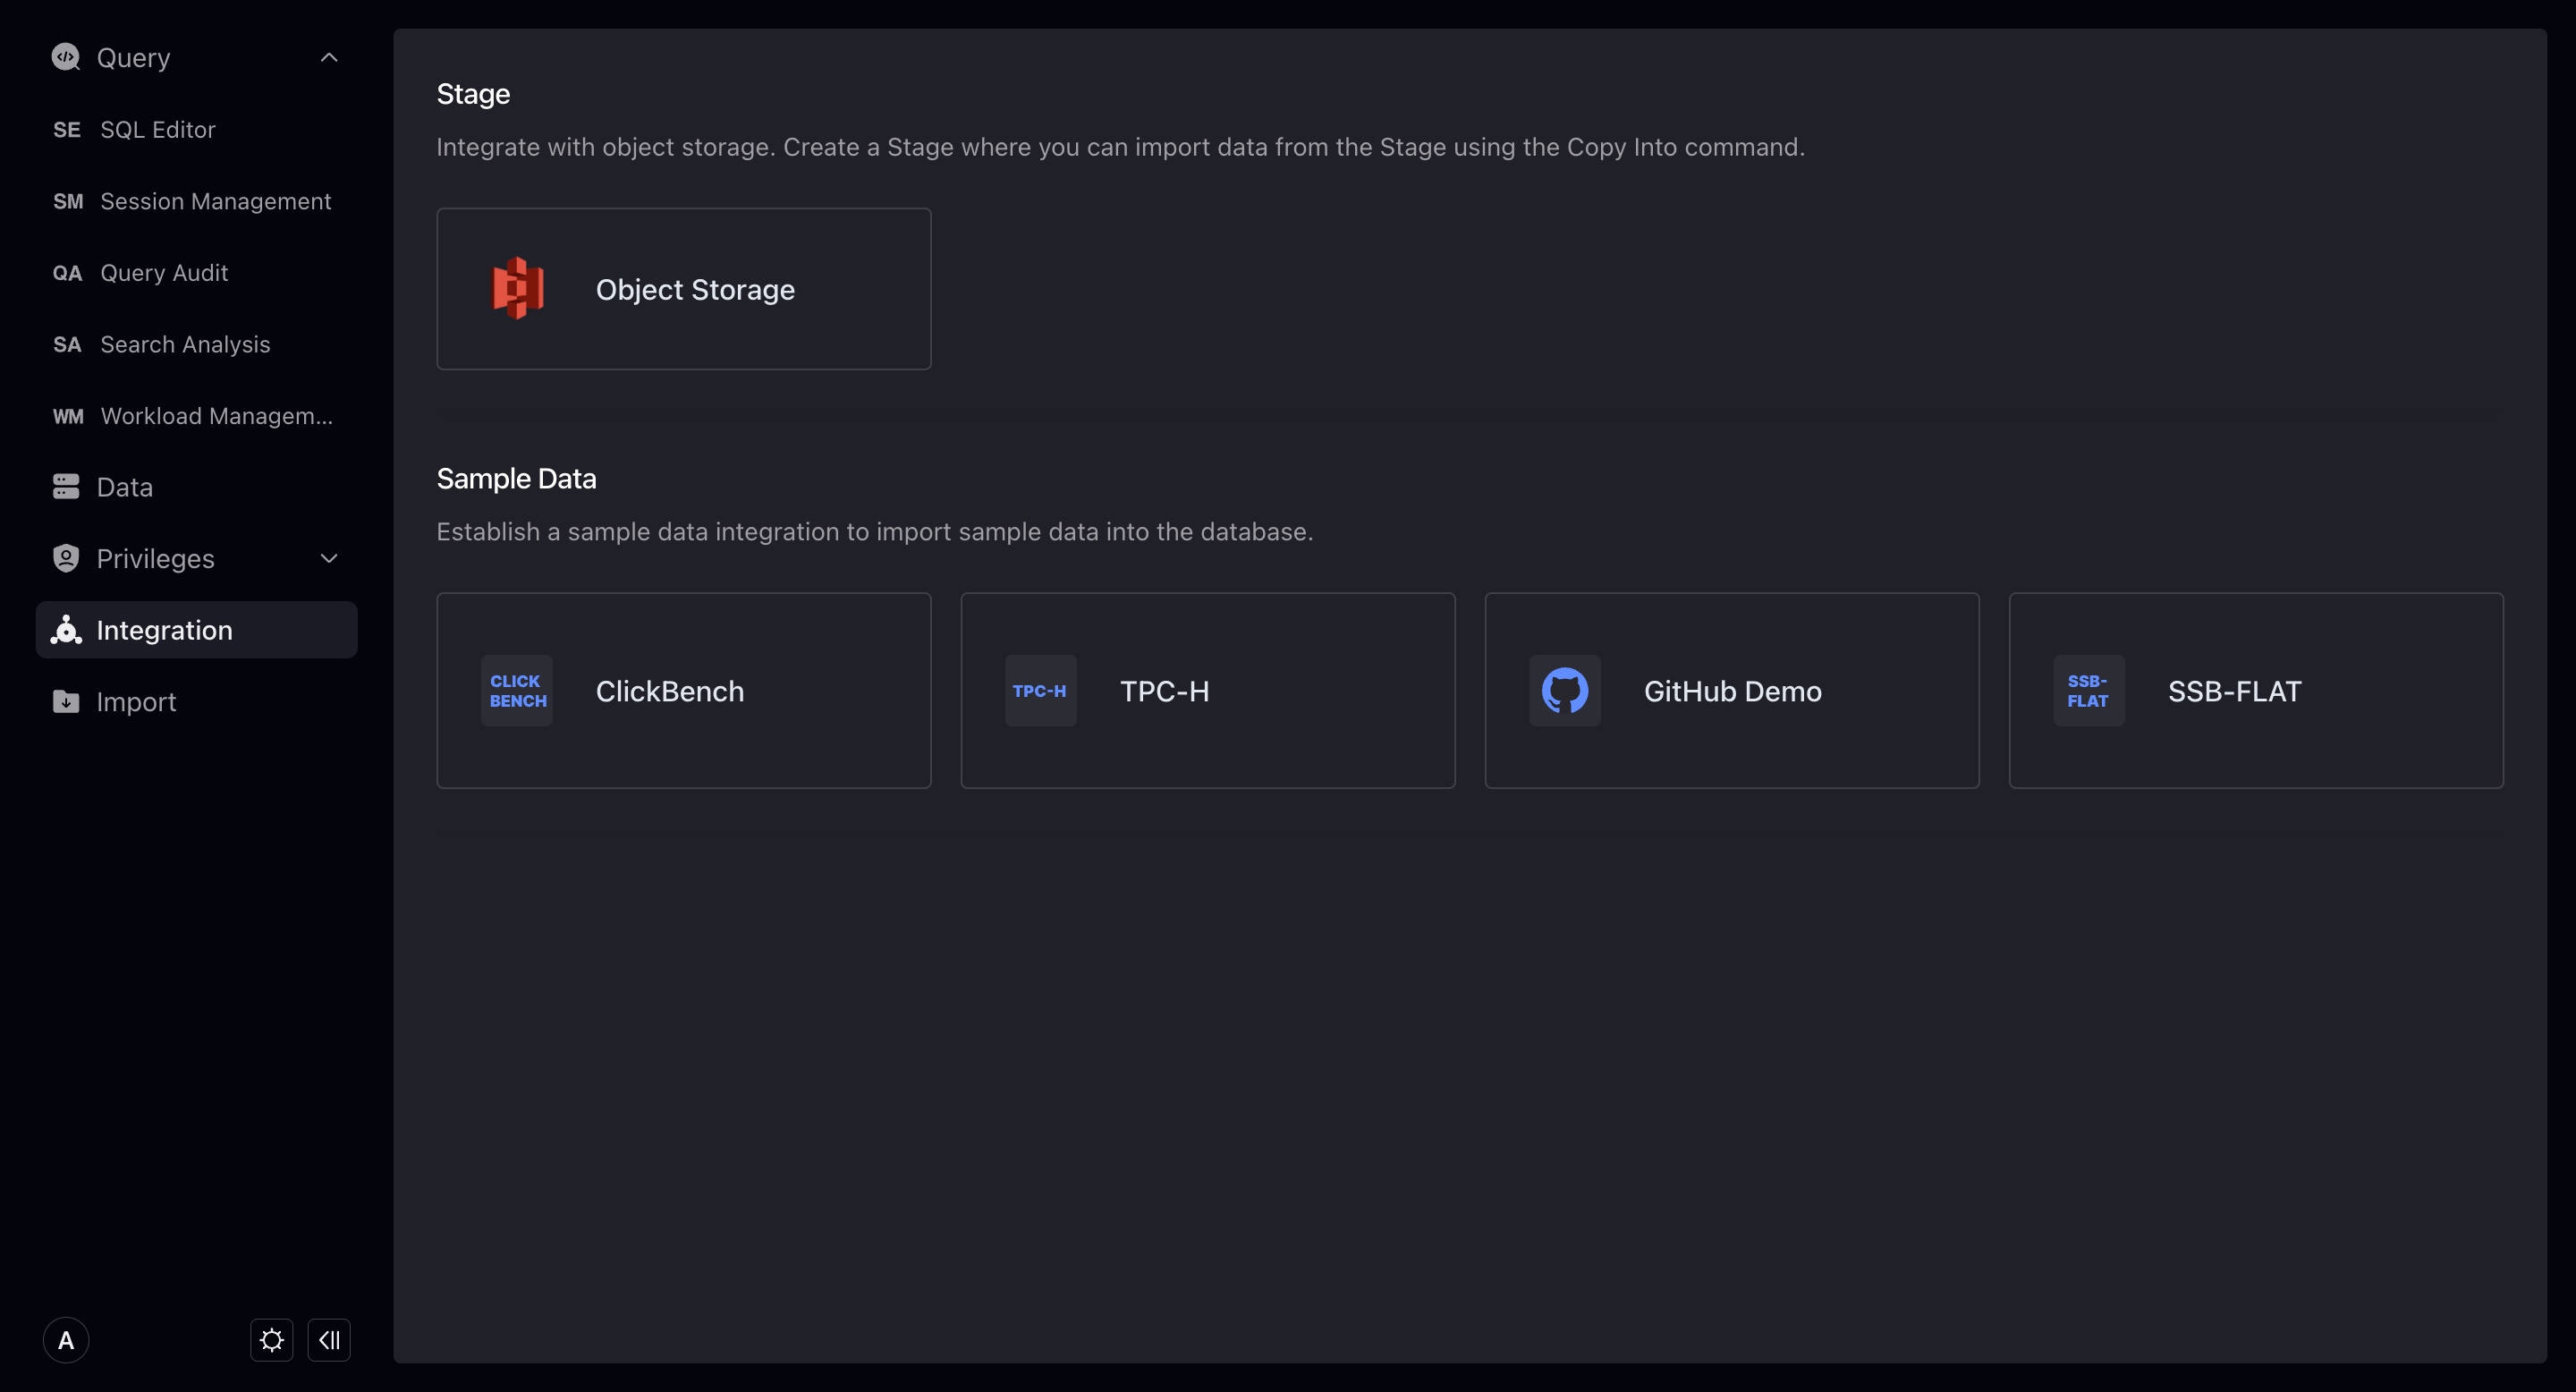
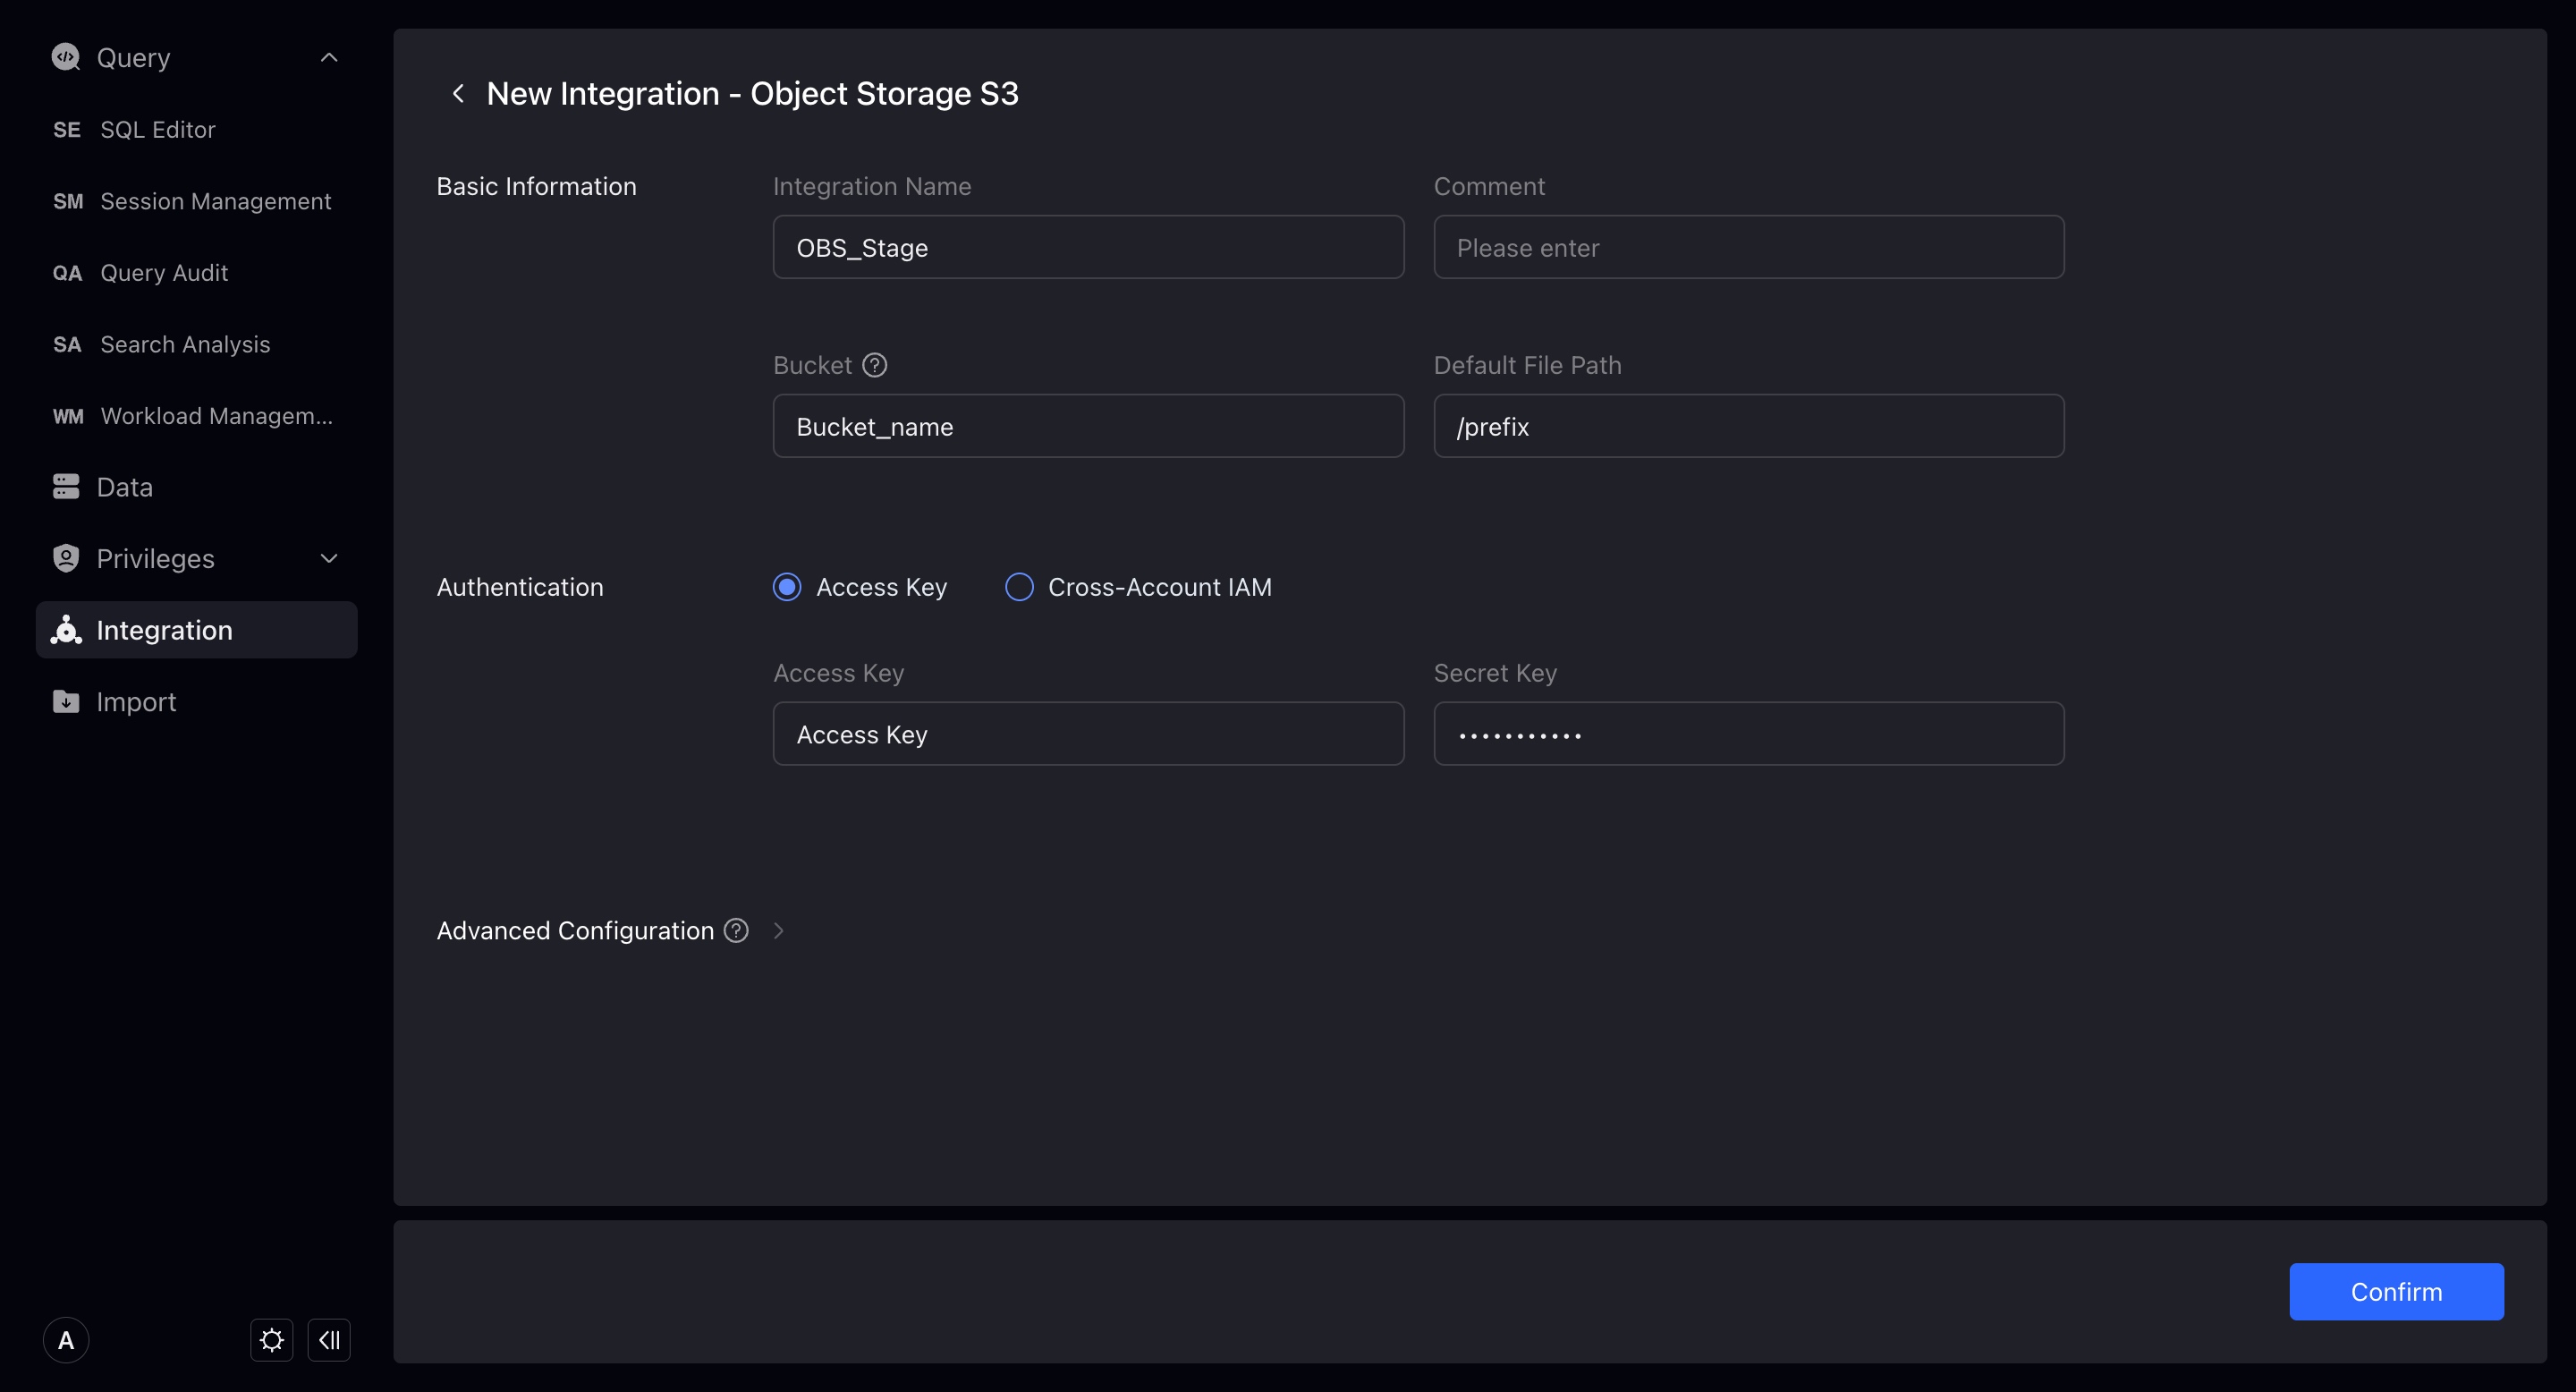
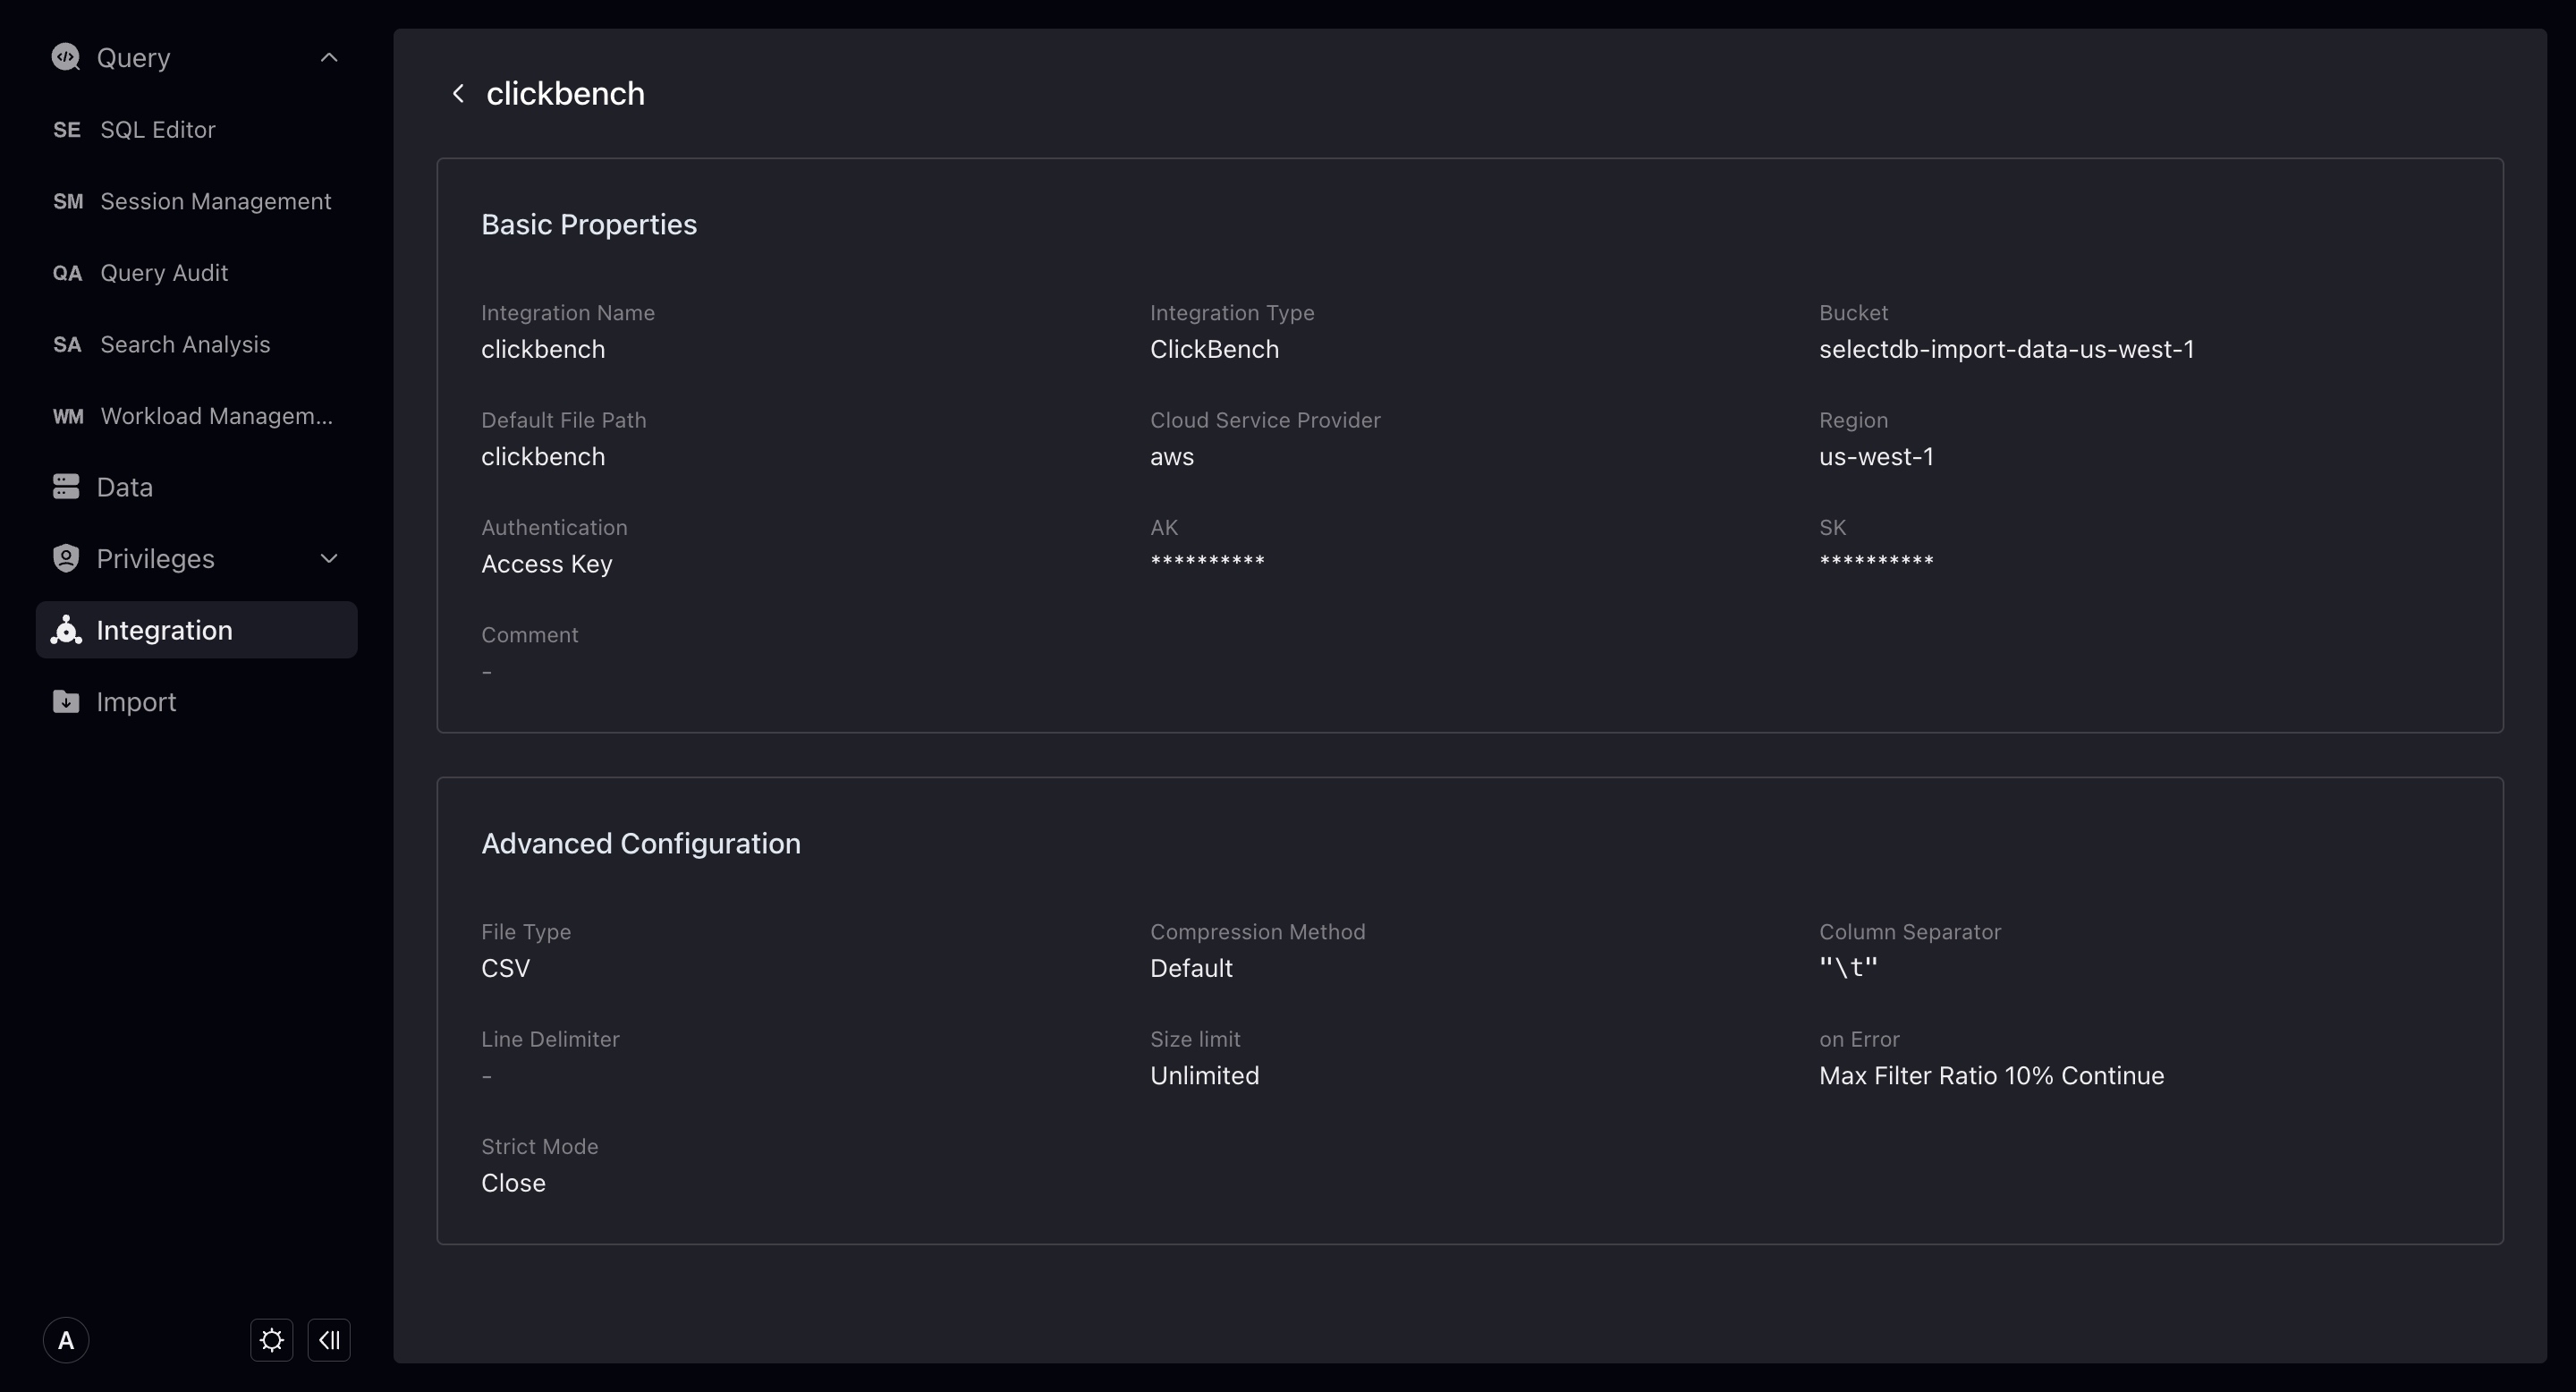
Object Storage
By creating a new object storage integration, you can establish a Connection with data in object storage. Through the Integrate + Copy Into command, you can Import the data in the object storage to the warehouse.
When creating a new object storage integration, you need to enter the following:
- Integration Name: Consistent with the database object naming rules, up to 64 characters, letters, numbers, and underscores can be used.
- Comments: Integrated comments.
- Bucket : The bucket you need to integrate.
- Default file path: The file path to be accessed in the bucket. VeloDB will only access the files under the path you fill in. If you do not fill in, the default is that the data in the entire bucket can be accessed.
- Access Authorization: The way to allow VeloDB to access your bucket. It is divided into Access key and cross-account authorization. We recommend using cross-account authorization for better security. For guidelines on cross-account authorization, please refer to: IAM Cross-Account Access Guide 。You must pass the permissions check to successfully create an integration.
- Advanced Configuration: Details below.
Divided into File Type and Import Configuration. These are the parameters that you may use when importing integrated data. You can set them here, or specify them when importing. If you do not set or specify them, the system will execute the import task of the integration with the default configuration.
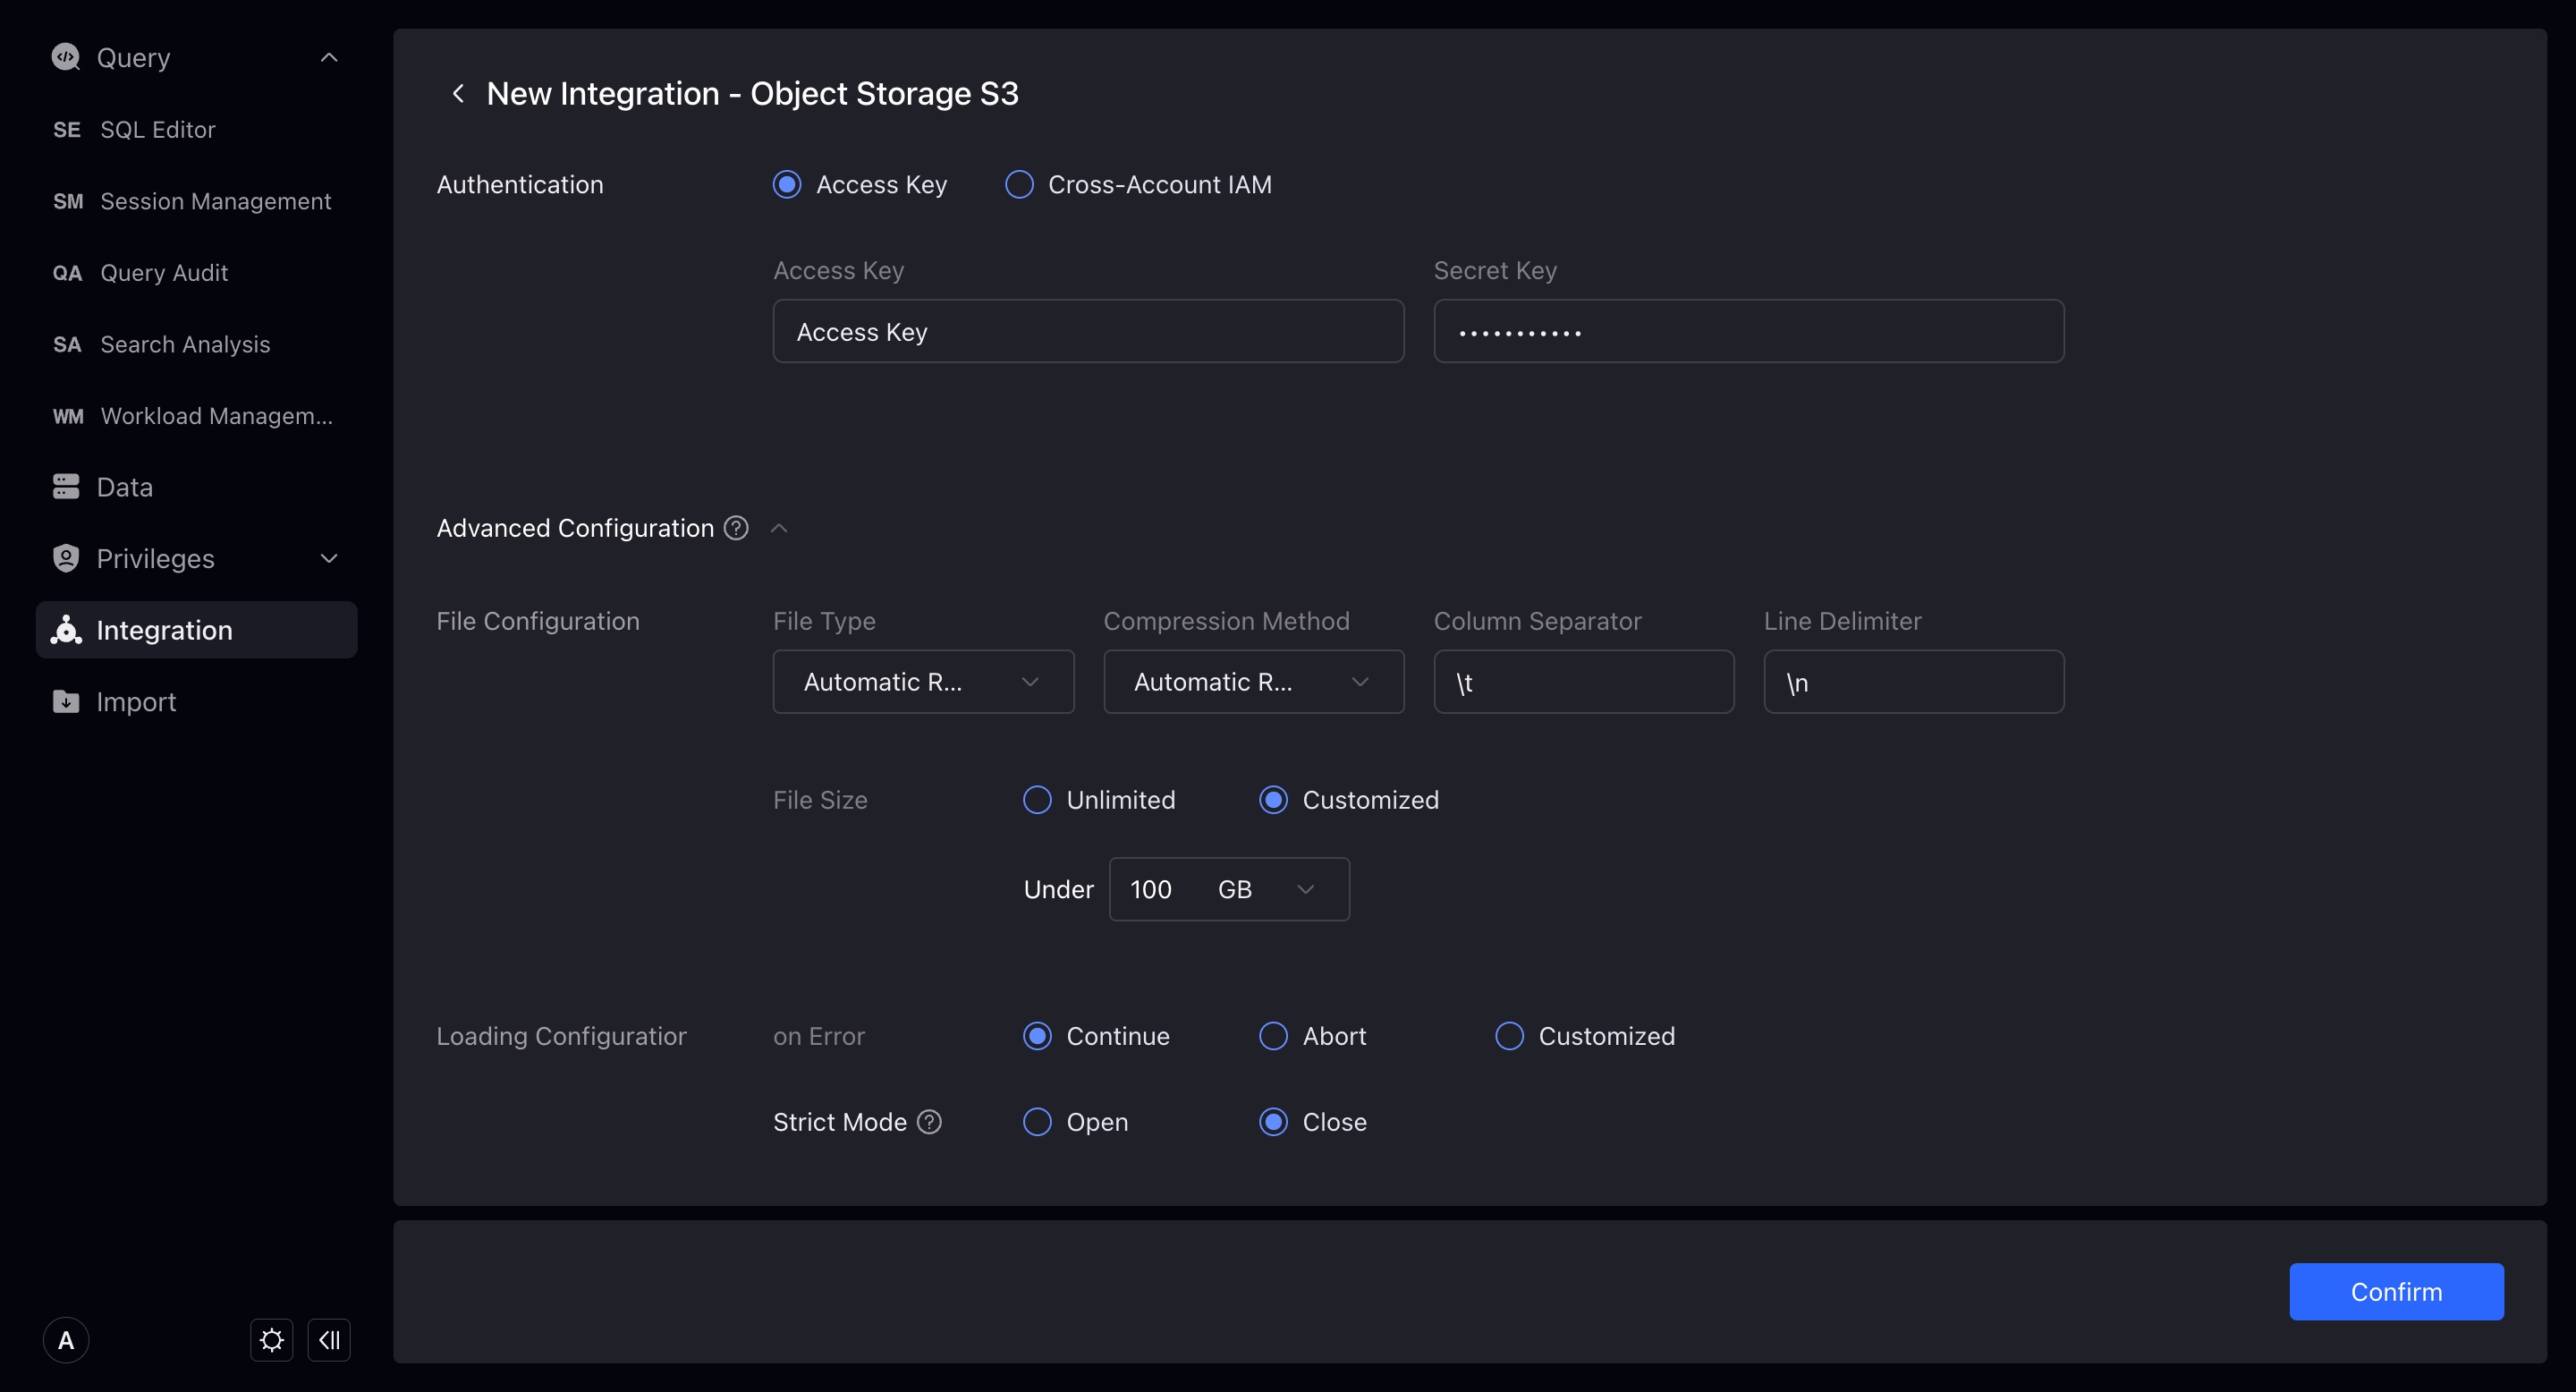
- File type: The default type of the integrated storage file, currently supports
csv,json,orc,parquet. The default is that the system infers from the filename suffix. - Compression method: The default compression type of the integrated storage file, currently supports
gz,bz2,lz4,lzo,deflate. The default is that the system infers from the filename suffix. - Column separator: The default column separator of the integrated storage file, the default
\t. - Line separator: The default line separator of the integrated storage file, the default
\n. - File size: When importing files under this integration, the default import size limit is unlimited by default.
- On Error: When importing files under this integration, when the data quality is unqualified, the default error handling method. There are three types: continue importing, stop importing, and continue importing when the proportion of error data does not exceed a certain value.
- Strict Mode: Strictly filter the column type conversion during the import process. Default is off.
Sample Data
Creating a new sample data integration will import sample data into the database on the basis of creating an object storage integration. Therefore, you need to select the cluster to complete the new creation. TPCH, Github Event, SSB-FLAT test data size has the following choices: sf1 (1GB), sf10 (10GB), sf100 (100GB), select through the drop-down menu, and the test warehouse can only choose 1sf (1GB).
Clickbench only has the option of sf100 (100GB), we recommend that you use a larger cluster to import Clickbench sample data.
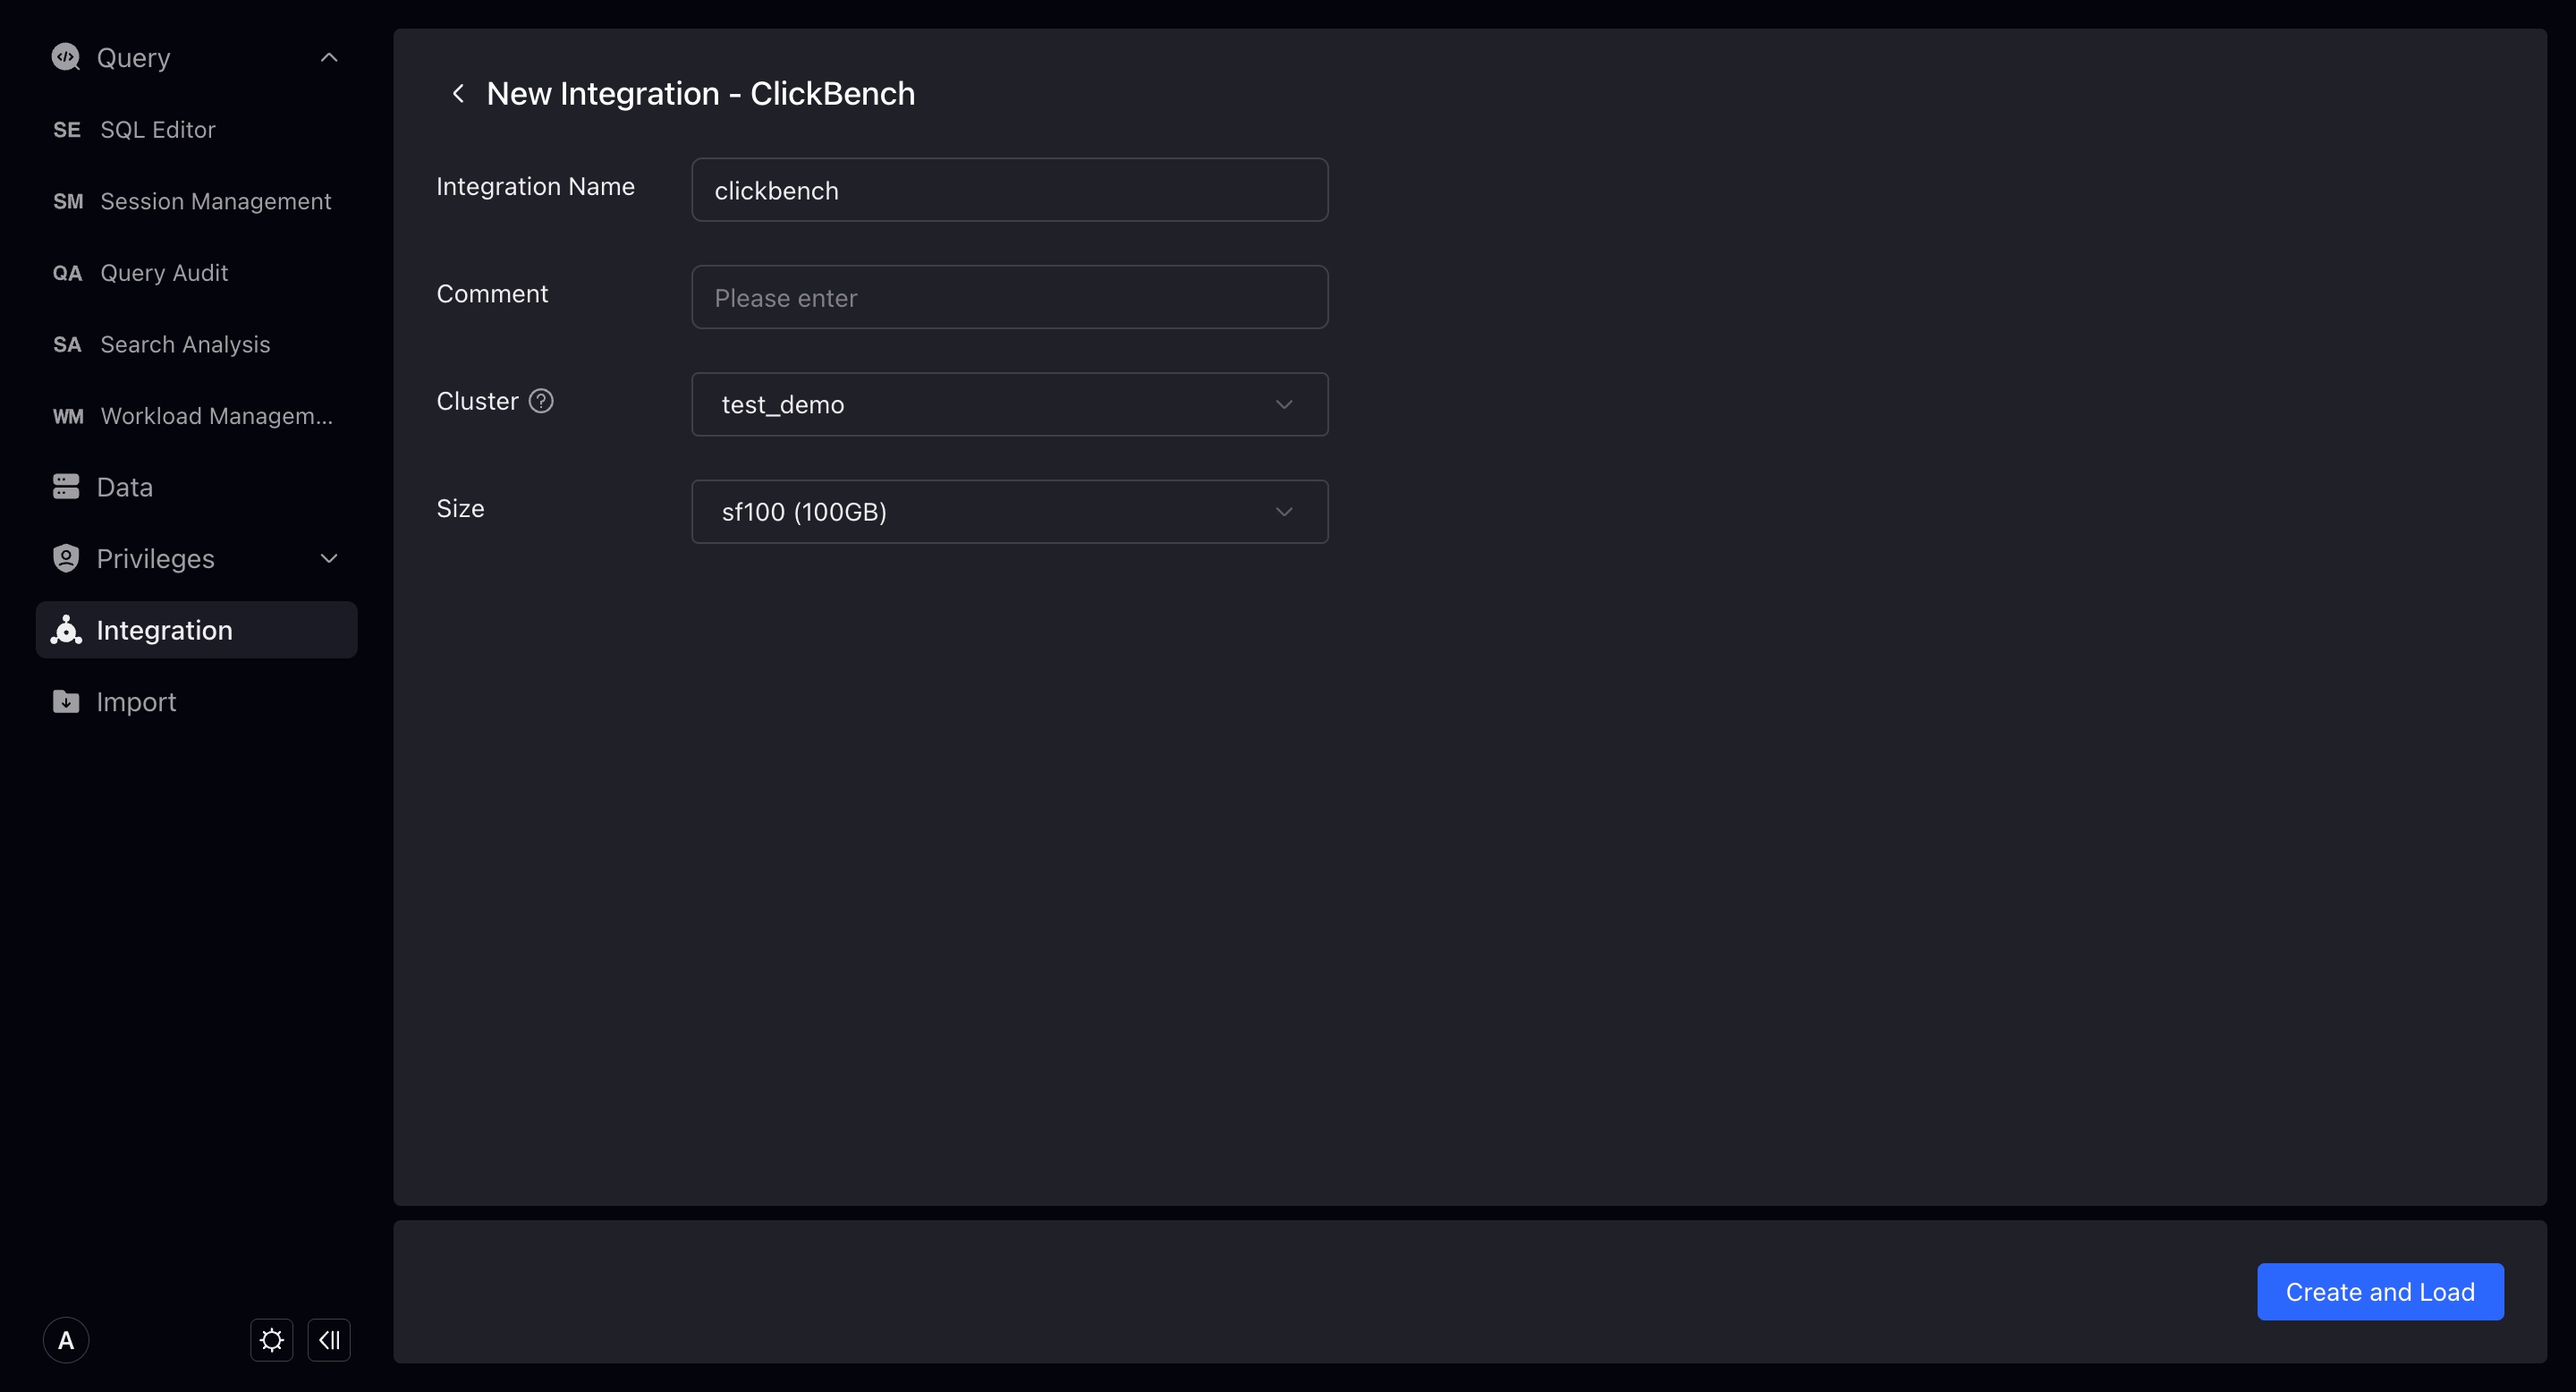
You can view the import progress in the sample data details.
Permissions
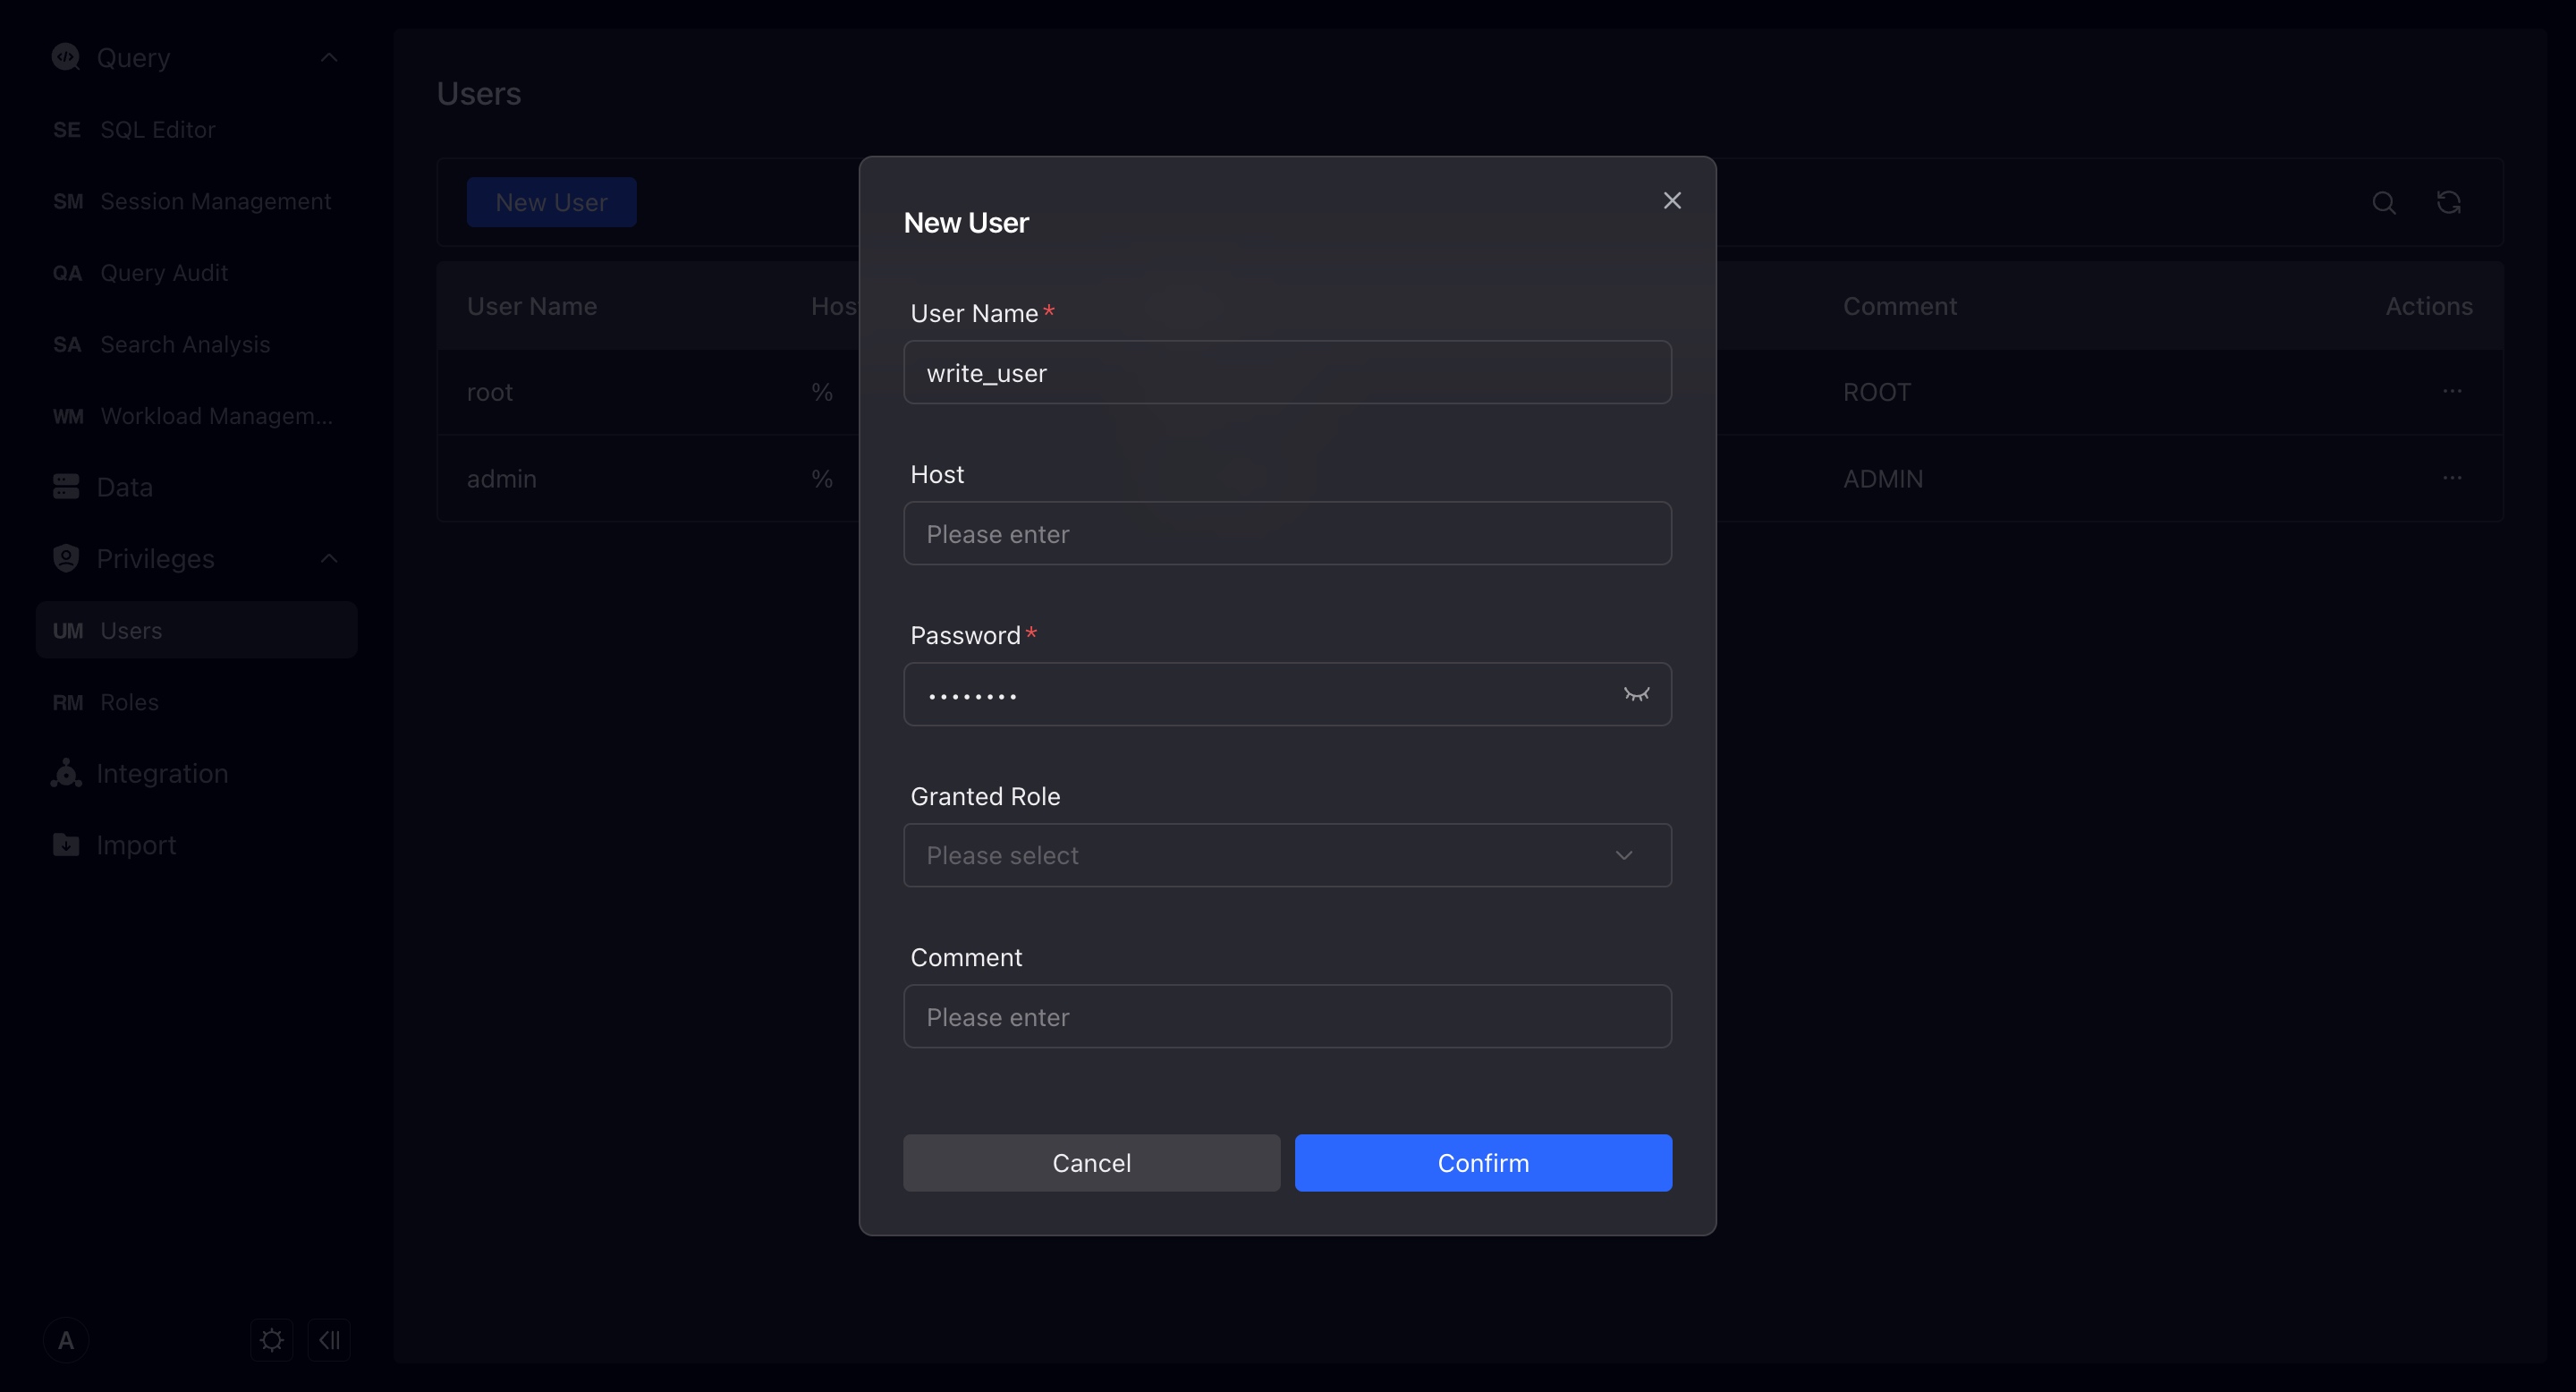
User
Display the users in the VeloDB repository. Note that the root user will not be displayed here.
Only users with Admin authority can add and modify other users.
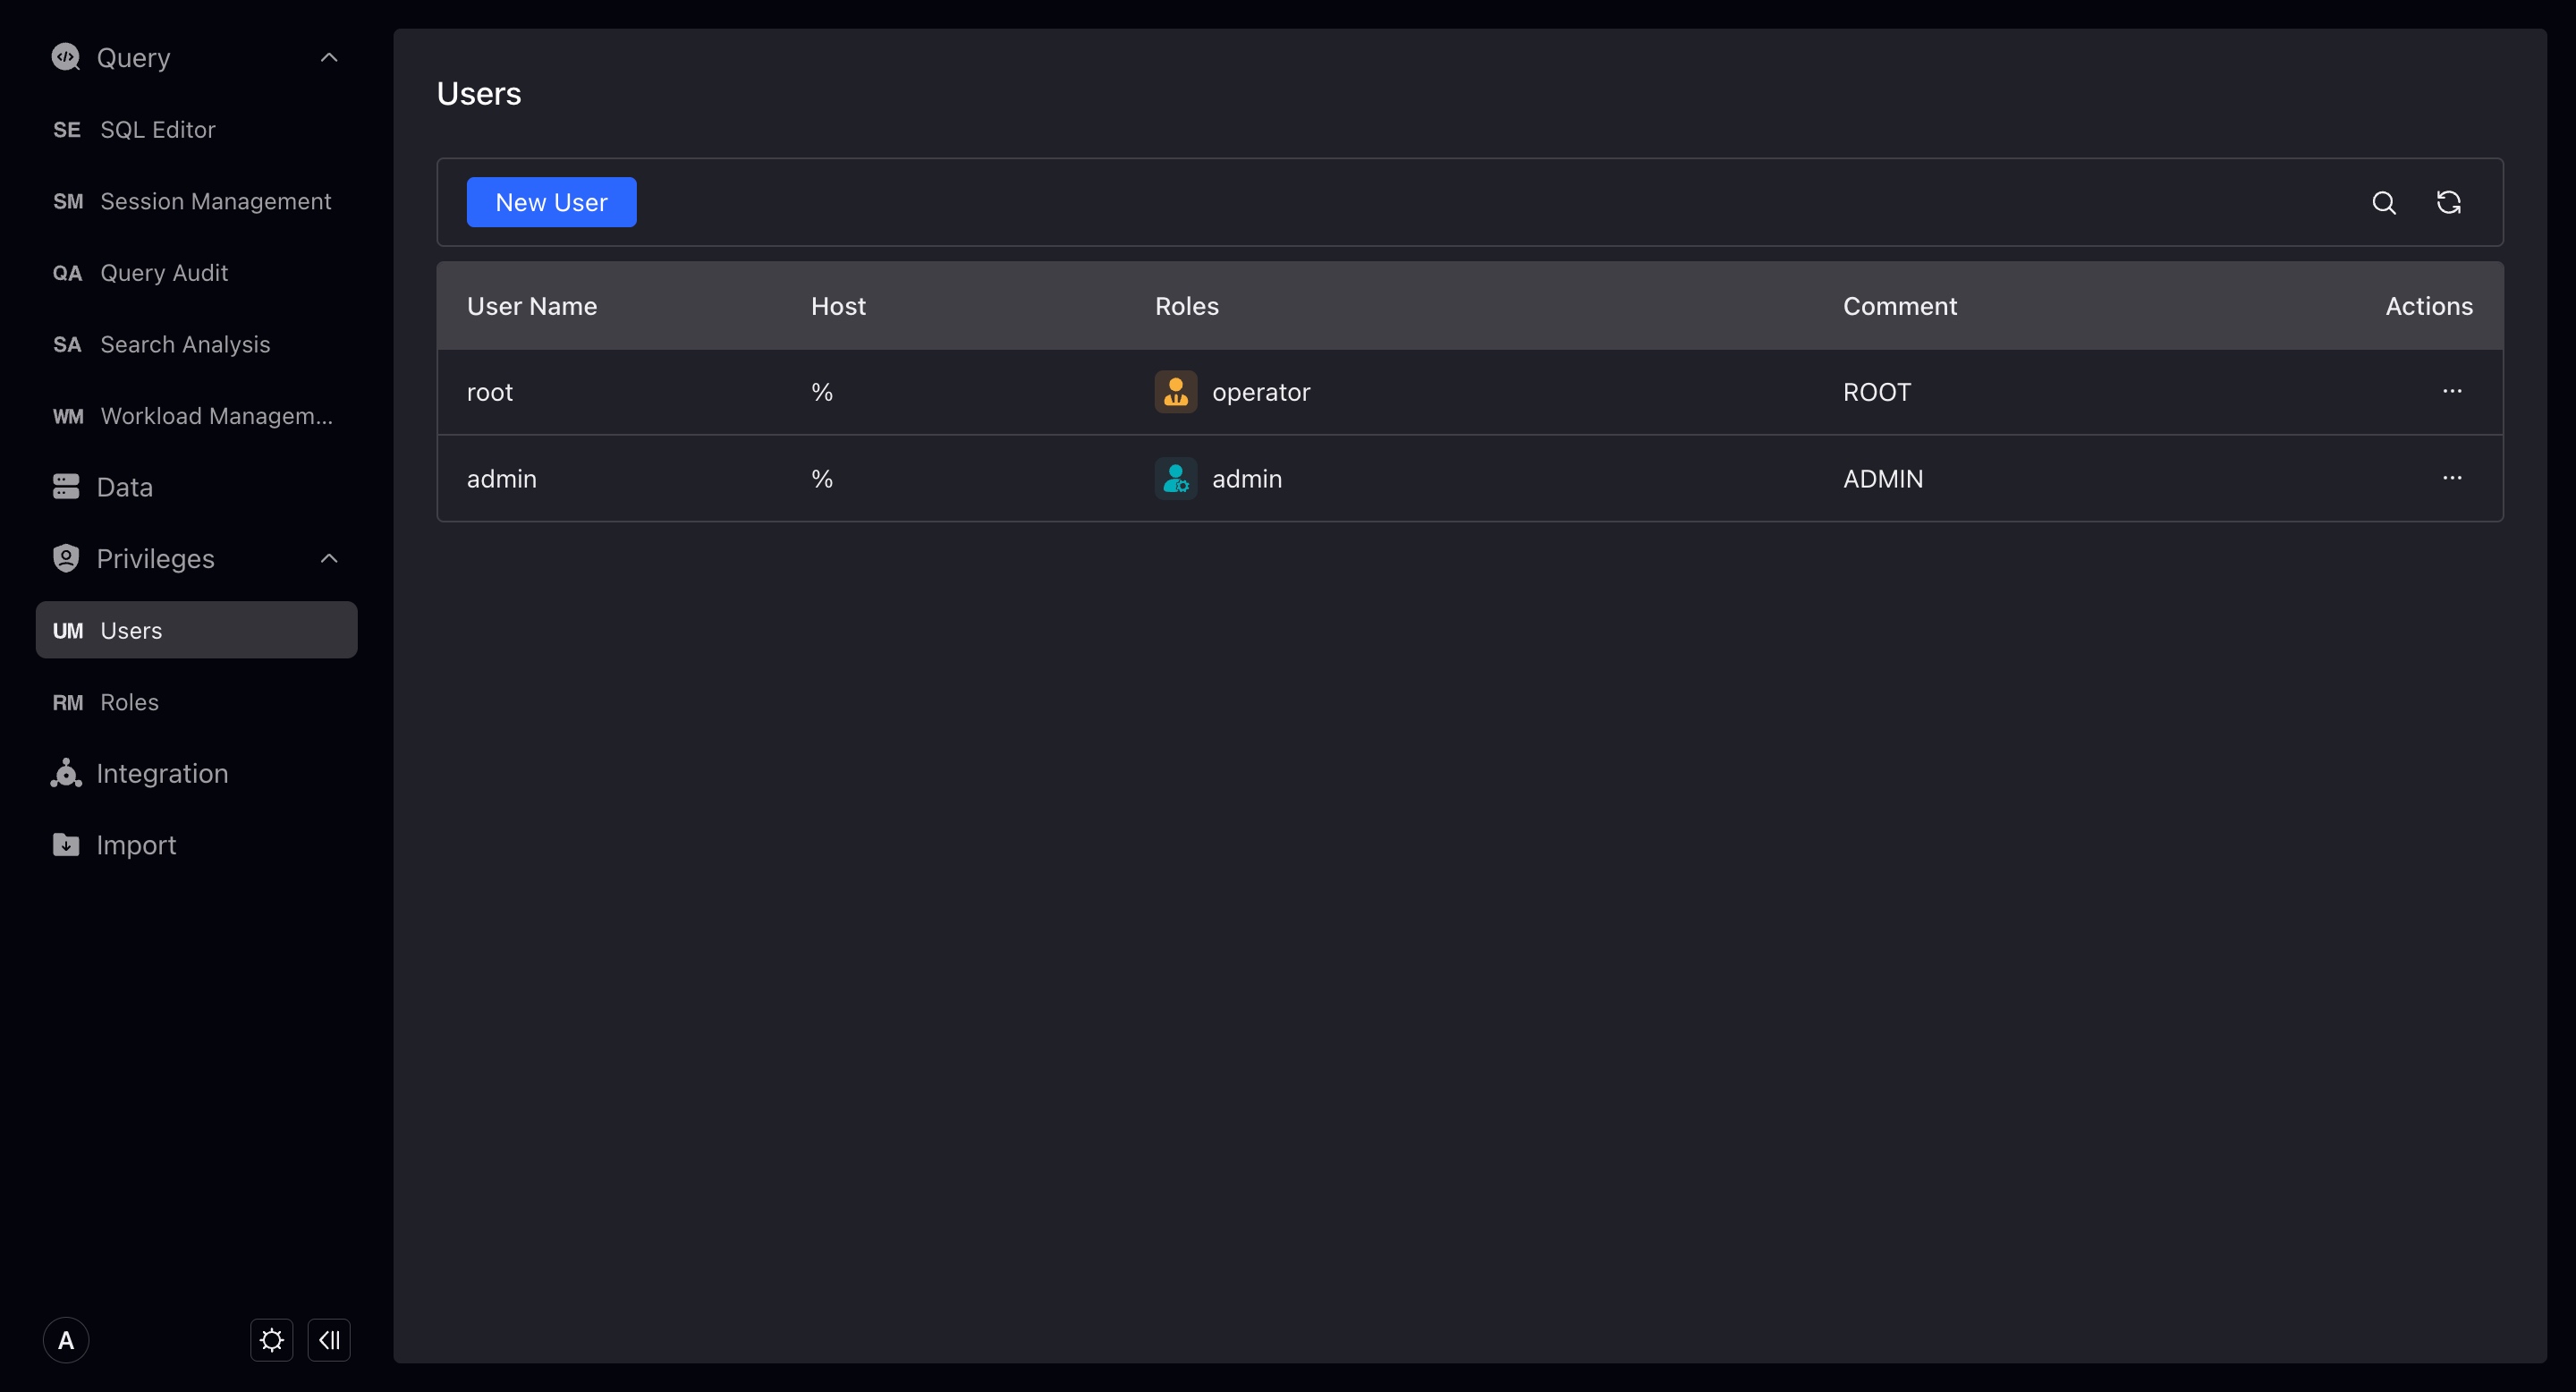
You can create a new user on this page, except for the username, other content is optional. However, we strongly recommend that you add passwords for users and restrict access to hosts for enhanced security.
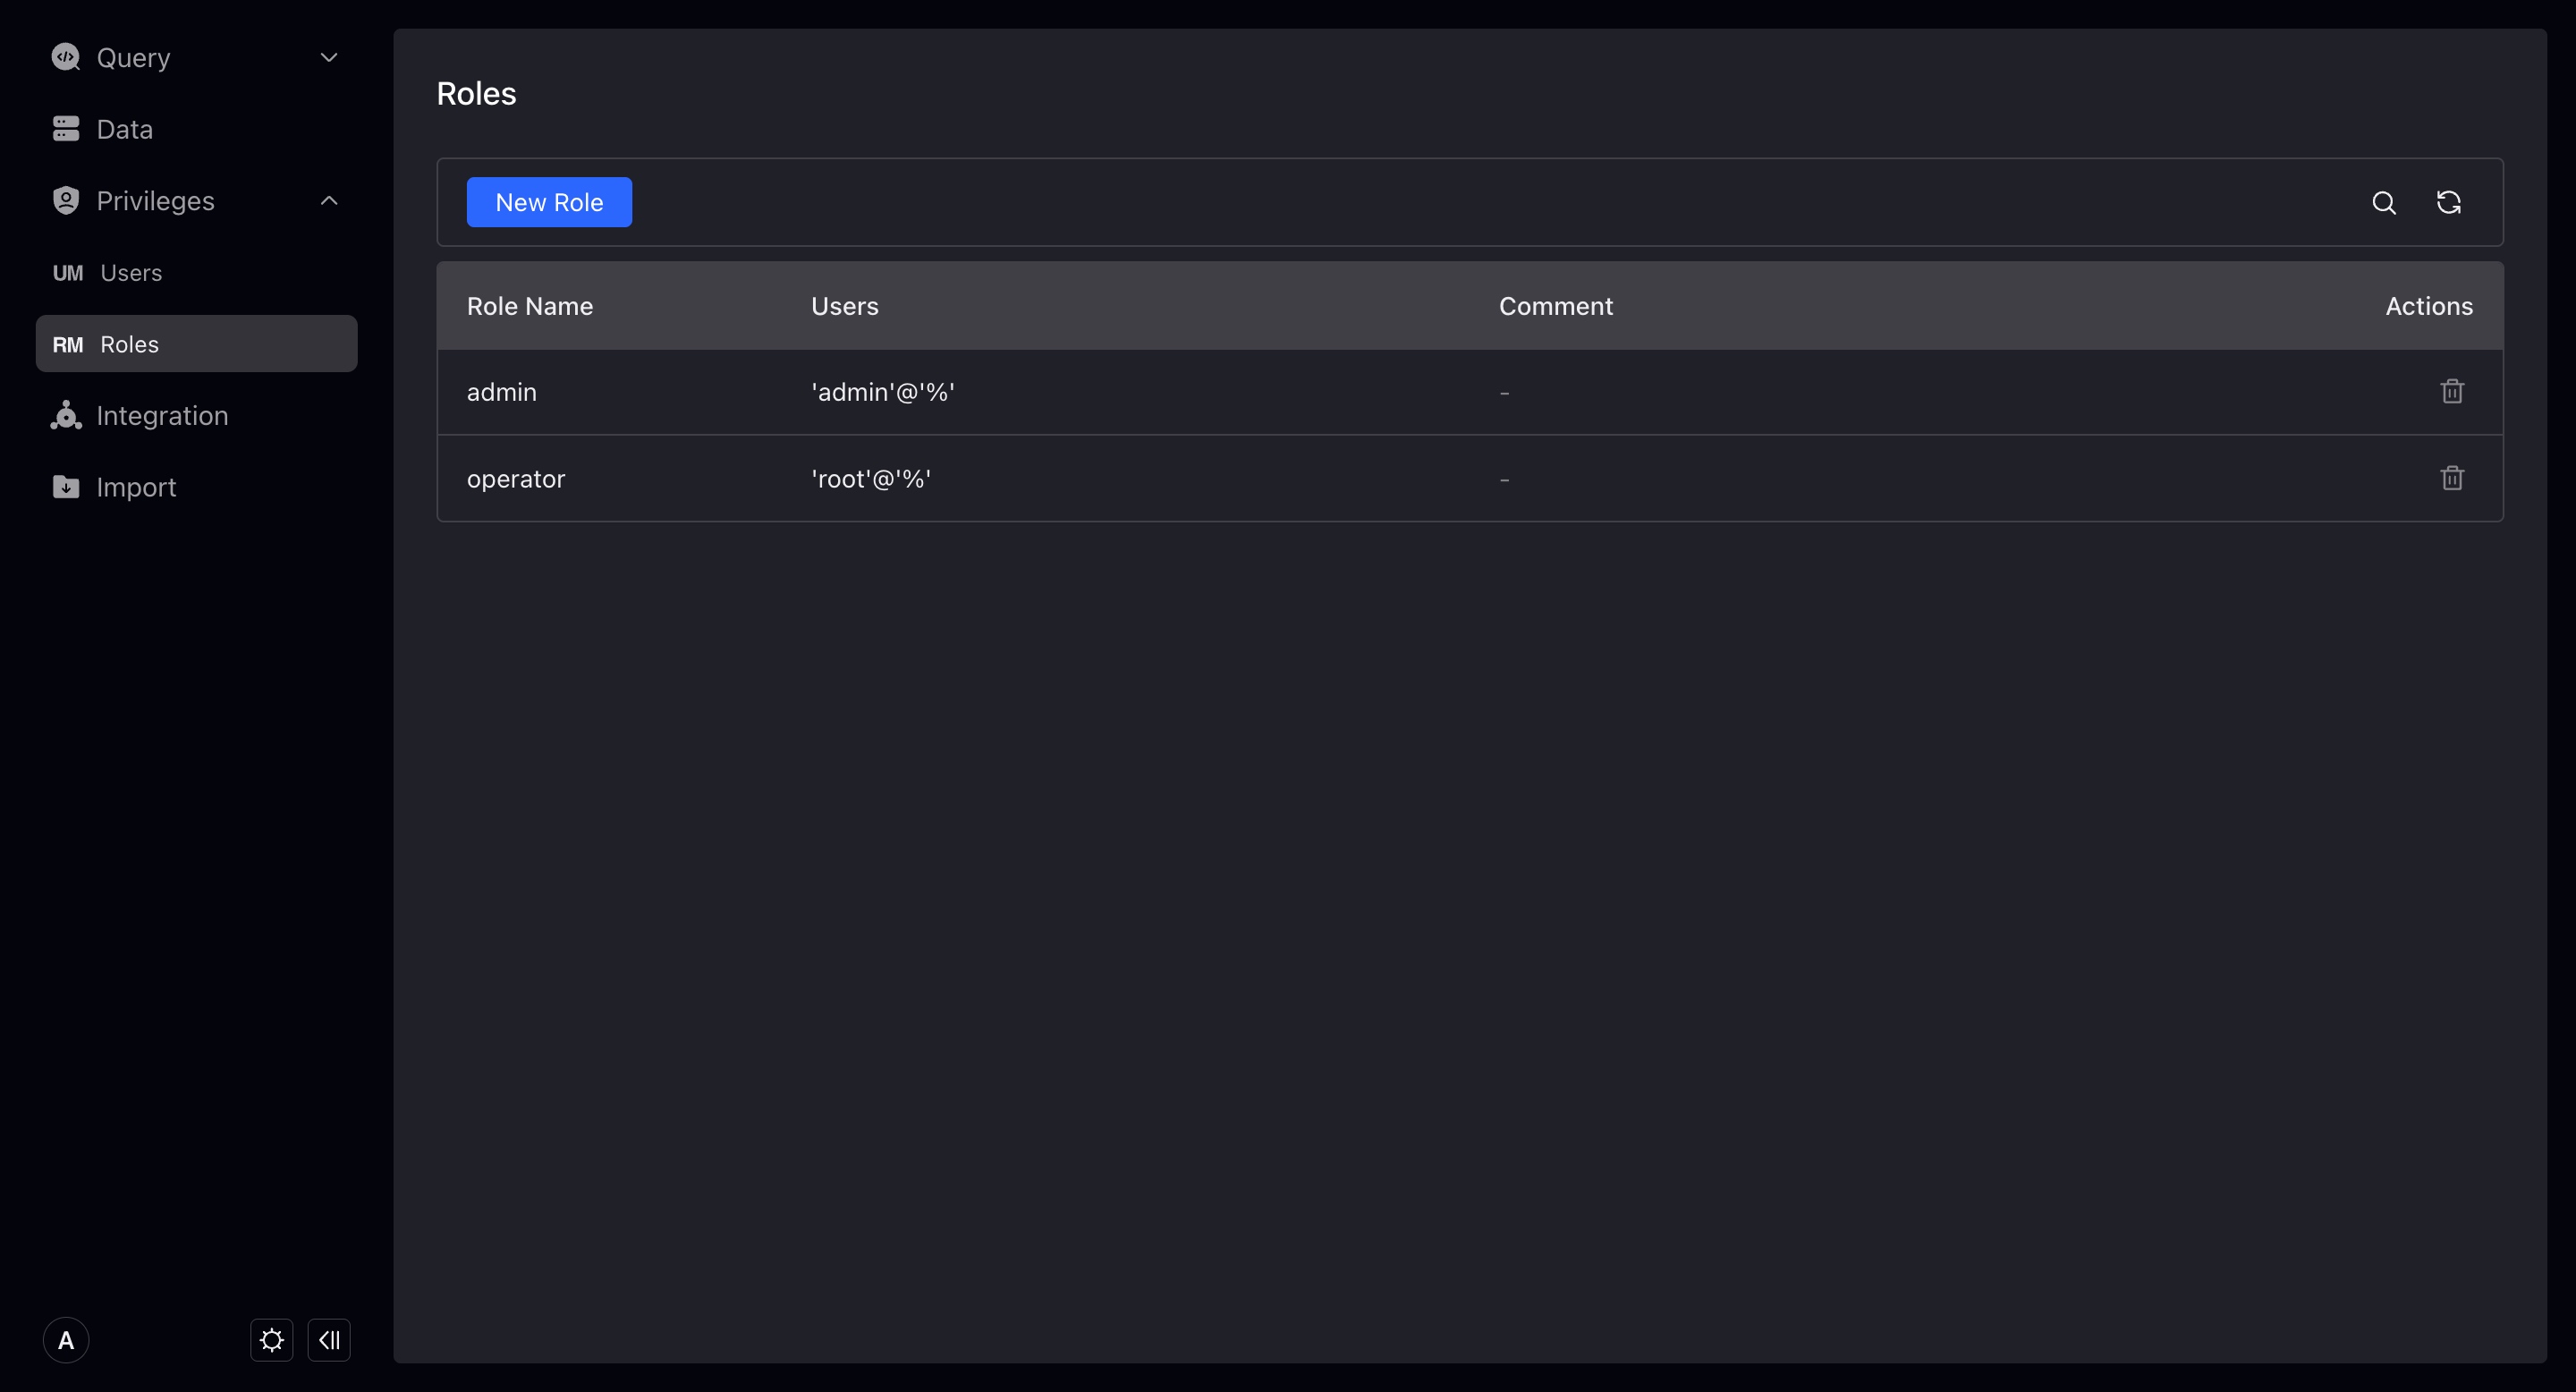
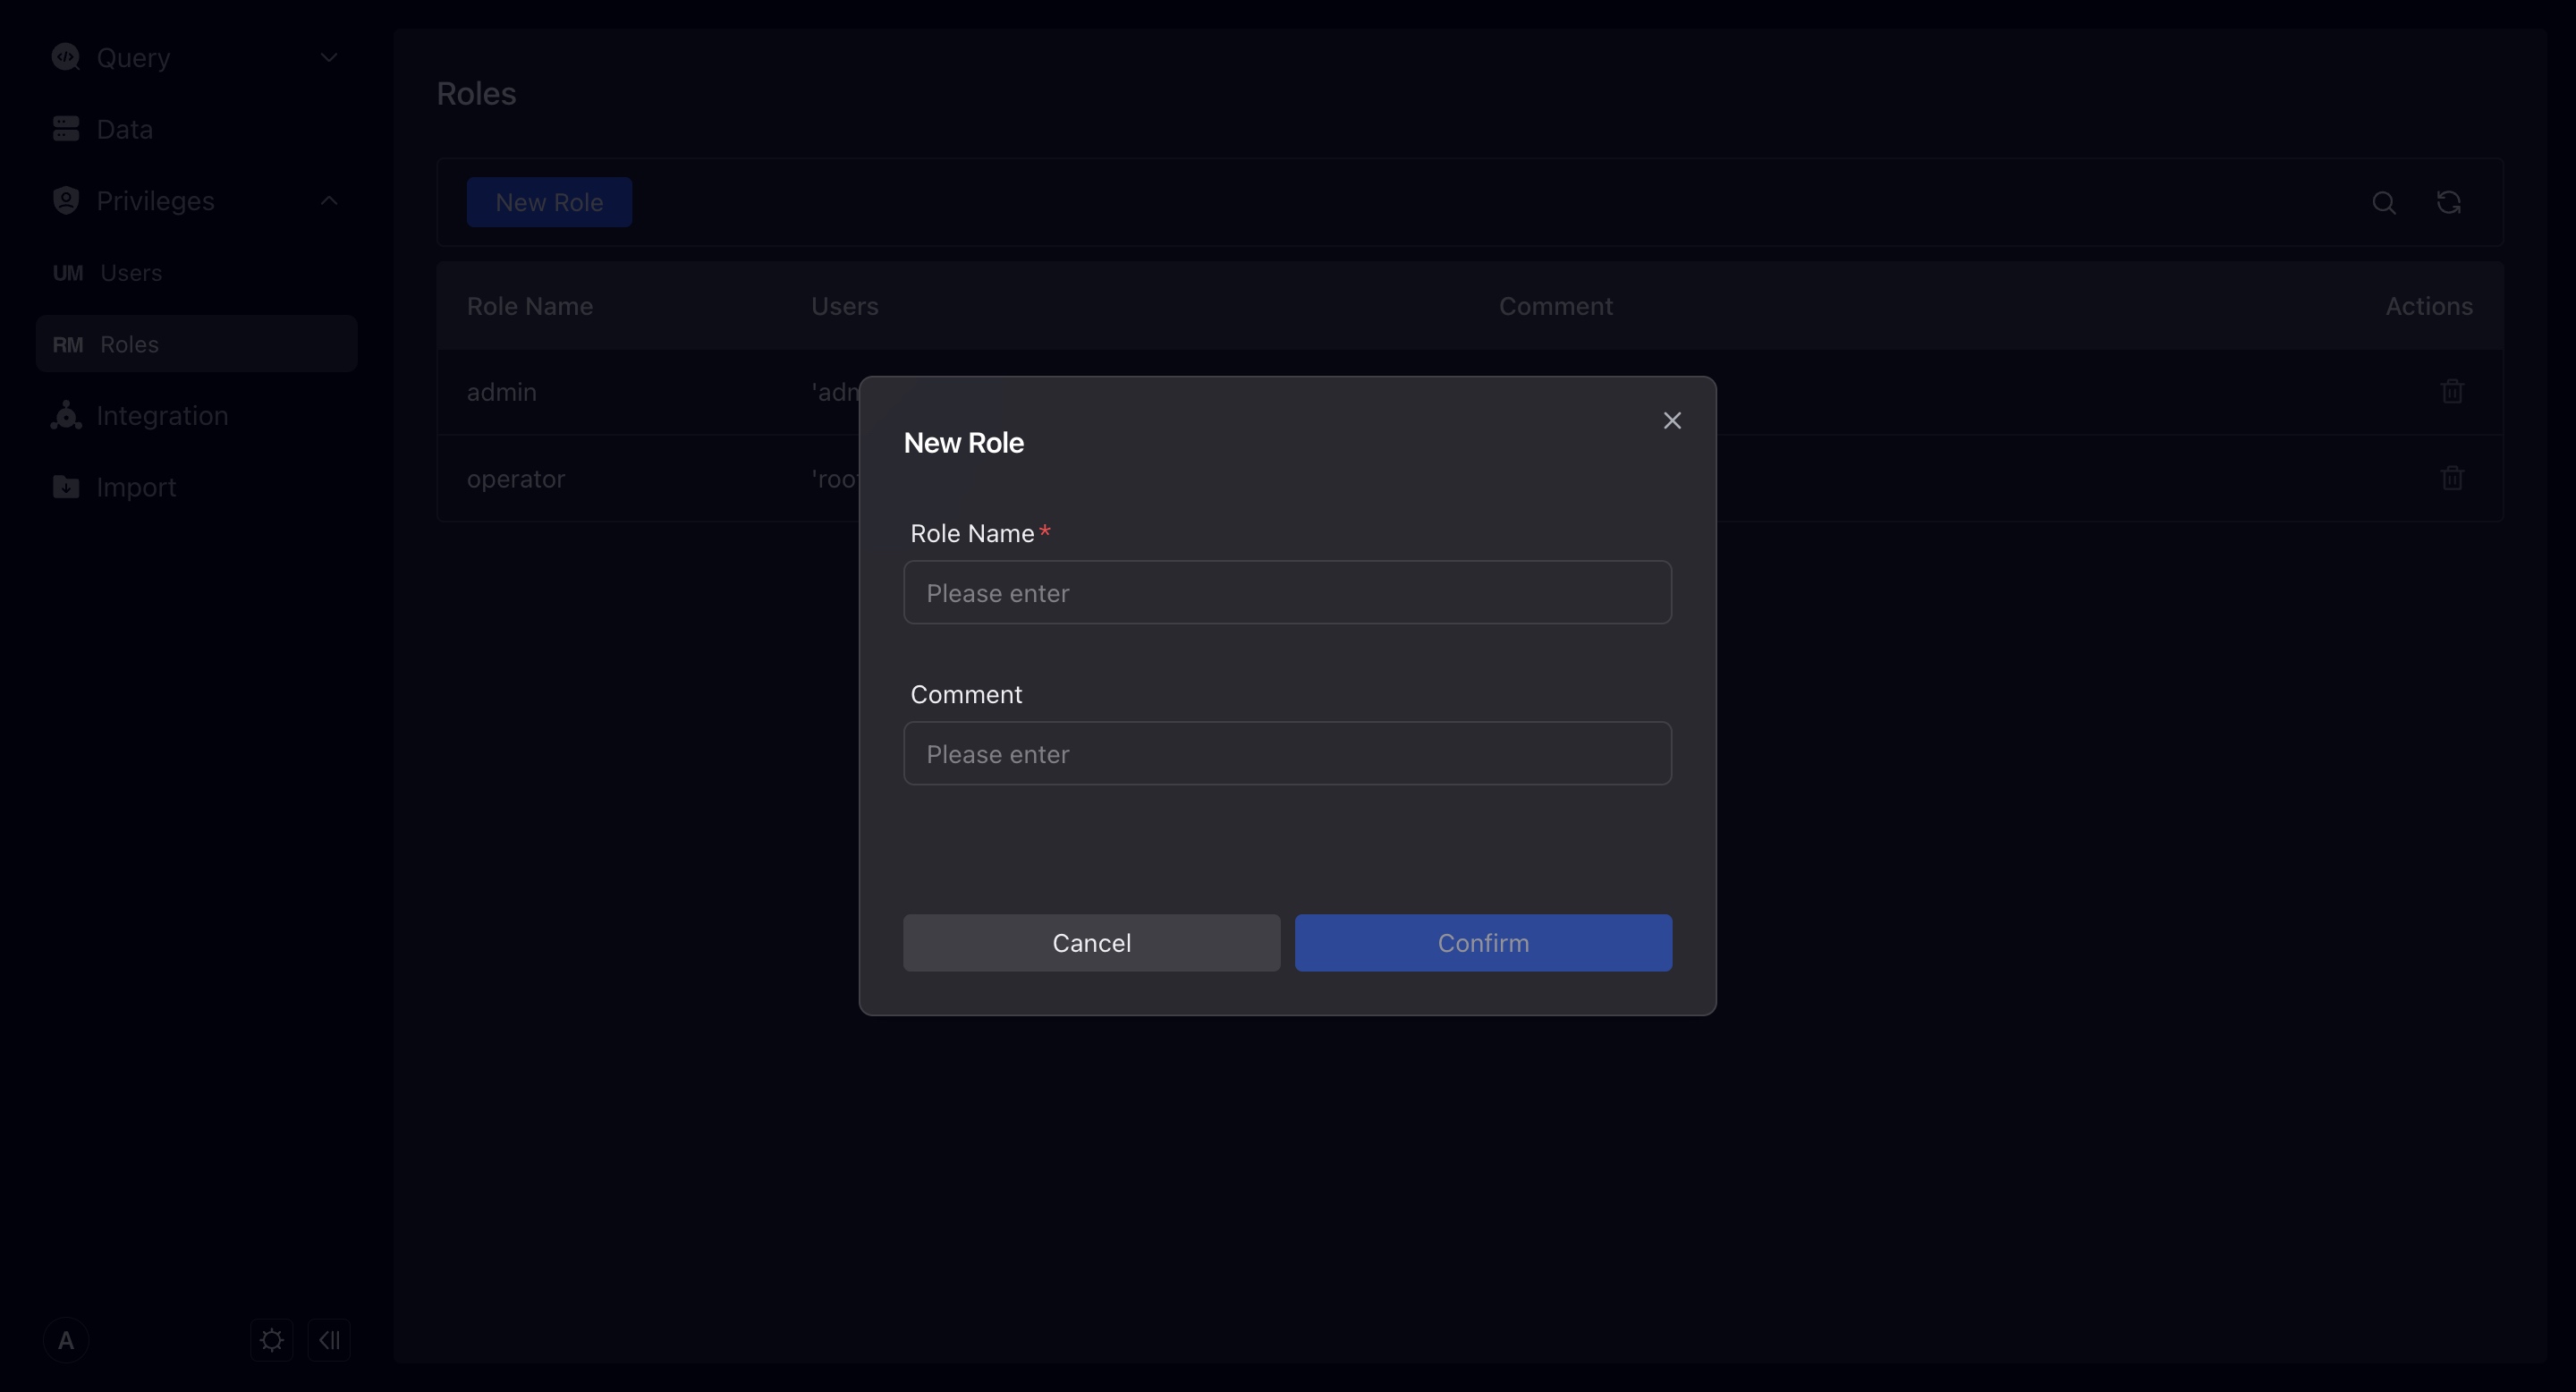
Role
Here you can manage the roles in VeloDB, and also perform authorized operations on the roles.
Only users with Admin permissions can add and modify other roles.
VeloDB currently does not support managing users under roles through roles, which means you need to specify your roles when creating or modifying users.
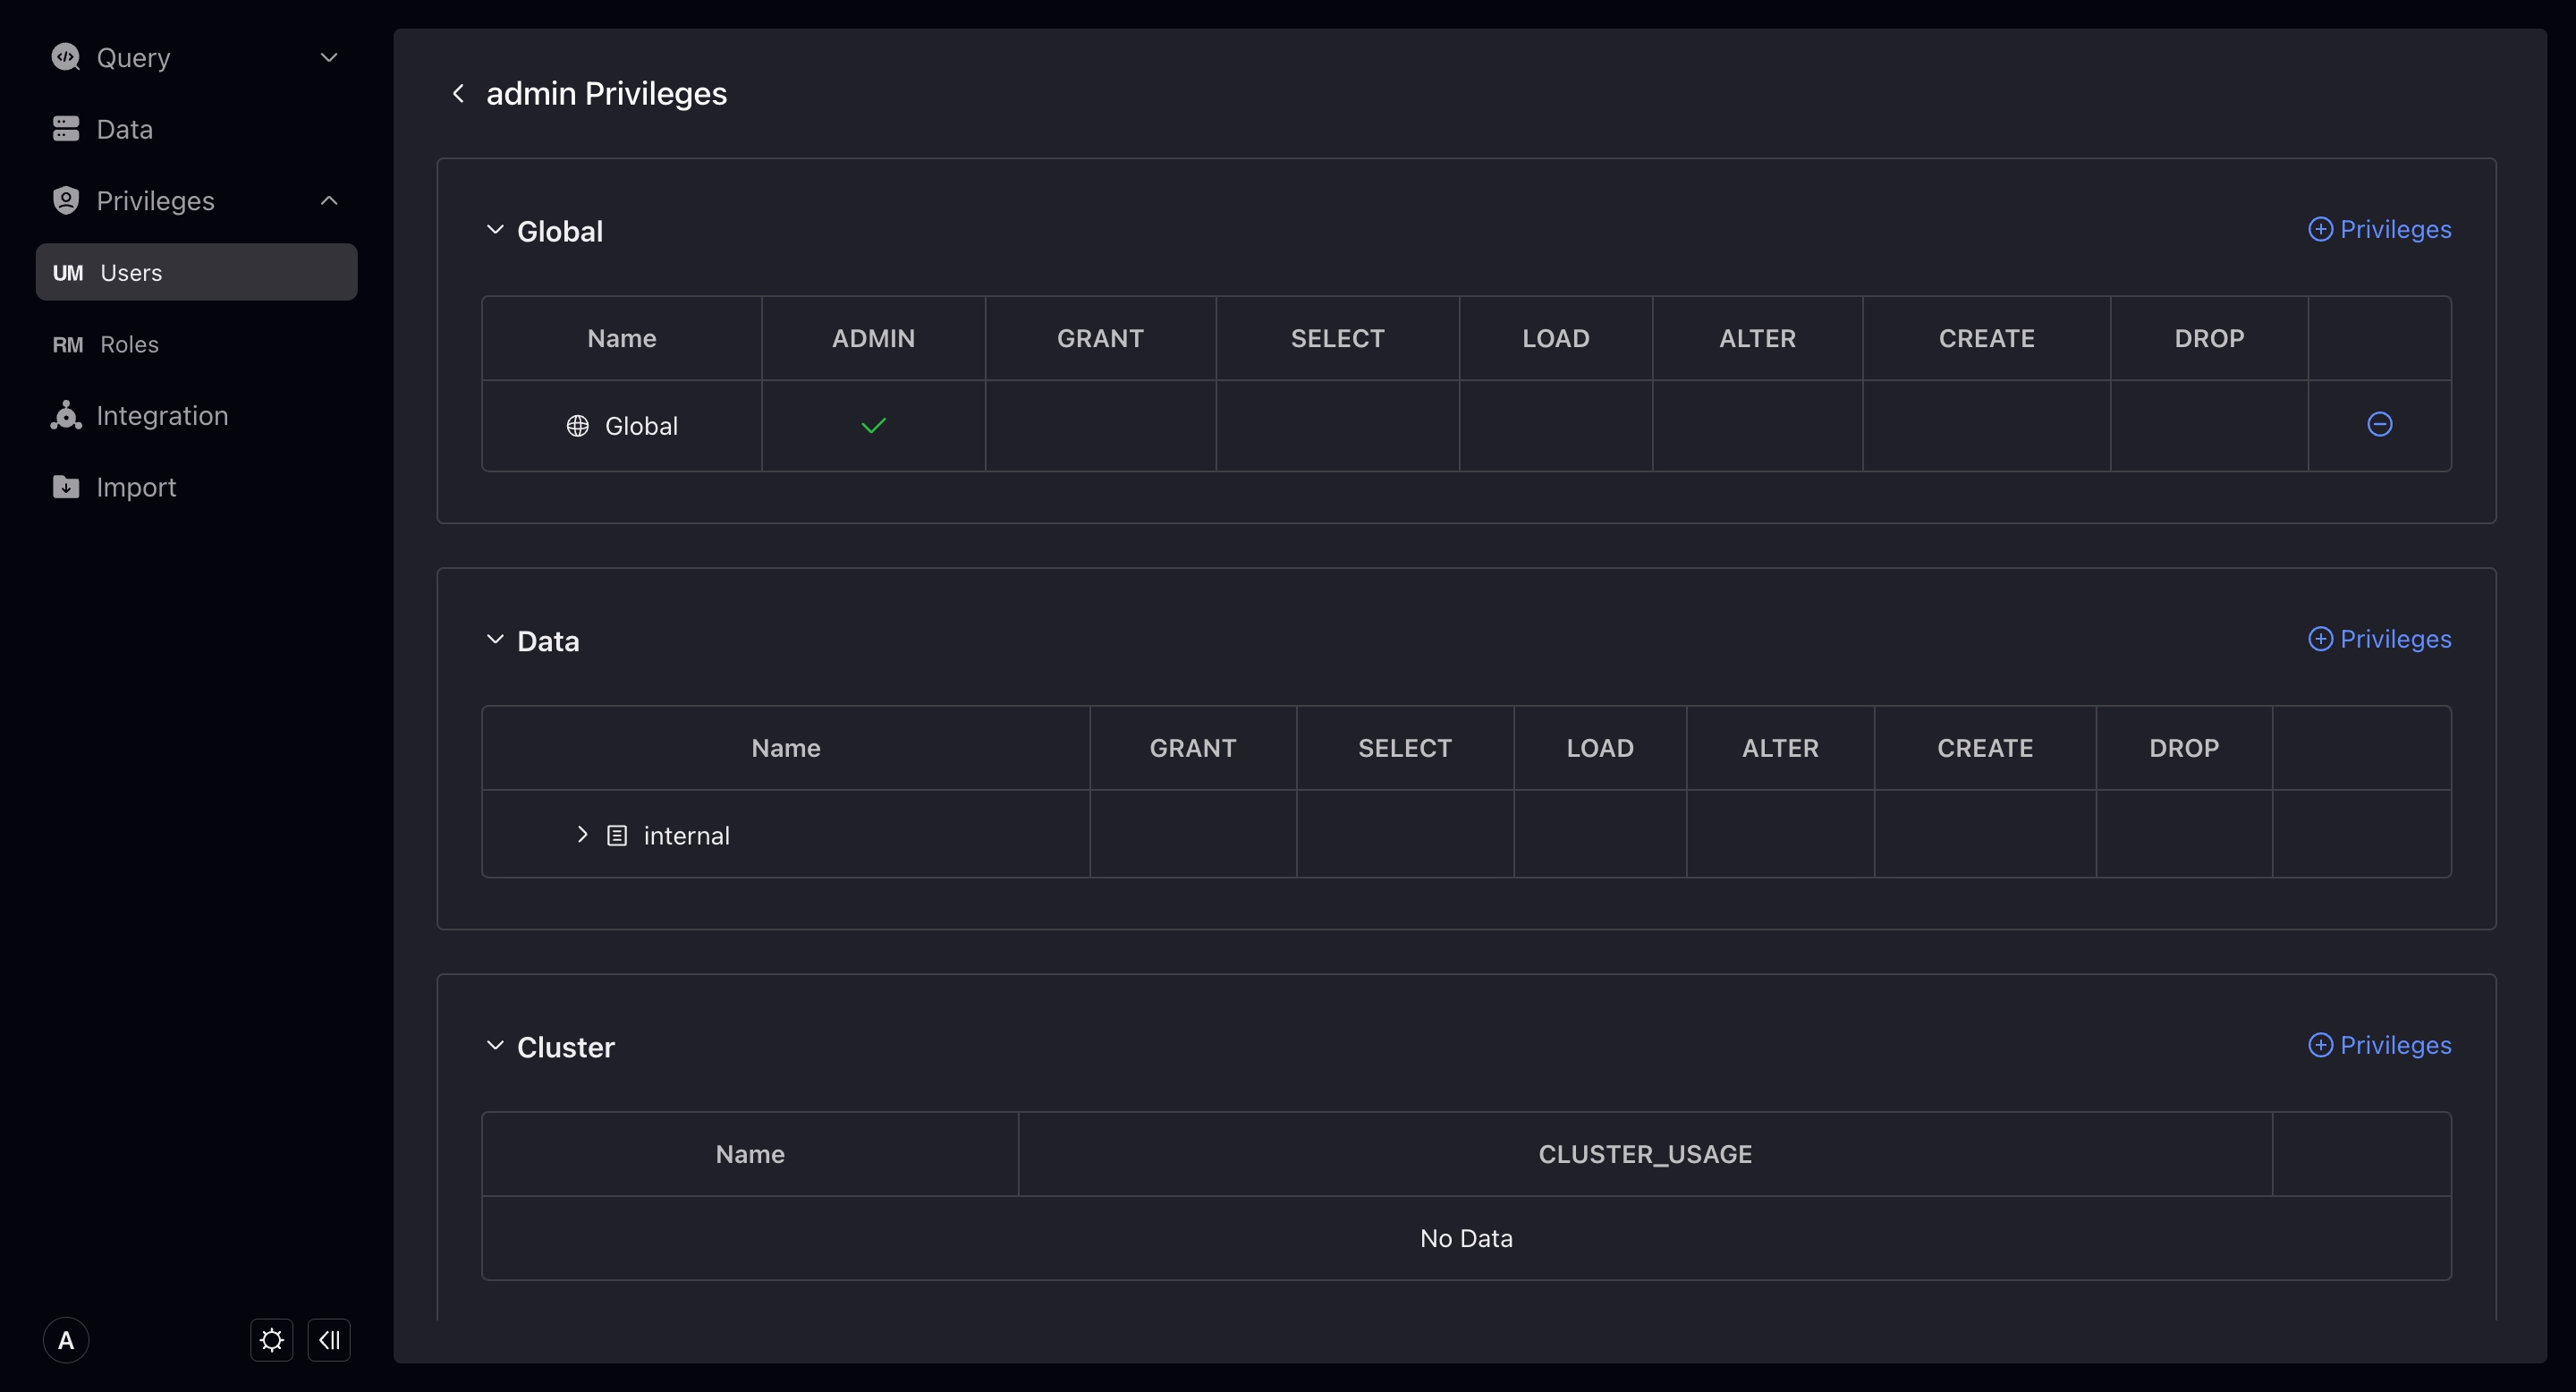
Authorize
On the user or role details page, click on the specific user or role name to enter the permission configuration page, and you can perform authorization/revocation operations. You need to have Admin or Grant permissions at the corresponding level in order to perform authorization/revocation.
In VeloDB, permissions are divided into the following categories:
- Global: Global permissions are permissions at the entire database level, with global permissions, and automatically have corresponding permissions for all corresponding objects in the database.
- Data: refers to the permissions of data resources. You can authorize them according to the level, have the permissions at the parent level, and automatically have the corresponding permissions of its children's content.
- Workload Group: Usage permissions only.
- Resource: It is the permission of Resource, including Grant and Usage.
- Compute Group: The memory separation cluster exists in VeloDB 3.0 and controls the Usage permissions of different computing groups.
- Cluster: Exist in VeloDB Cloud connections, controlling Usage permissions for different clusters.
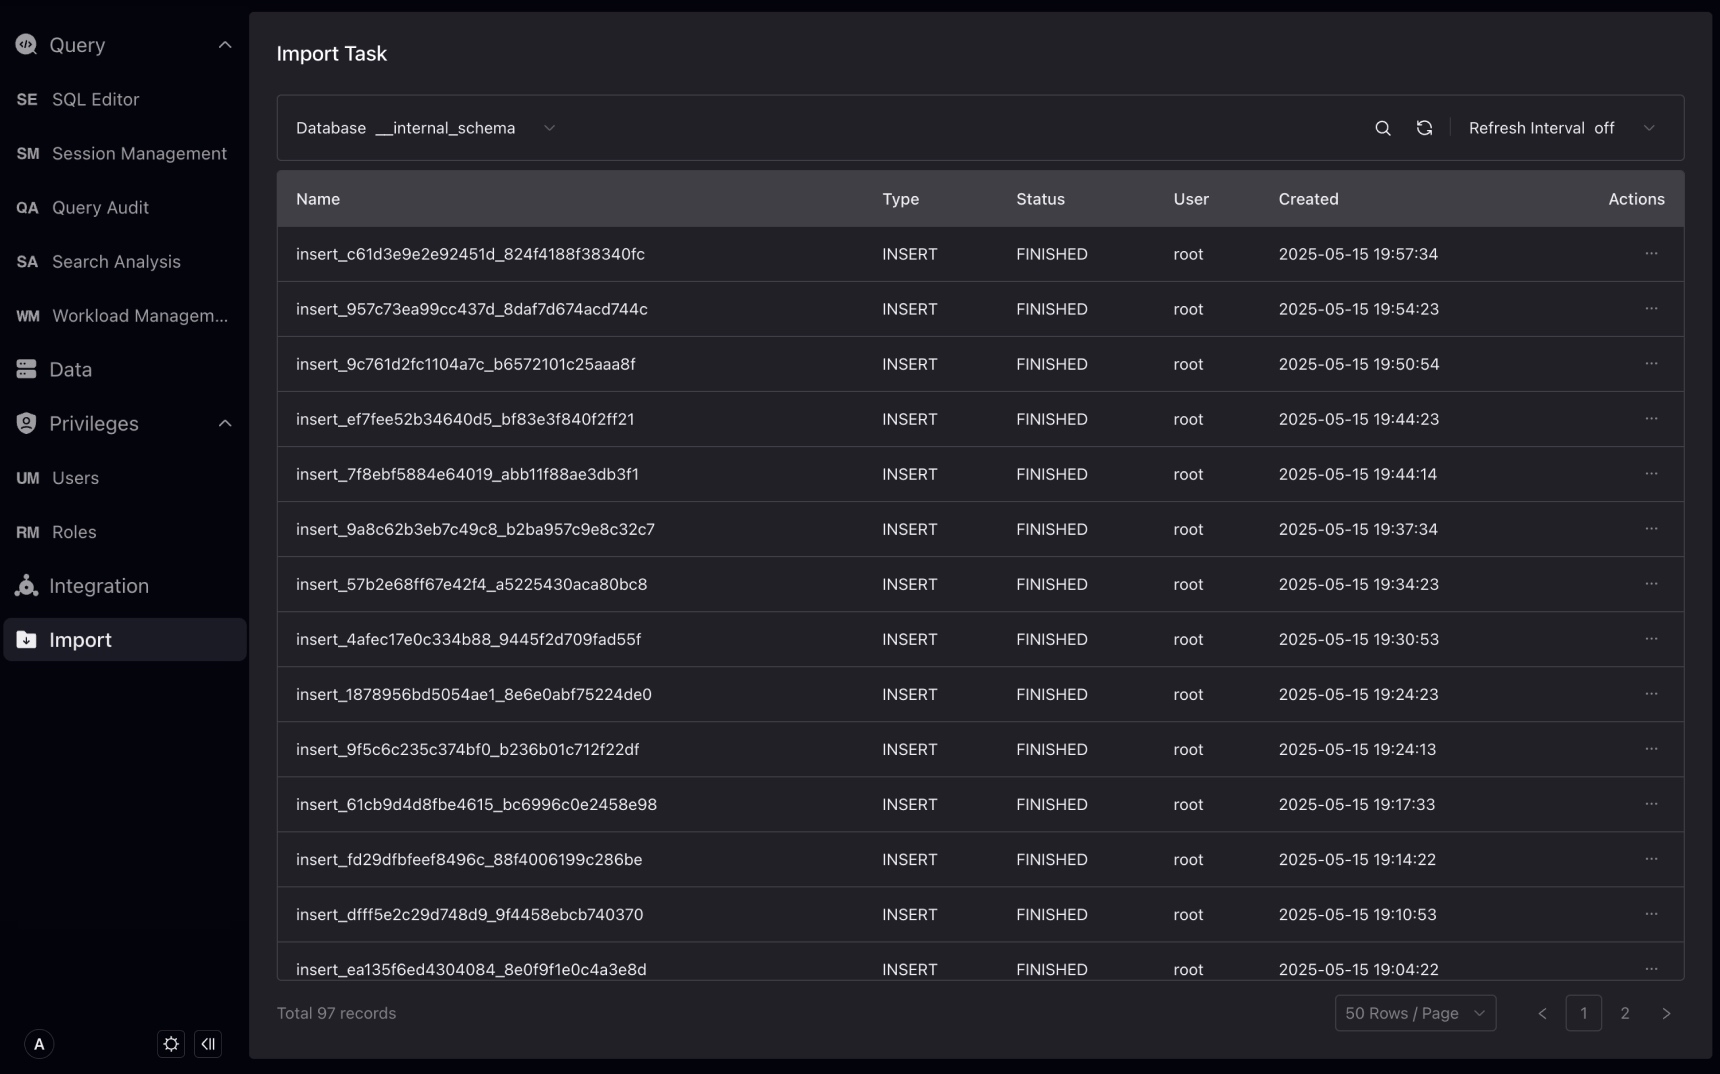
Import
VeloDB Studio supports the management of load tasks such as Stream Load, Routine Load, Broker Load, and Insert Into in connection, and currently supports the following operations:
- Information query for load tasks
- Stop Routine Load, Broker Load, Insert Into
- Pause/Edit/Recover Routine Load
You first select a database and then view all load tasks under that database in the load task list.
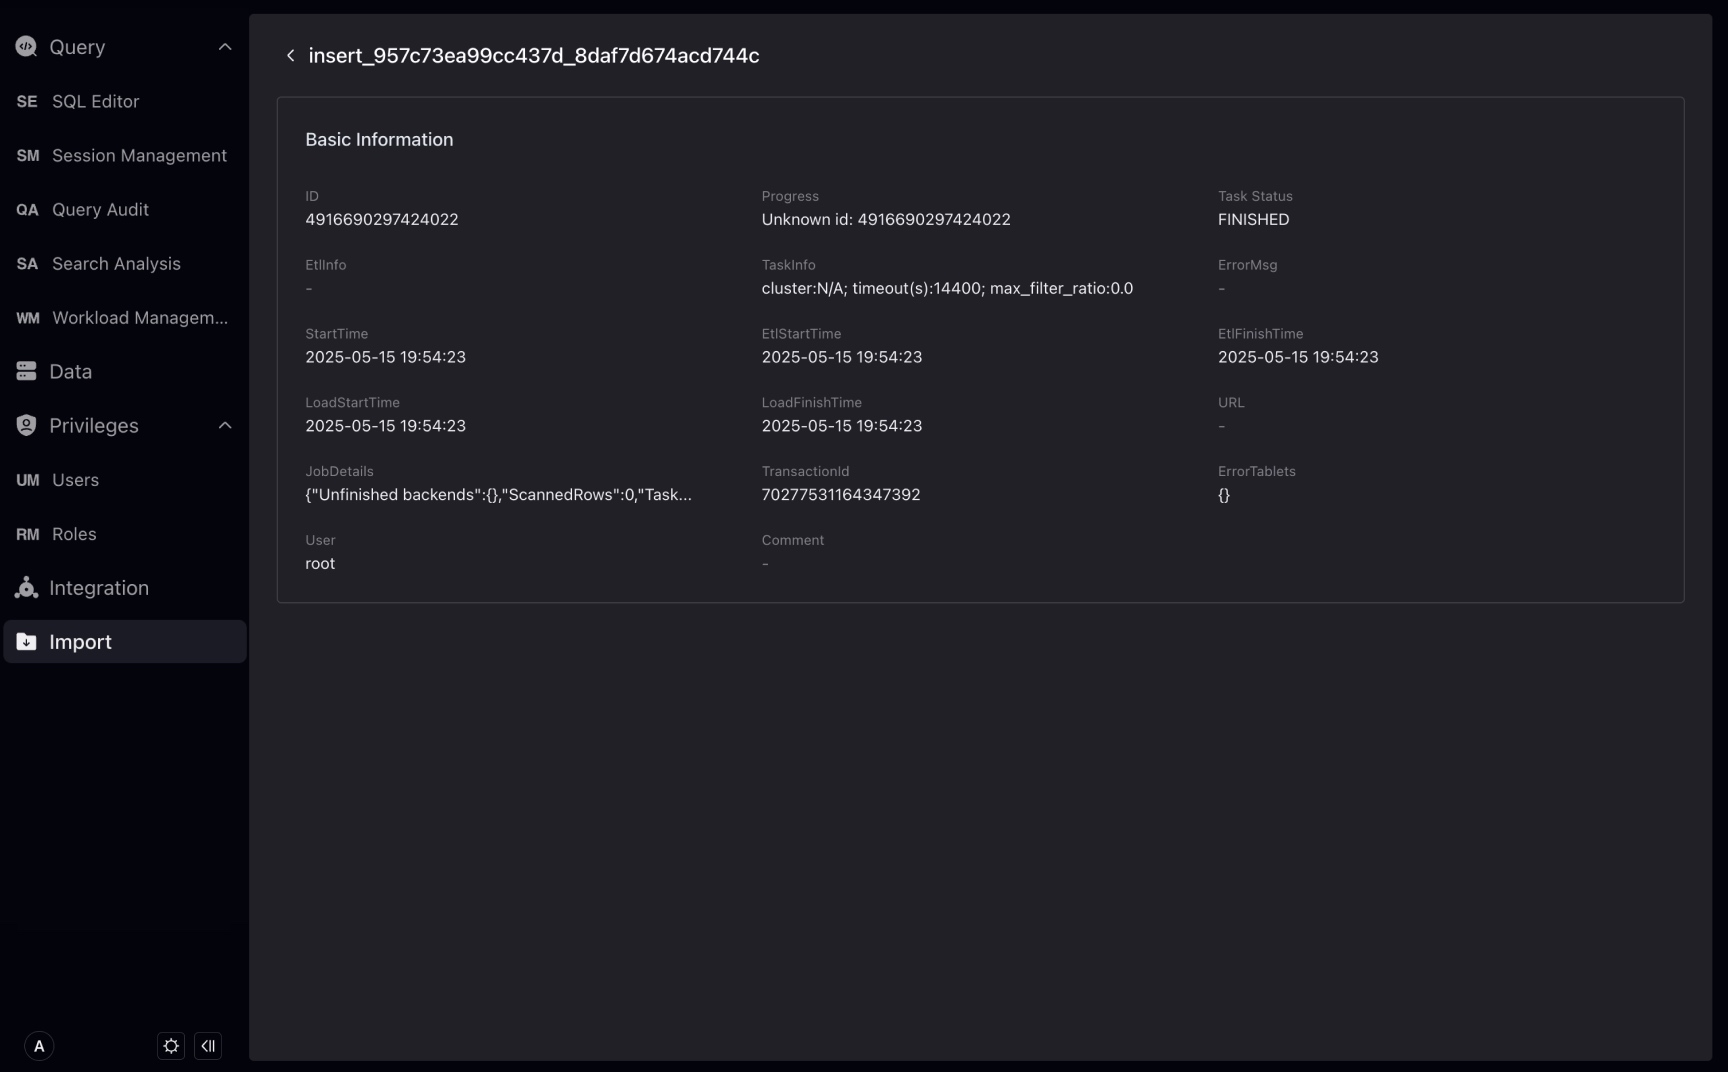
Click the load task name to view the detailed information of the load task.
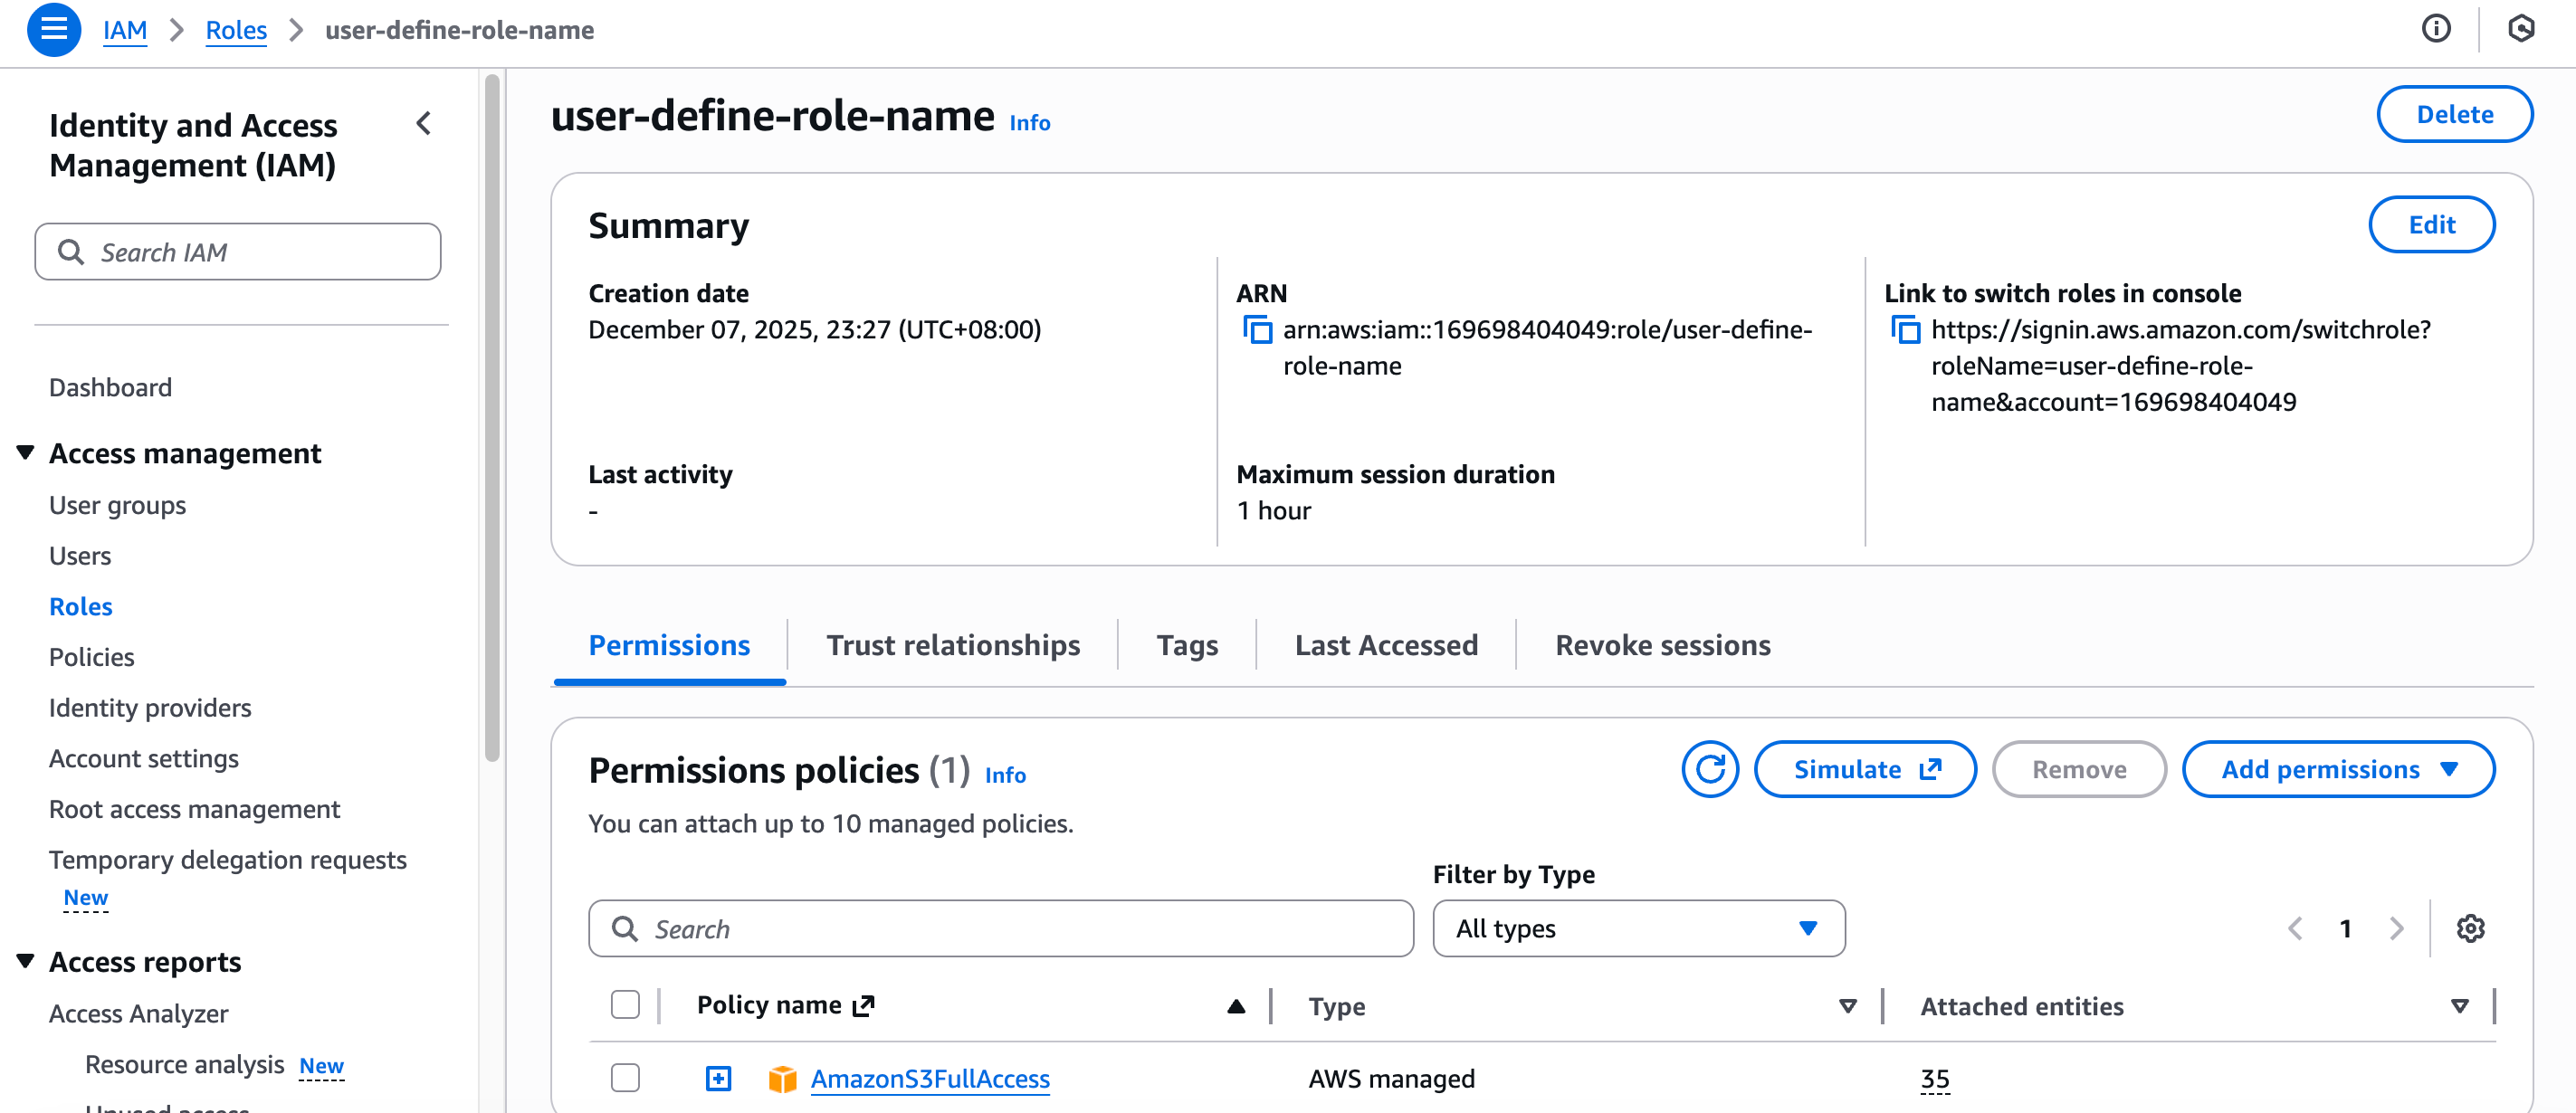
IAM Role Setup Guide (AWS)
Please use the following steps to create the role and add permissions in your AWS console:
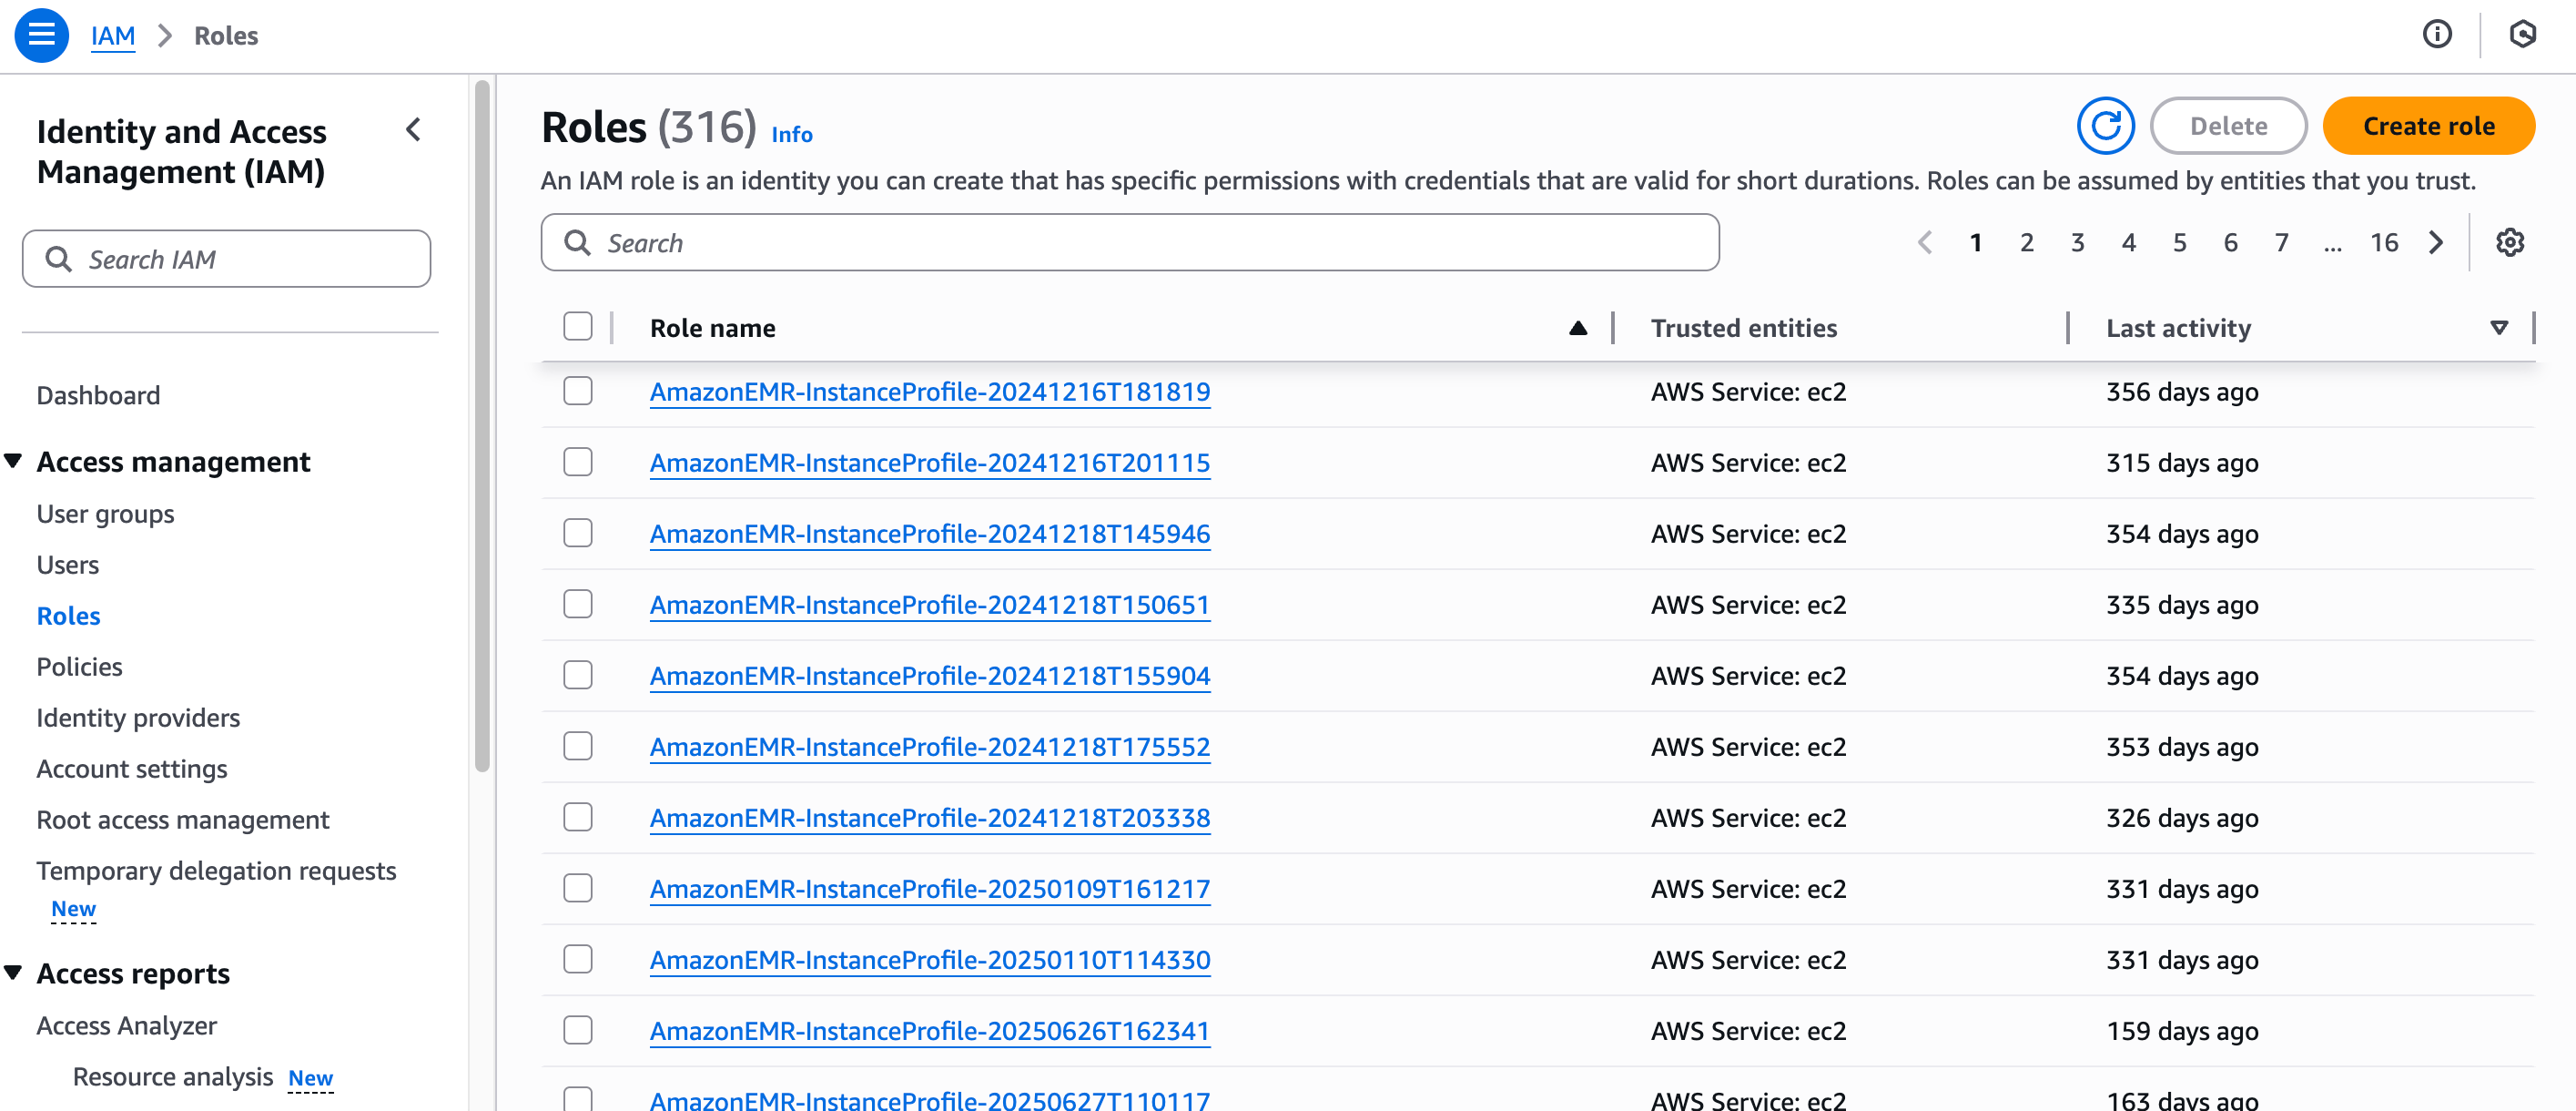
- Access the IAM service and select Roles from the menu. Click on the Create role button.
- Select Custom trust policy in the Select trusted entity section.
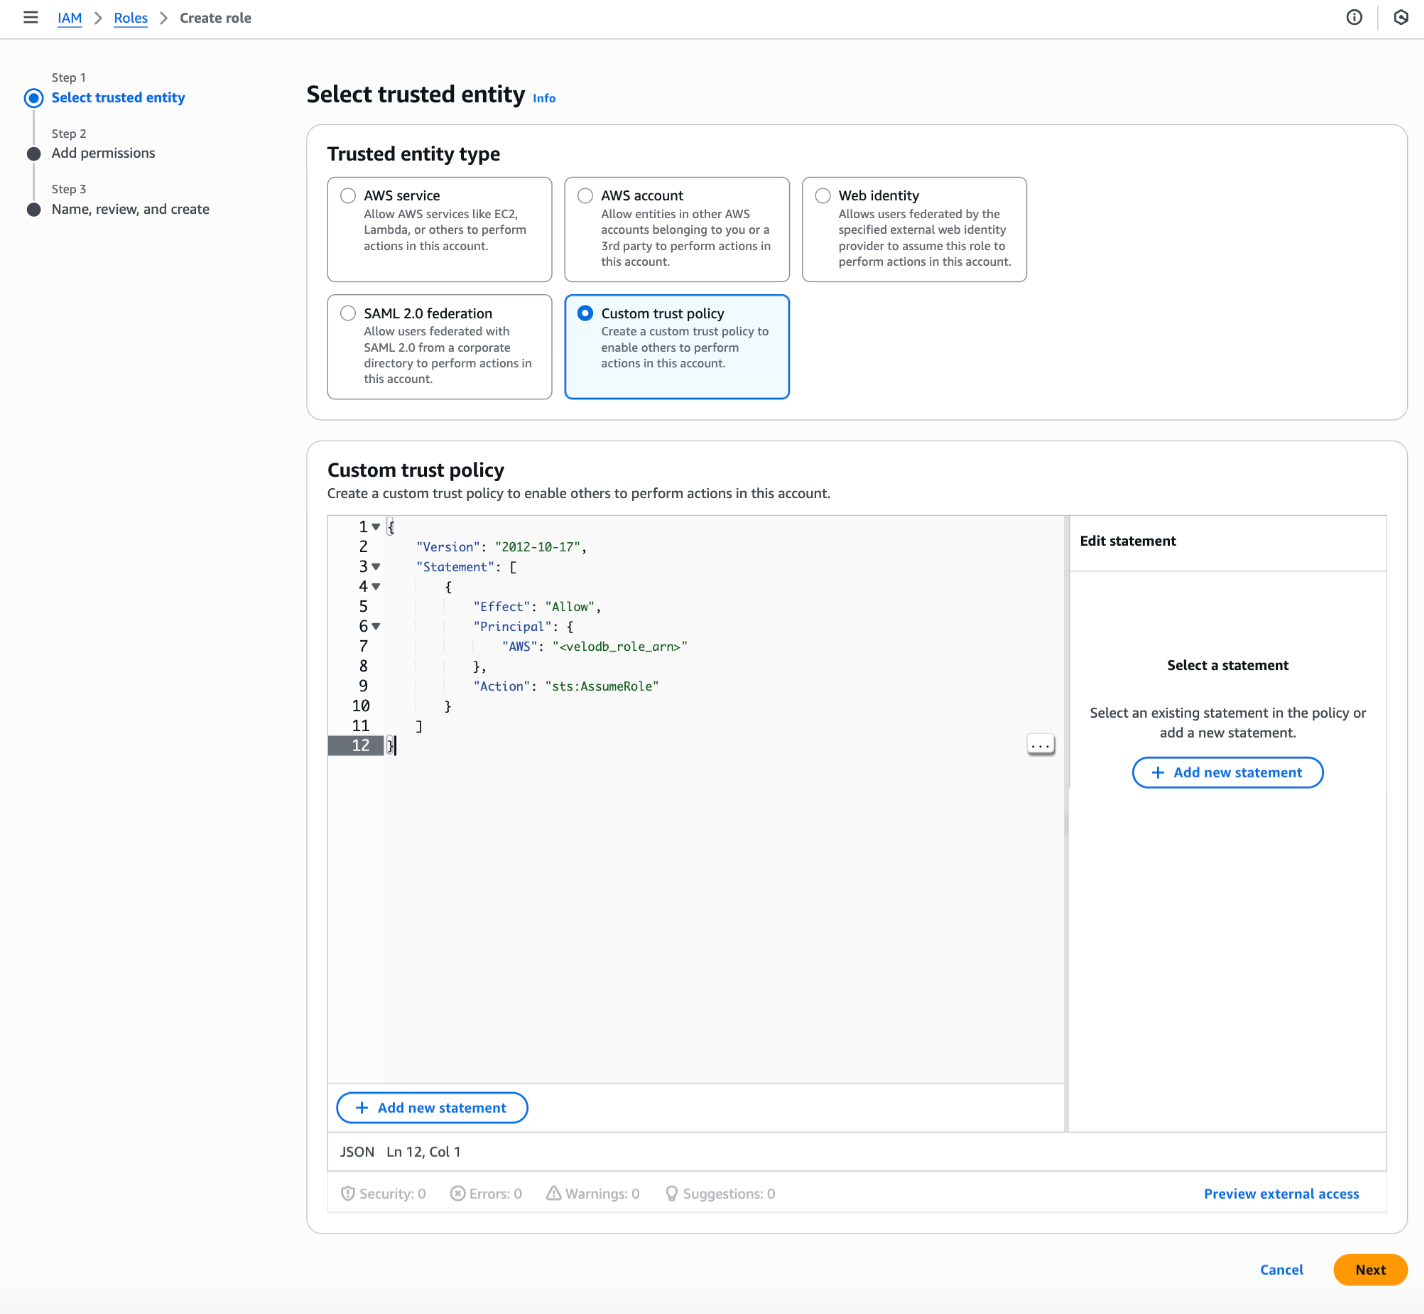 Replace the
 <velodb_role_arn> in the following trust policy with the actual IAM Role ARN of your VeloDB warehouse .
{
    "Version": "2012-10-17",
    "Statement": [
        {
            "Effect": "Allow",
            "Principal": {
                "AWS": "<velodb_role_arn>"
            },
            "Action": "sts:AssumeRole"
        }
    ]
}
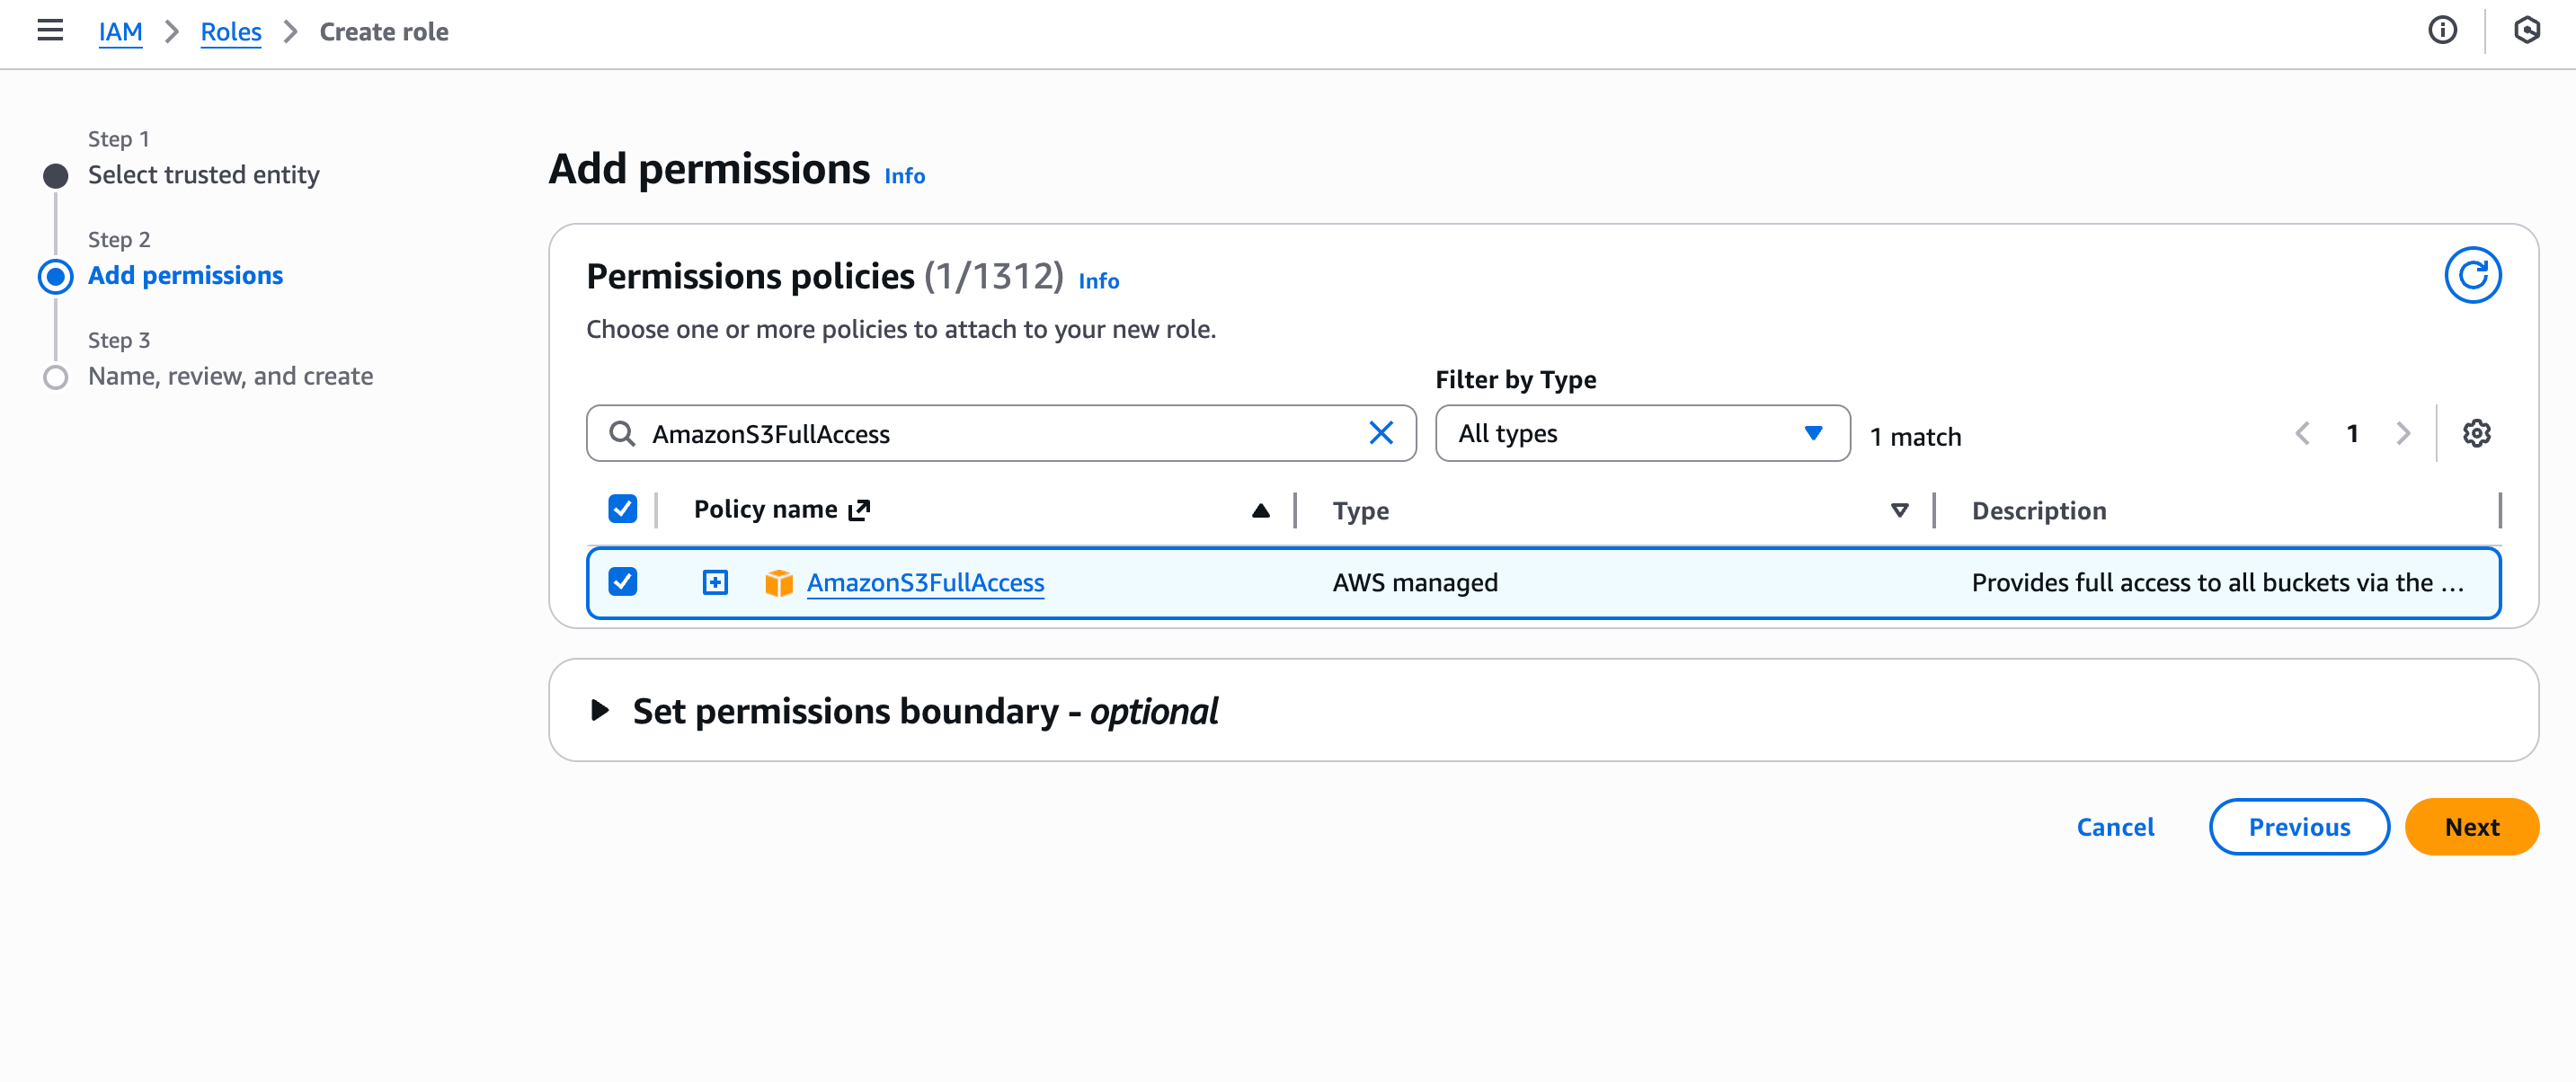
- Select the permission policies you would like to attach to the role. Click on the Next button.
- Config Role name,and click on the Create role button to finish.
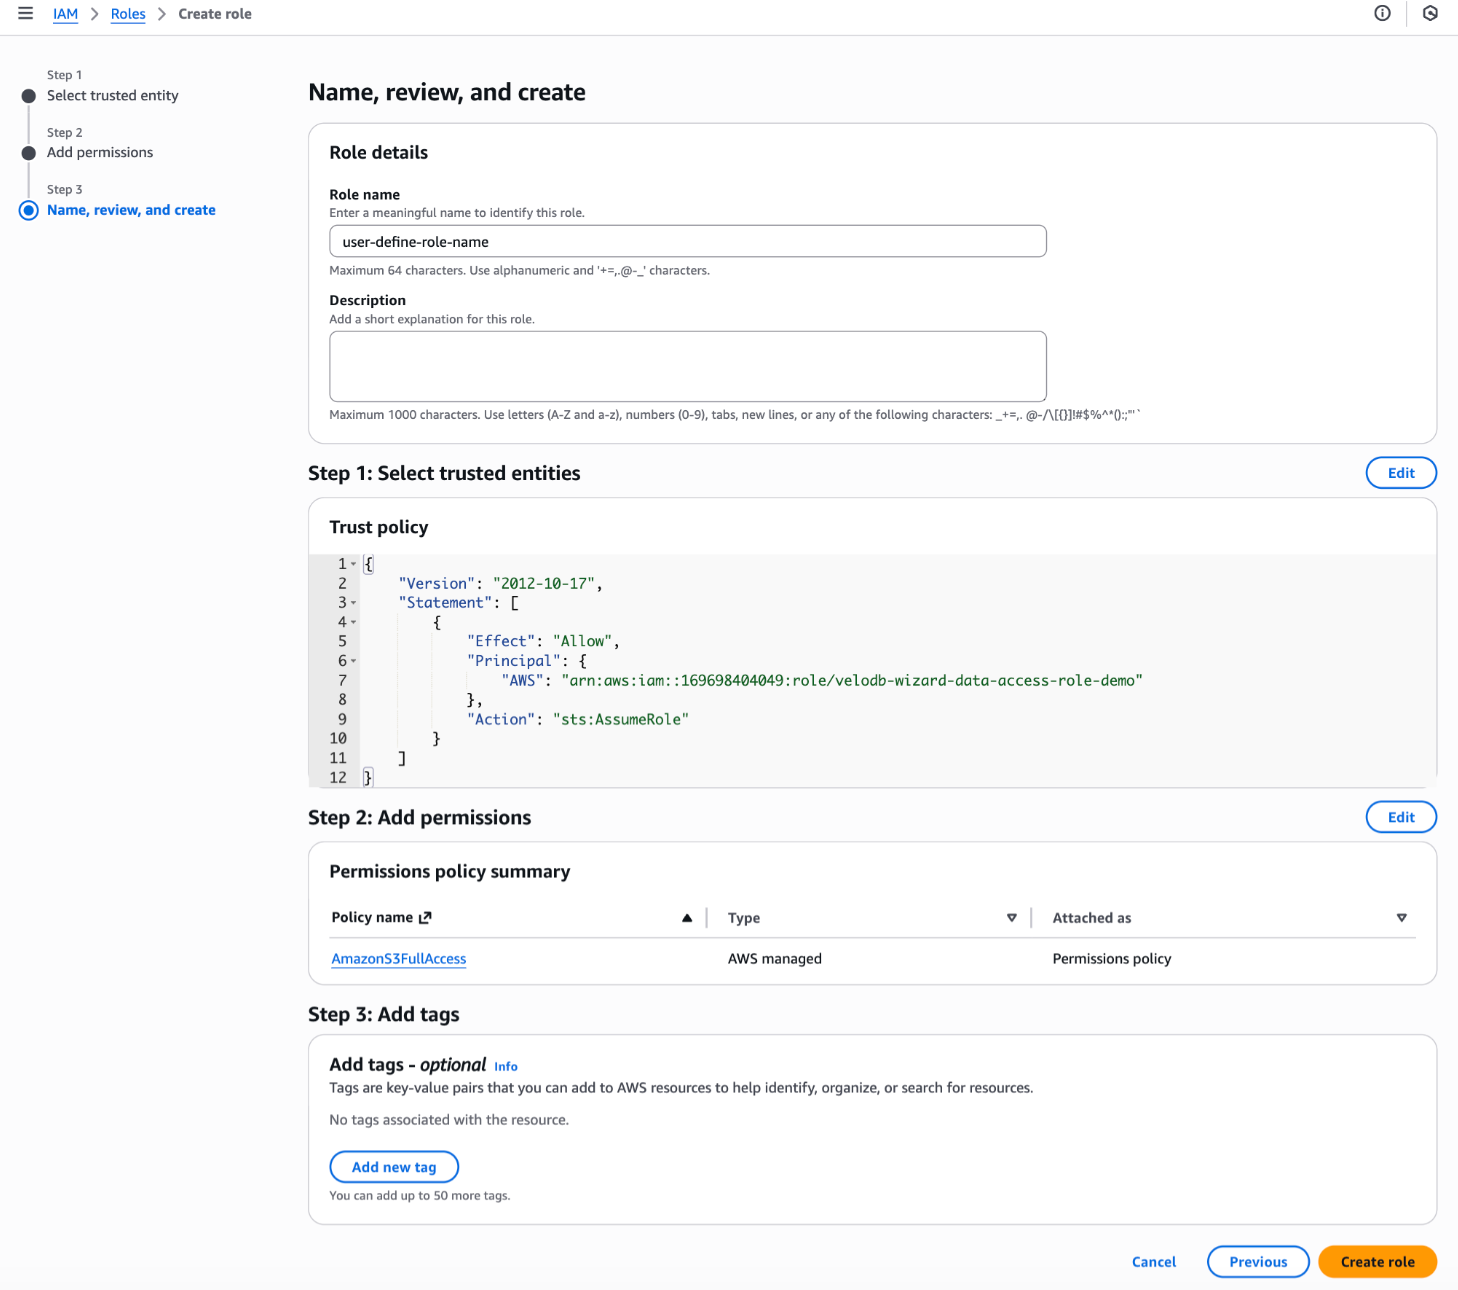 5. Click on the role name in the list of roles. Copy the value of the ARN from the Summary section to provide the value in VeloDB Cloud.