Monitoring Overview
VeloDB Cloud provides monitoring and alerting so that you can track the health and performance of your warehouse or clusters and make adjustments.
You can find the Metrics feature on the navigation bar, and you can
- View metrics by warehouse or cluster.
- Use Starred to display the metrics of interest in warehouse or different clusters together.
- View historical metric data by adjusting the time selector, and you can view metric data of the past 15 days.
- Use the auto-refresh feature to update metrics in real-time (5s).
The metrics you can use in VeloDB Cloud fall into two categories.
- Basic Metrics - Basic metrics data helps you monitor physical aspects of your cluster, such as CPU usage, memory usage, and network throughput.
- Service Metrics - Query performance data helps you monitor warehouse or cluster activity and performance, such as QPS, query success rates, and more. It helps to understand the specific workload of the cluster.
Basic Metrics
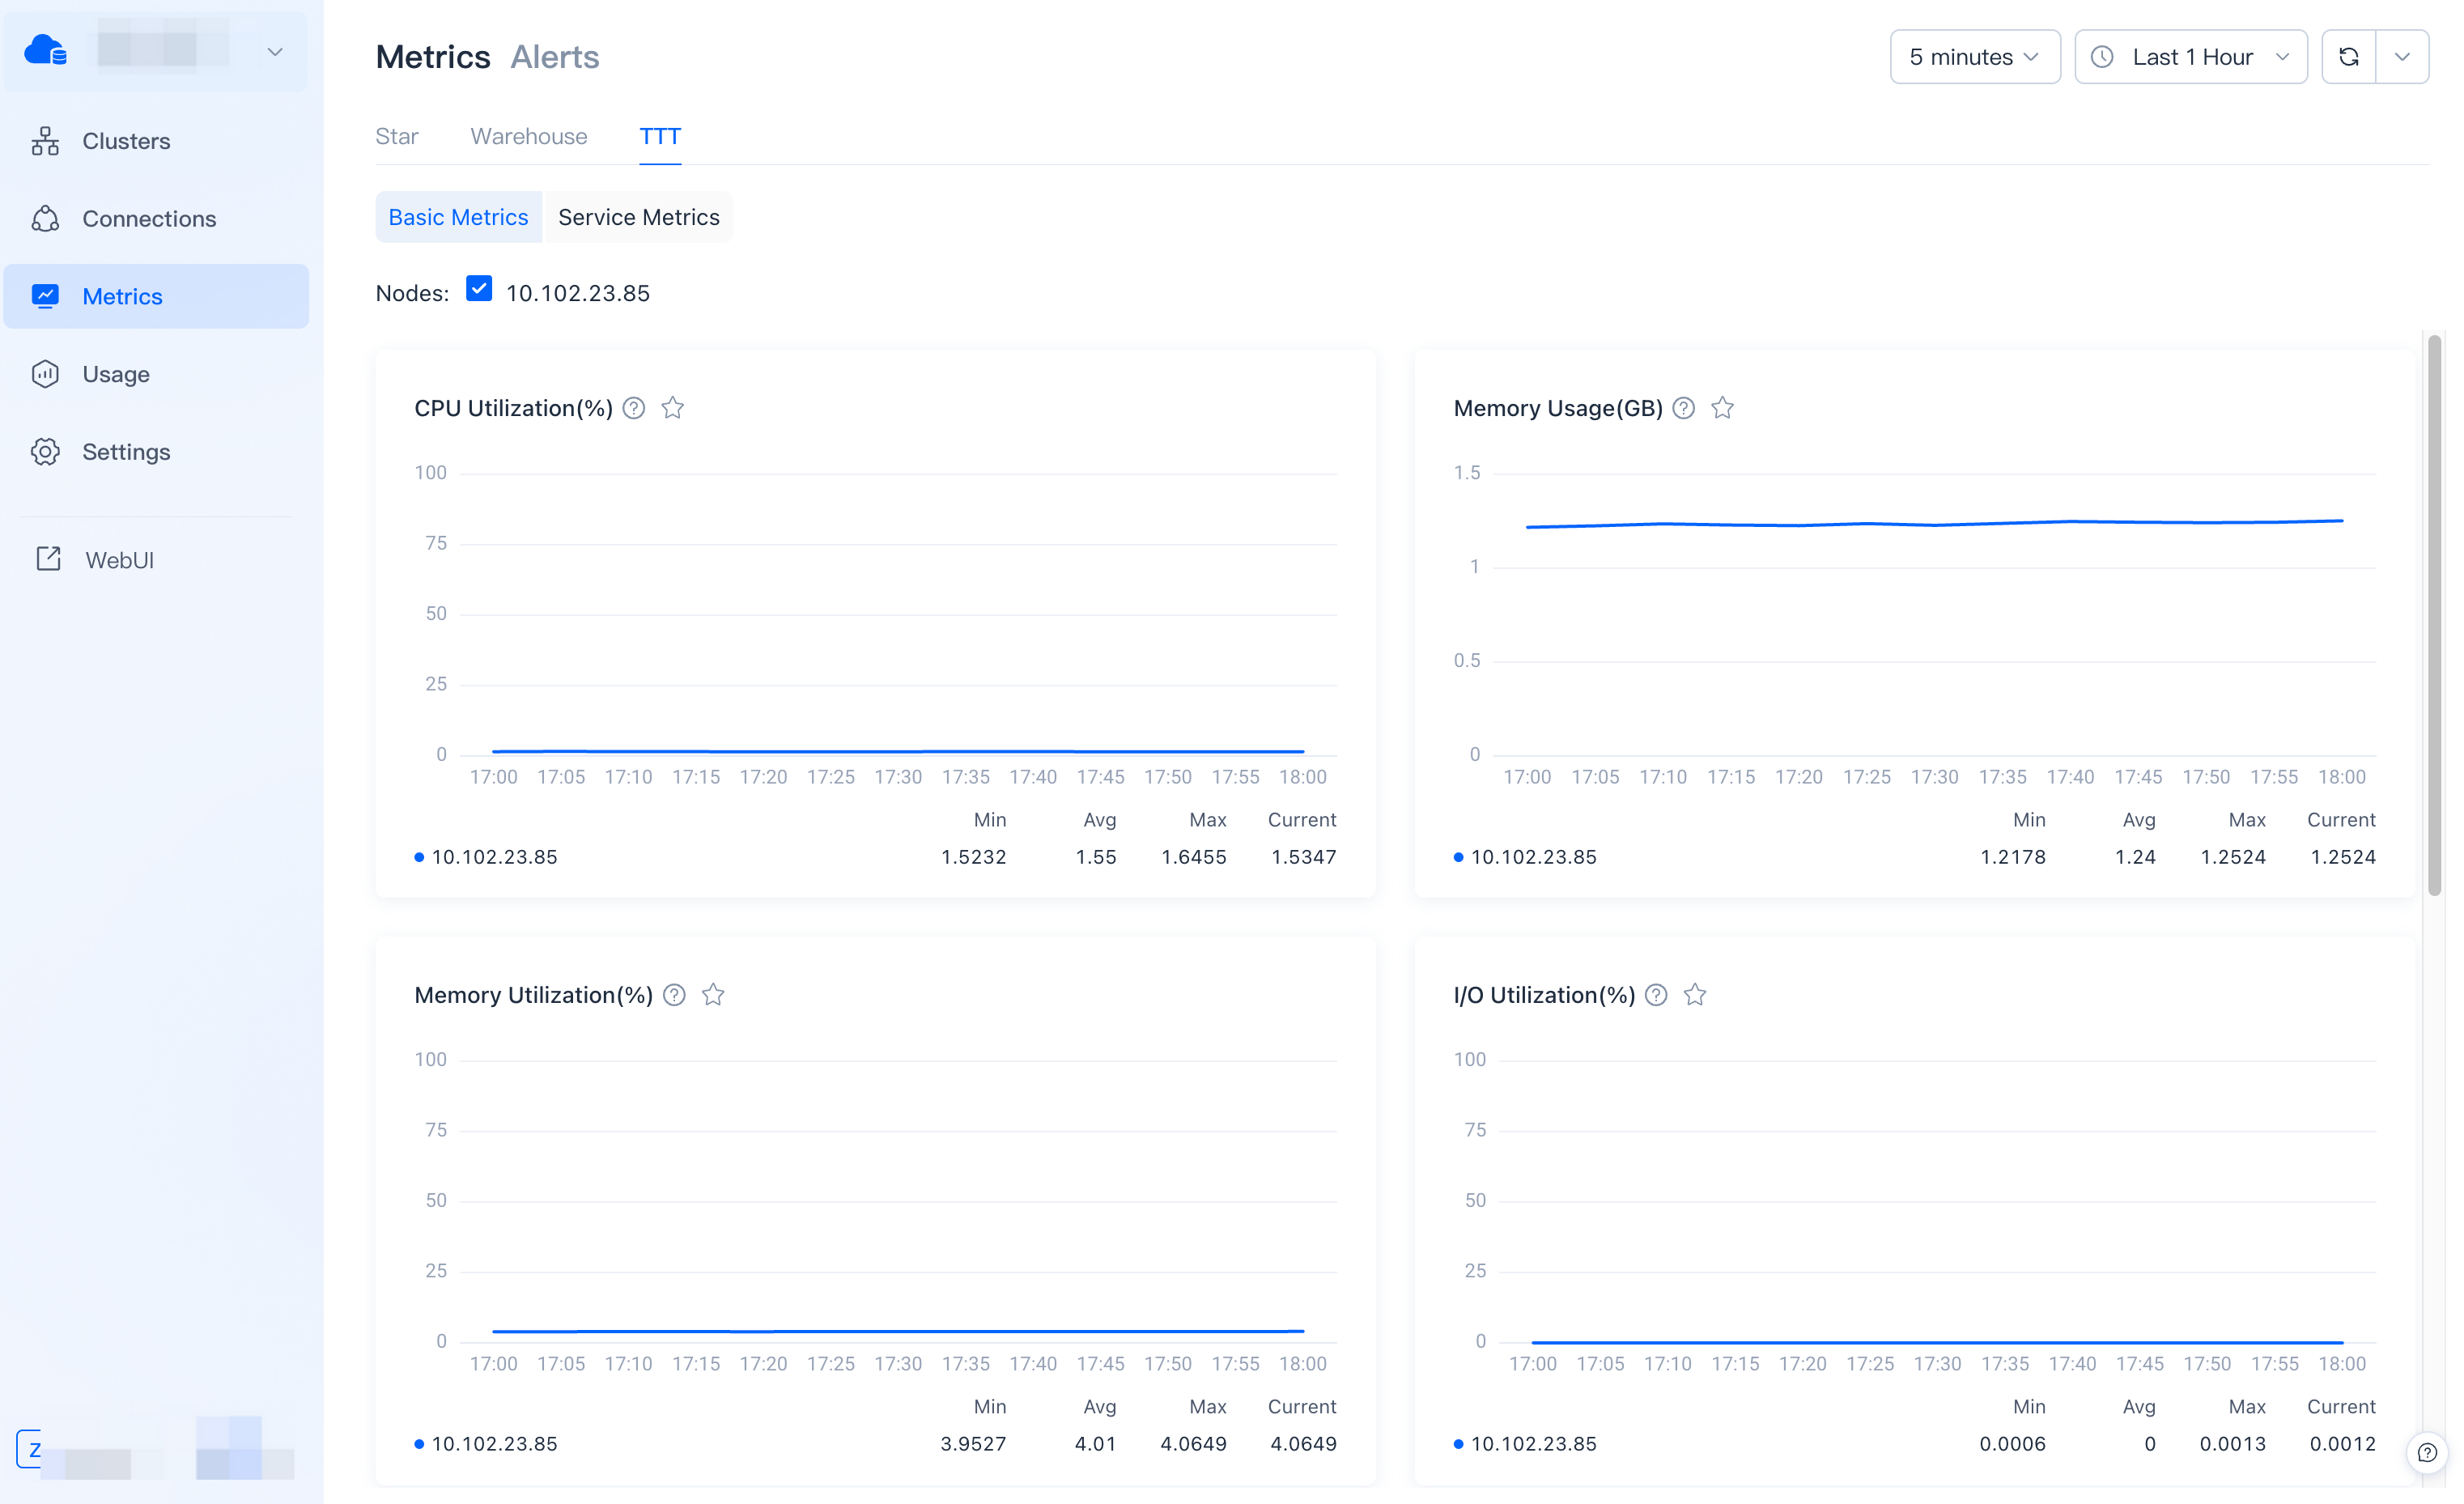
Basic metrics provide physical monitoring information of the cluster by "node" dimension.
You can determine whether the cluster is abnormal within a specified time frame by using the cluster's basic metrics. You can also see if historical or current queries are impacting cluster performance.
You can use the cluster basic metrics to diagnose the cause of slow queries and take possible measures such as scaling up or scaling down the cluster capacity, optimizing SQL statements, etc.
We provide the following cluster base metrics.
CPU Utilization
Displays the CPU utilization percentage of all nodes. You can find the lowest cluster utilization time from this chart before planning to scale a cluster and other resource-consuming operations.
Memory Usage
Displays the memory usage of all nodes. If memory usage is consistently high, you should consider scaling up your cluster.
Memory Utilization
Displays the memory utilization of all nodes. If memory utilization is consistently high, you should consider scaling up your cluster.
I/O Utilization
Displays the utilization of hard disk I/O. If I/O utilization is always maintained at a high level, you may consider scaling out more nodes for better query performance.
Network Outbound Throughput
Displays the average outbound speed of nodes per second over the network in MB/s. Queries that read data over the network are slower, and you should set up the cache correctly to minimize network reads.
Network Inbound Throughput
Displays the average inbound speed of nodes per second over the network in MB/s.
Cache Read Throughput
Displays the read throughput per second over the cache in MB/s.
Cache Write Throughput
Displays the write throughput per second over the cache in MB/s.
Support Range of Basic Metrics
| Metrics | Warehouse | Cluster |
|---|---|---|
| CPU Utilization | Supported | Supported |
| Memory Usage | Supported | Supported |
| Memory Utilization | Supported | Supported |
| I/O Utilization | Supported | Supported |
| Network Outbound Throughput | Supported | Supported |
| Network Inbound Throughput | Supported | Supported |
| Cache Read Throughput | Not supported | Supported |
| Cache Write Throughput | Not supported | Supported |
Service Metrics
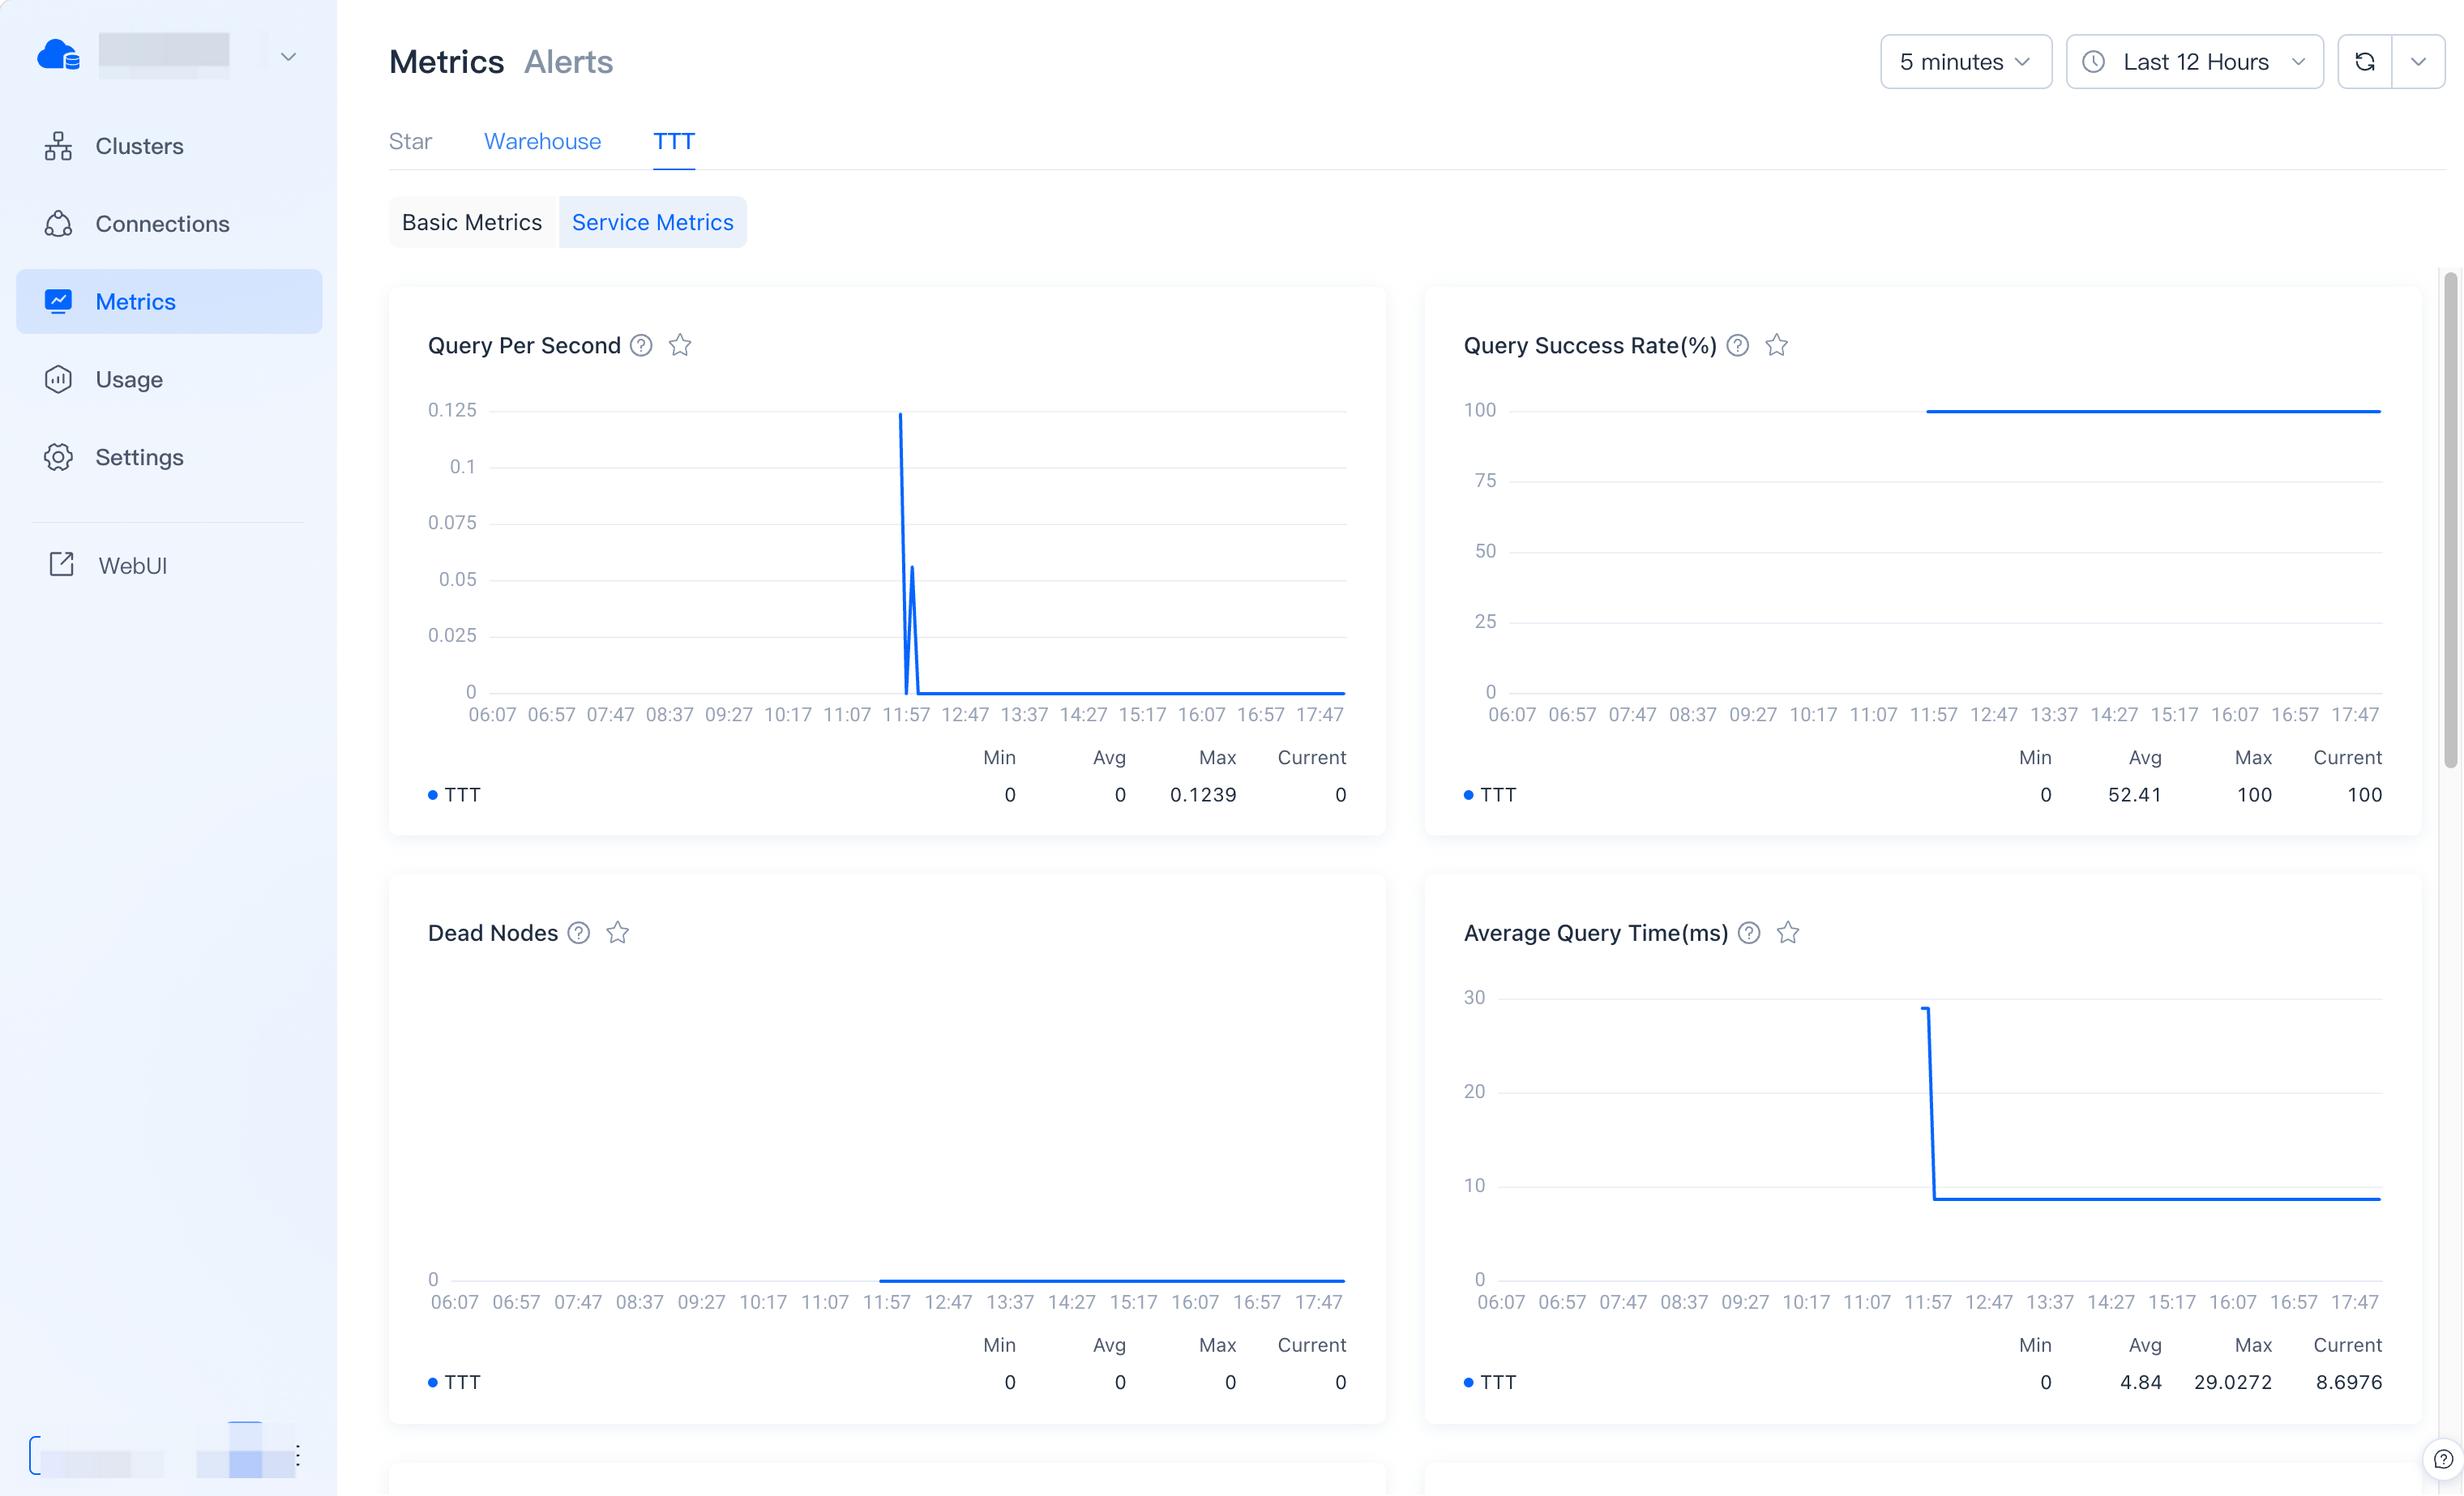
Query Per Second (QPS)
Displays the number of query requests per second. The required compute resource of a cluster can be determined based on your system's QPS during peak time.
Query Success Rate
Displays the percentage of successful queries to all queries updated by minutes. When the query success rate decreases abnormally, consider whether there is a cluster or node failure.
Dead Nodes
Displays the number of current cluster dead nodes.
Average Query Runtime
Displays the average time of queries updated by minutes. If the average query time rises abnormally, consider troubleshooting.
Query 99th Latency
Display the response time of the request that ranks at the 99th percentile in ascending order during a given time period, which reflects the speed of slow queries in the cluster.
Cache Hit Rate
Displays the percentage of I/O operations that hit the cache in all I/O operations. If the cache hit rate is too low, consider changing the cache policy or scaling up the space.
Remote Storage Read Throughput
Read the amount of data stored remotely per unit time.
Sessions
Display the number of sessions for the current warehouse, without distinguishing clusters.
Load Rows Per Second
A metric measuring the efficiency of data write operations, indicating the speed at which records are currently being successfully written to a database or other data storage systems.
Load Bytes Per Second
Display the current write task's rate, reflected by data size.
Finished Load Tasks
Display the number of tasks completed in the recent period. A sharp increase or decrease might indicate a business anomaly.
Compaction Score
Indicates the merging pressure of data files. The greater the Score, the greater the merging pressure.
Transaction Latency
Indicates the transaction latency of the warehouse write task. The smaller the delay, the faster the data can be queried.
Support Range of Service Metrics
| Metrics | Warehouse | Cluster |
|---|---|---|
| Query Per Second | Supported | Supported |
| Query Success Rate | Supported | Supported |
| Dead Nodes | Not supported | Supported |
| Average Query Time | Supported | Supported |
| Query 99th Latency | Supported | Supported |
| Cache Hit Rate | Not supported | Supported |
| Remote Storage Read Throughput | Not supported | Supported |
| Sessions | Supported | Not supported |
| Load Rows Per Second | Supported | Supported |
| Load Bytes Per Second | Supported | Supported |
| Finished Load Tasks | Supported | Not supported |
| Compaction Score | Not supported | Supported |
| Transaction Latency | Supported | Not supported |
Alert Overview
In addition to SMS alert notifications, VeloDB Cloud provides monitoring and alerting services at no additional charge.
You can configure alert rules to be notified when cluster monitoring metrics change.
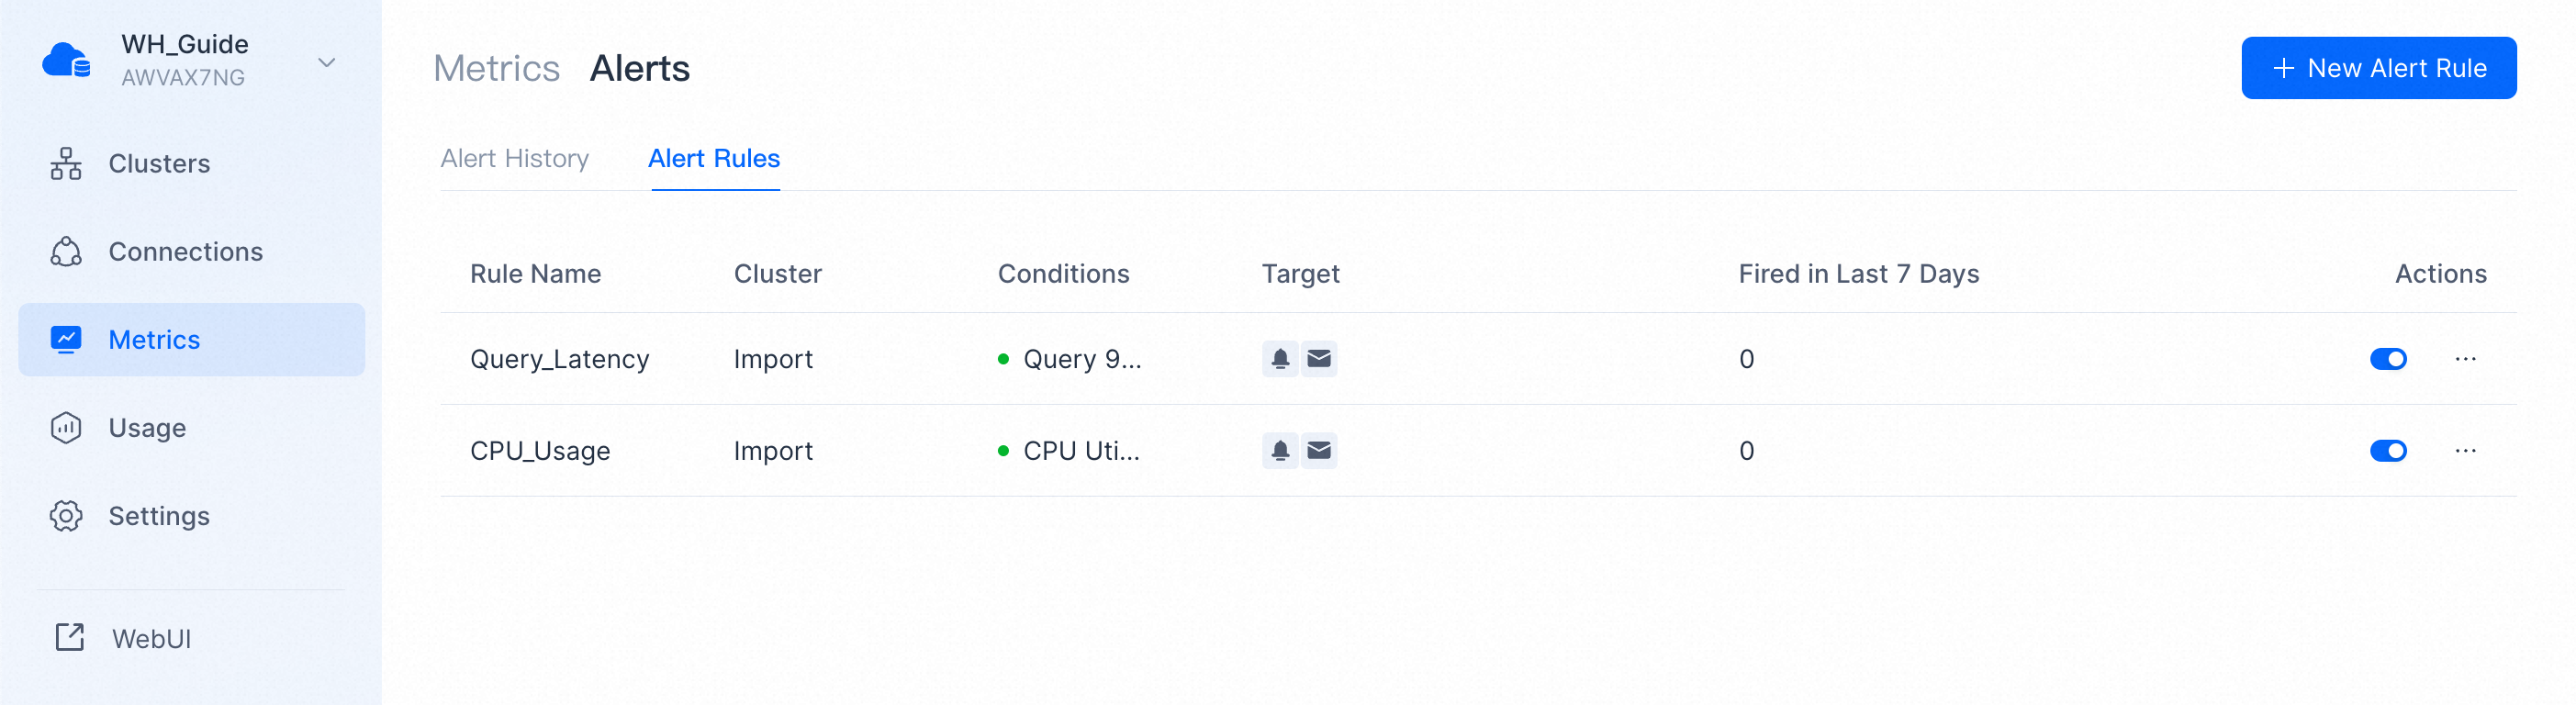
Alert Configuration
View Alert Rules
You can view existing alerting rules and their current alerting status on the list page.
"Red dot" means the alert rule is in effect, and "green dot" indicates the current alert rule is not triggered.
Enable One-Click Alert
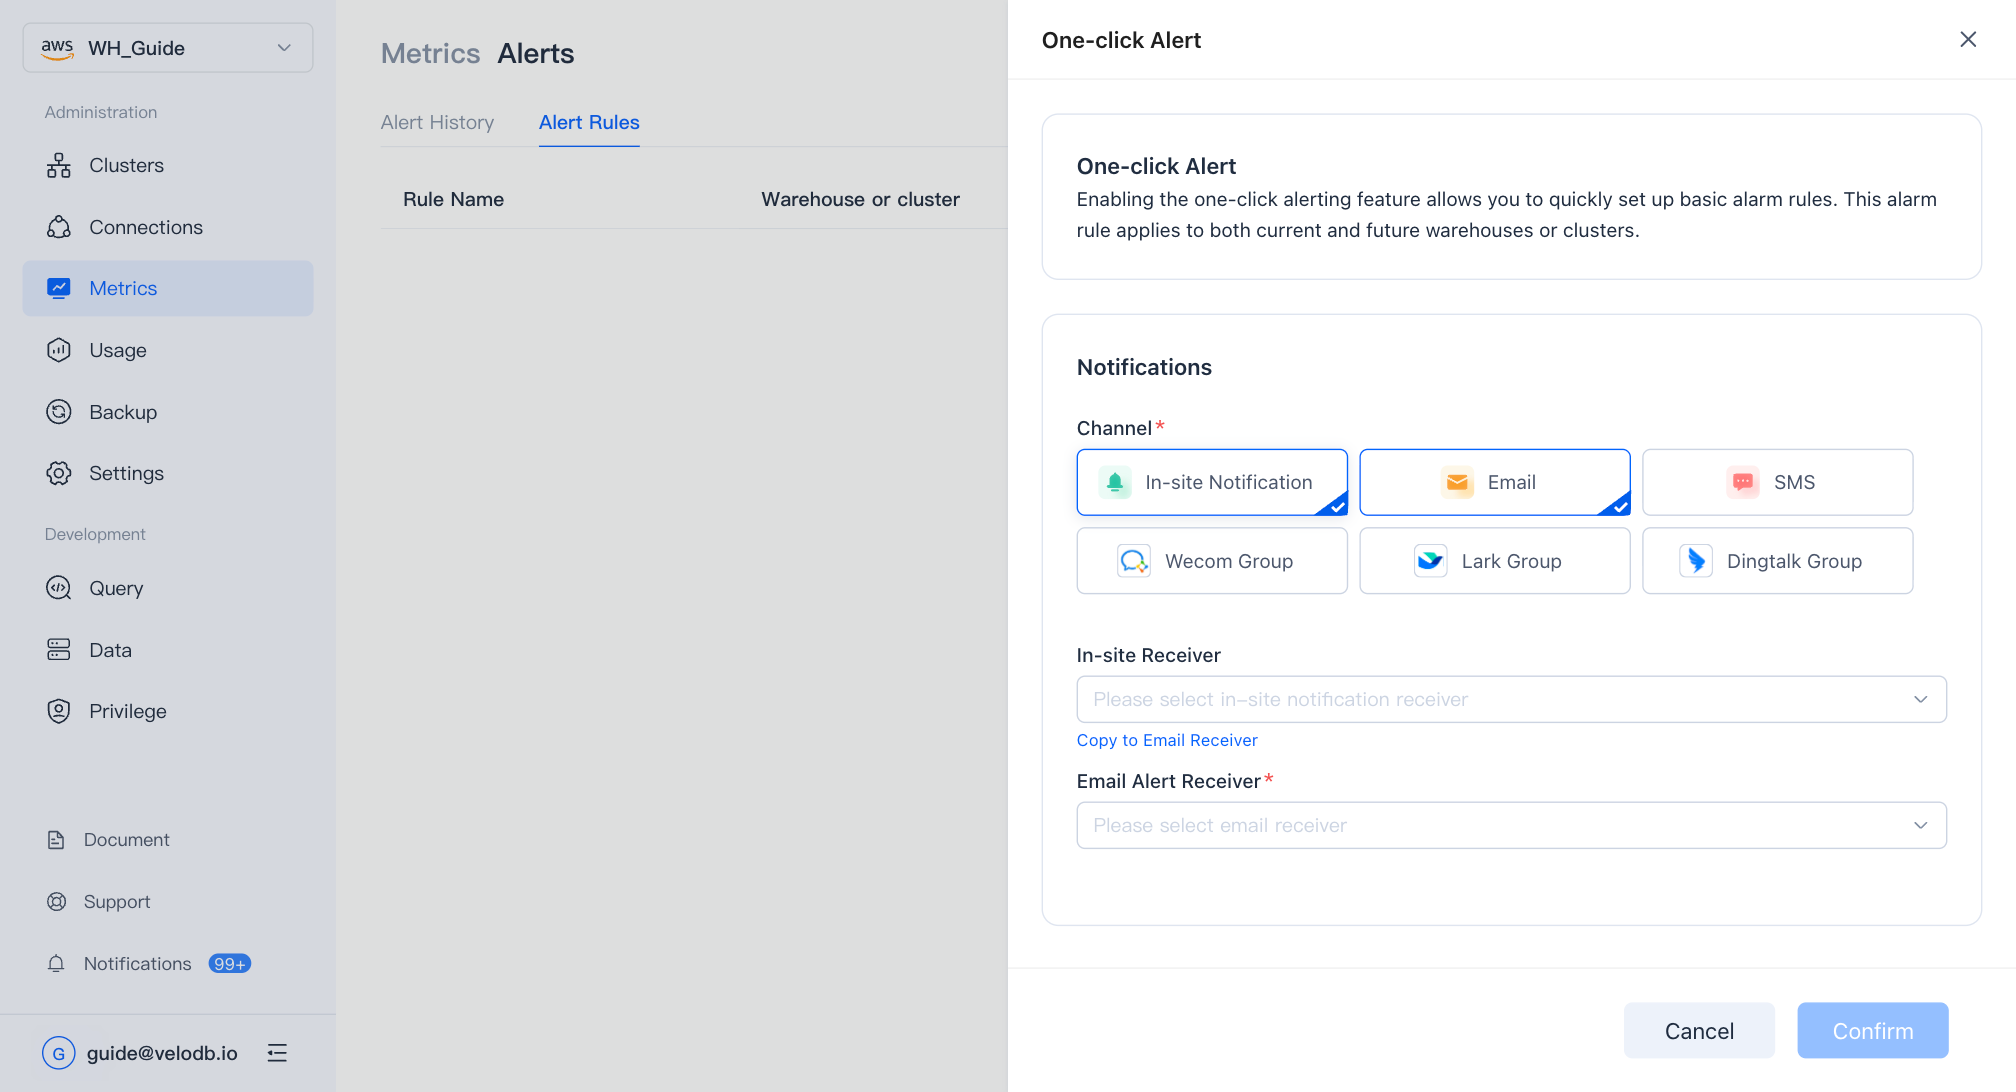
You can click Enable One-Click Alert to quickly set up basic alert rules, which will be applied to both current and future warehouses or clusters.
New/Edit Alert Rule
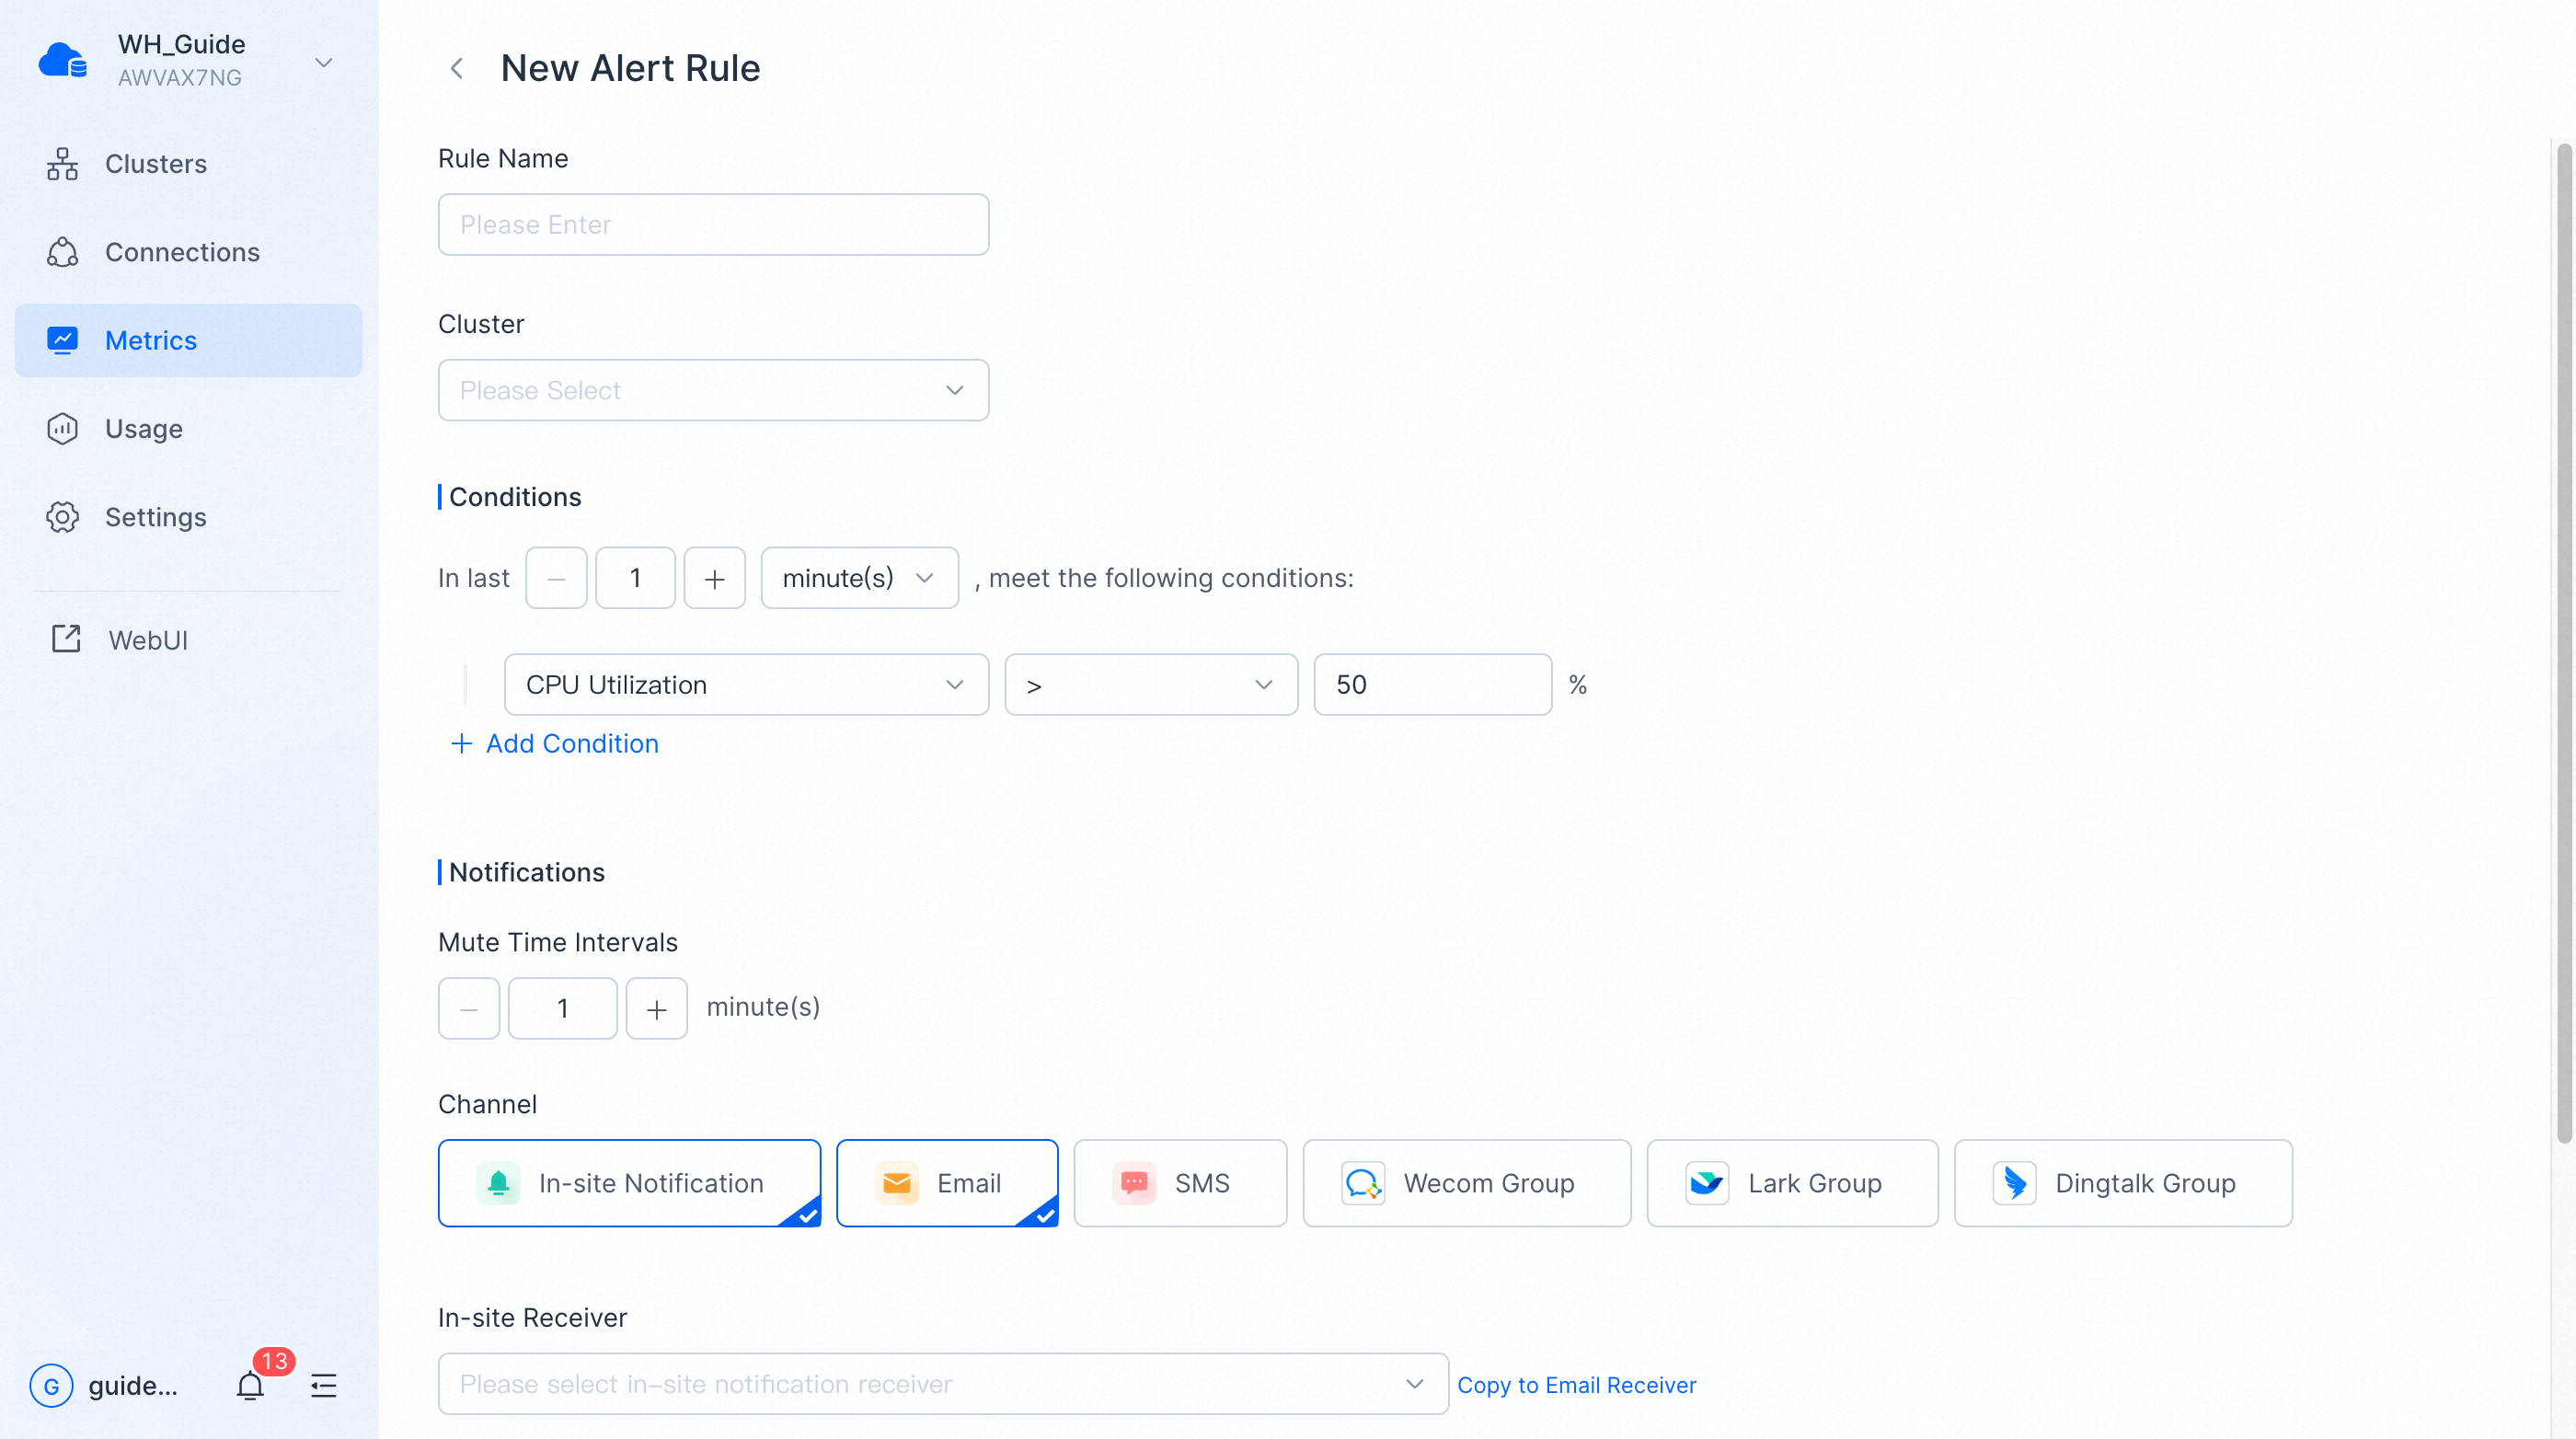
You can create an alert rule by clicking New Alert Rule or copying an existing one. You can also modify a current alert rule.
The alert rule configuration consists of four parts.
Rule Name
You can customize the rule name, which must be unique within the warehouse.
Cluster
You can specify the cluster for which the alert rule is in effect. When a cluster is deleted, its alert rules will not be deleted but invalidated.
Conditions
You can set one or more rules for metrics to be met and how these conditions are combined (and, or).
In Last
"In Last" means the duration of time to meet the conditions. You should set this time appropriately to balance between timeliness and accuracy of alerts.
Channel
You can set one or more notification channels, and the alert messages will be pushed through the channels you set respectively.
In-site Notification
Configuration method: Select user.
Email
Configuration method: Select user.
SMS
Configuration mode: Select user / fill in cell phone numbers.
WeCom
Configuration method: fill in the robot webhook.
- On WeCom for PC, find the target WeCom group for receiving alarm notifications.
- Right-click the WeCom group. In the window that appears, click Add Group Bot .
- In the window that appears, click Create a Bot .
- In the window that appears, enter a custom bot name and click Add .
- Copy the webhook URL.
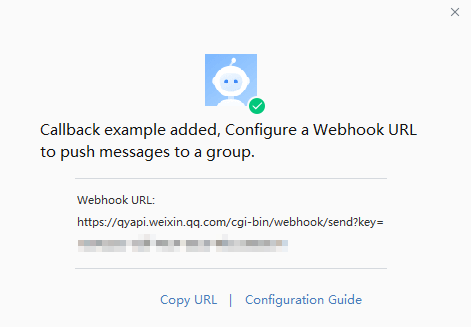
NOTE If you need to restrict message sources, please set up IP whitelist. VeloDB Cloud server IP address is 3.222.235.198.
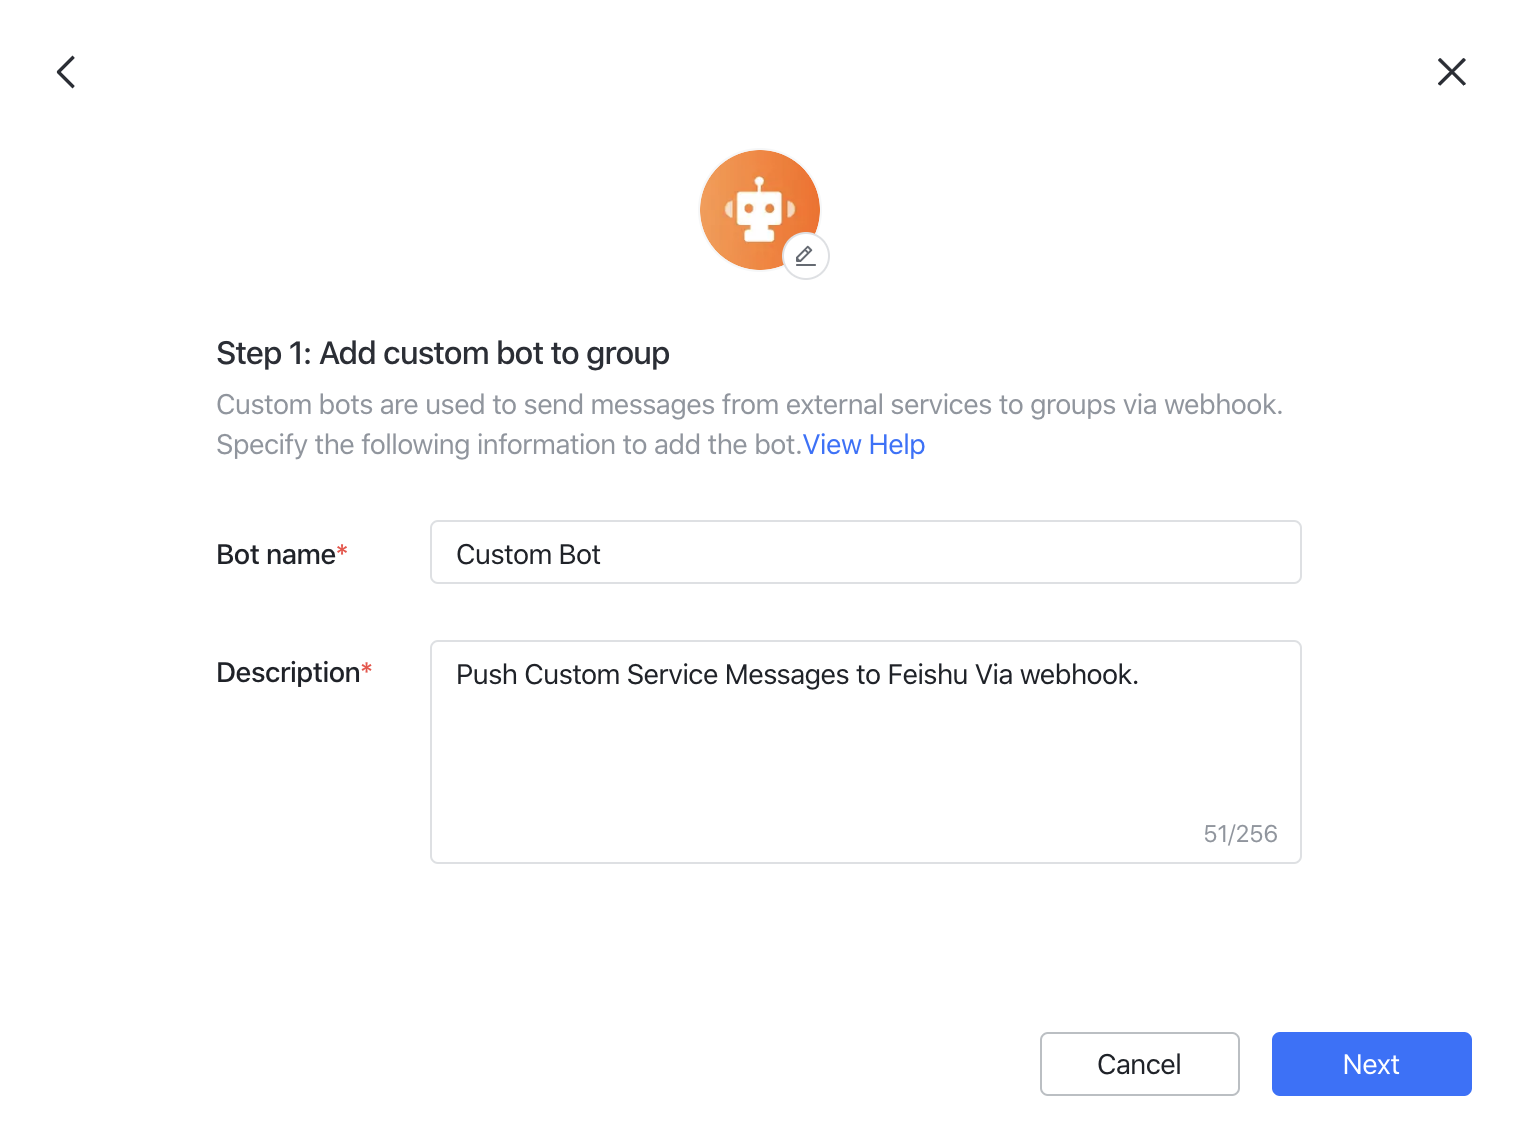
Lark
Configuration method: fill in the robot webhook.
To make a custom bot instantly push messages from an external system to the group chat, you need to use a webhook to connect the group chat and your external system. Enter your target group and click Settings > BOTs > Add Bot . Select Custom Bot . Enter a suitable name and description for your bot and click Next .
You'll then get the webhook URL.
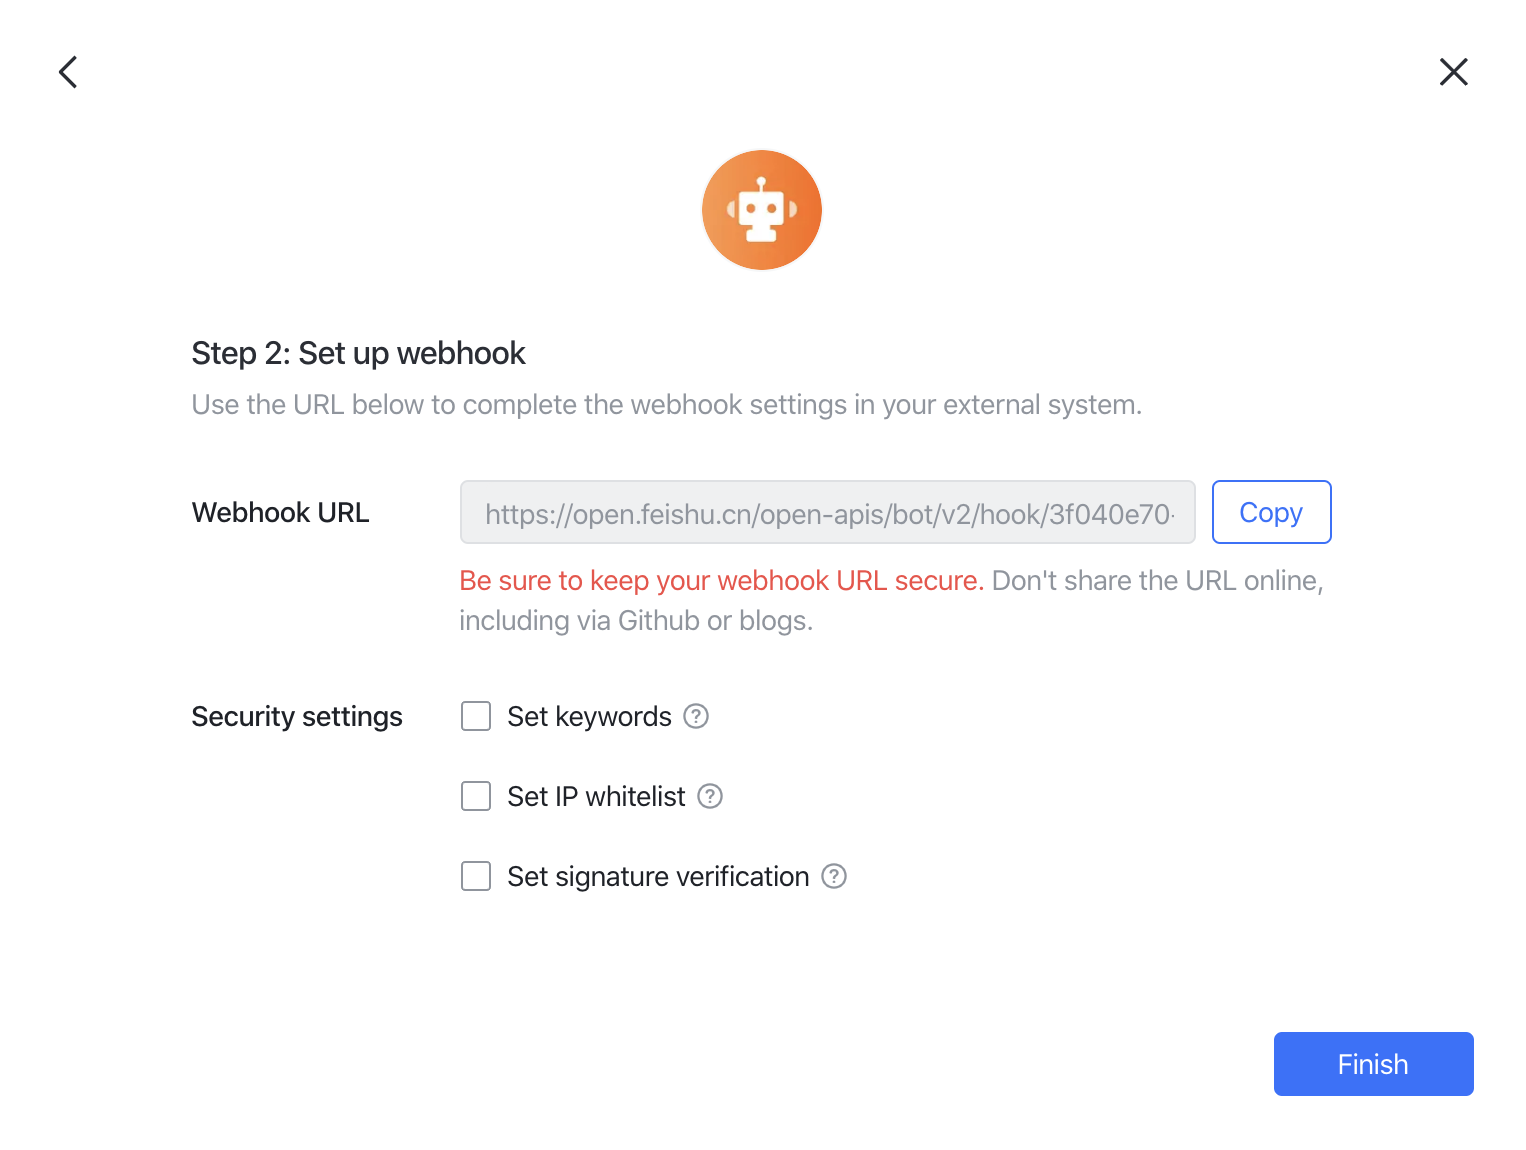
NOTE If you need to restrict message sources, please set up IP whitelist. VeloDB Cloud server IP address is 3.222.235.198.
DingTalk
Configuration method: fill in the robot webhook.
To get the DingTalk robot webhook, please see here
- Run the DingTalk client on a PC, go to the DingTalk group to which you want to add a chatbot, and then click the Group Settings icon in the upper-right corner.
- In the Group Settings panel, click Group Assistant .
- In the Group Assistant panel, click Add Robot .
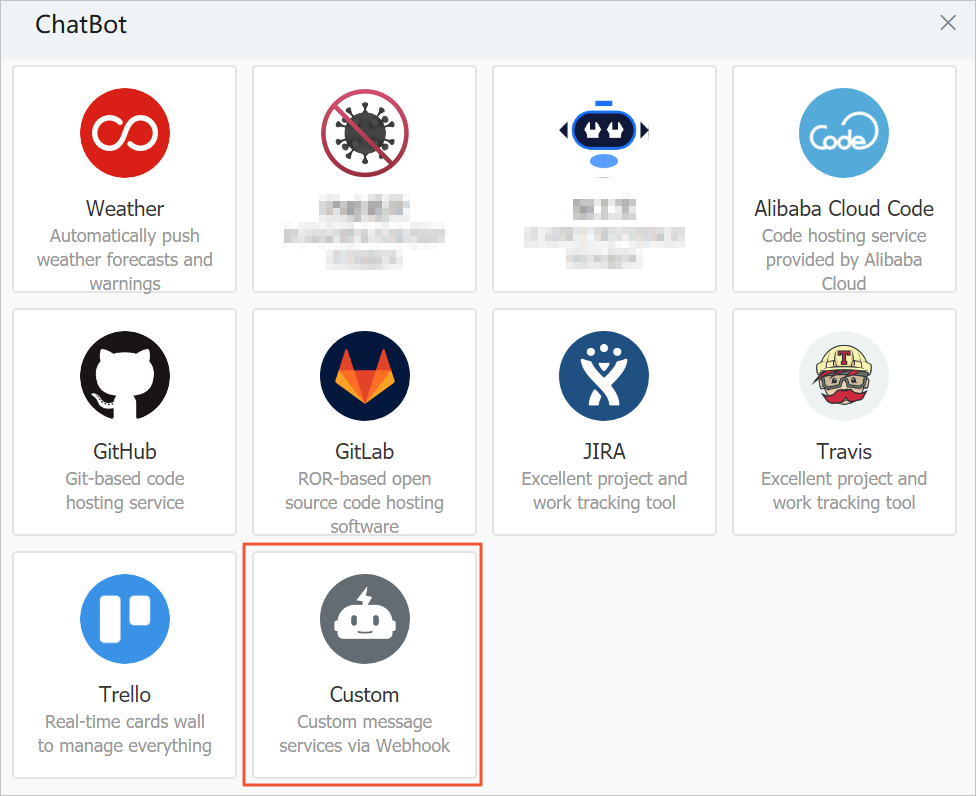
- In the ChatBot dialog box, click the + icon in the Add Robot section. Then, click Custom .
- In the Robot details dialog box, click Add .
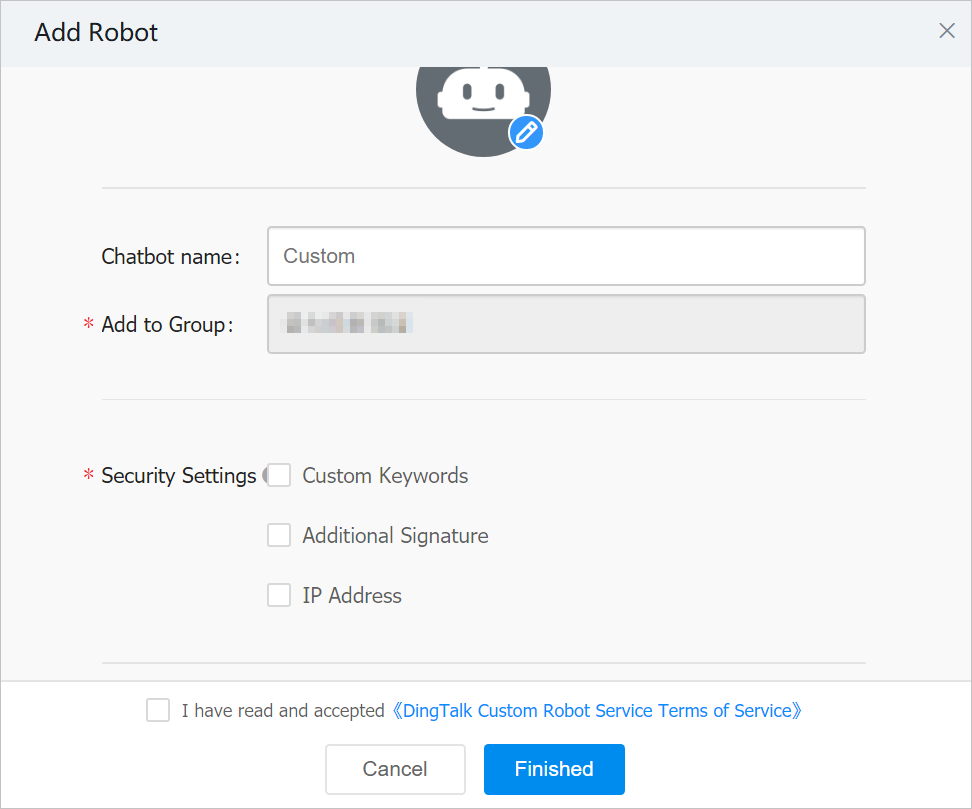
- In the Add Robot dialog box, perform the following steps:
NOTE If you need to restrict message sources, please set up IP whitelist. VeloDB Cloud server IP address is 3.222.235.198.
- Set a profile picture and a name for the chatbot.
- Select Custom Keywords for the Security Settings parameter. Then, enter alert .
- Read the terms of service and select I have read and accepted DingTalk Custom Robot Service Terms of Service .
- Click Finished .
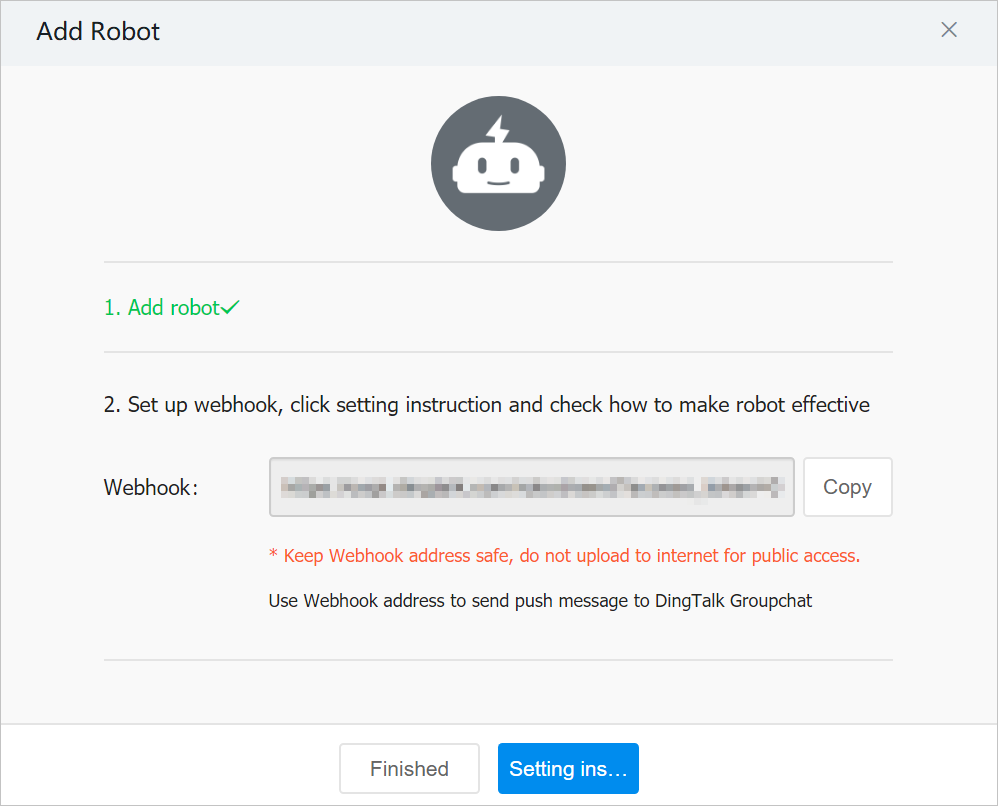
- In the Add Robot dialog box, copy the webhook address of the DingTalk chatbot and click Finished .
View Alert History
You can view the alert history and filter it.