Cluster Inspection
Manager includes a built-in cluster inspection feature that collects cluster/operating system information, checks data quality, and analyzes SQL performance.
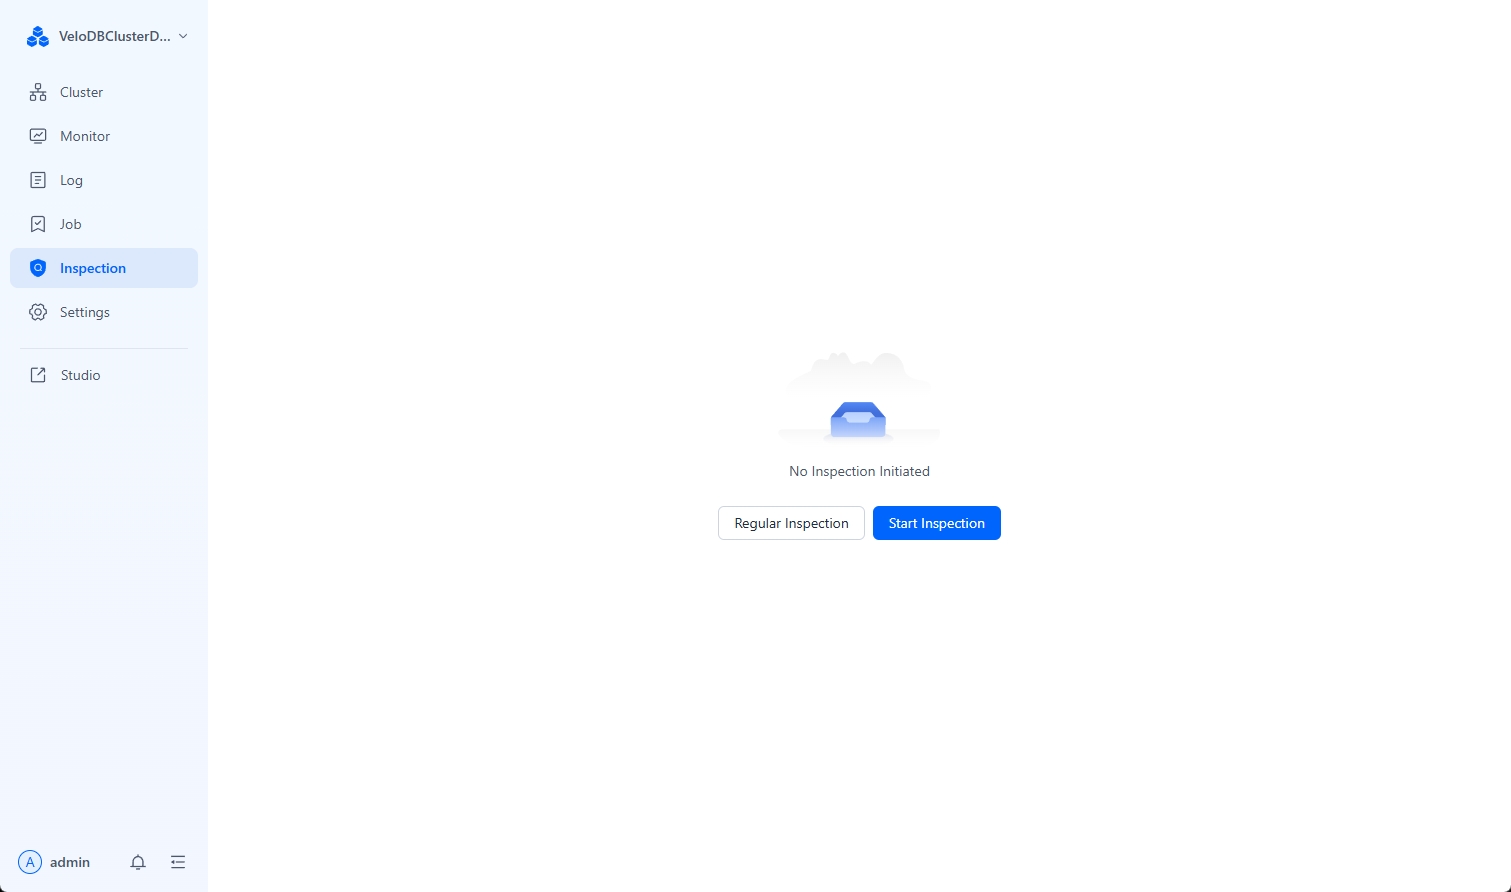
Start Cluster Inspection
Navigate to the Inspection menu in the navigation bar and click Inspect Now to perform a cluster inspection.
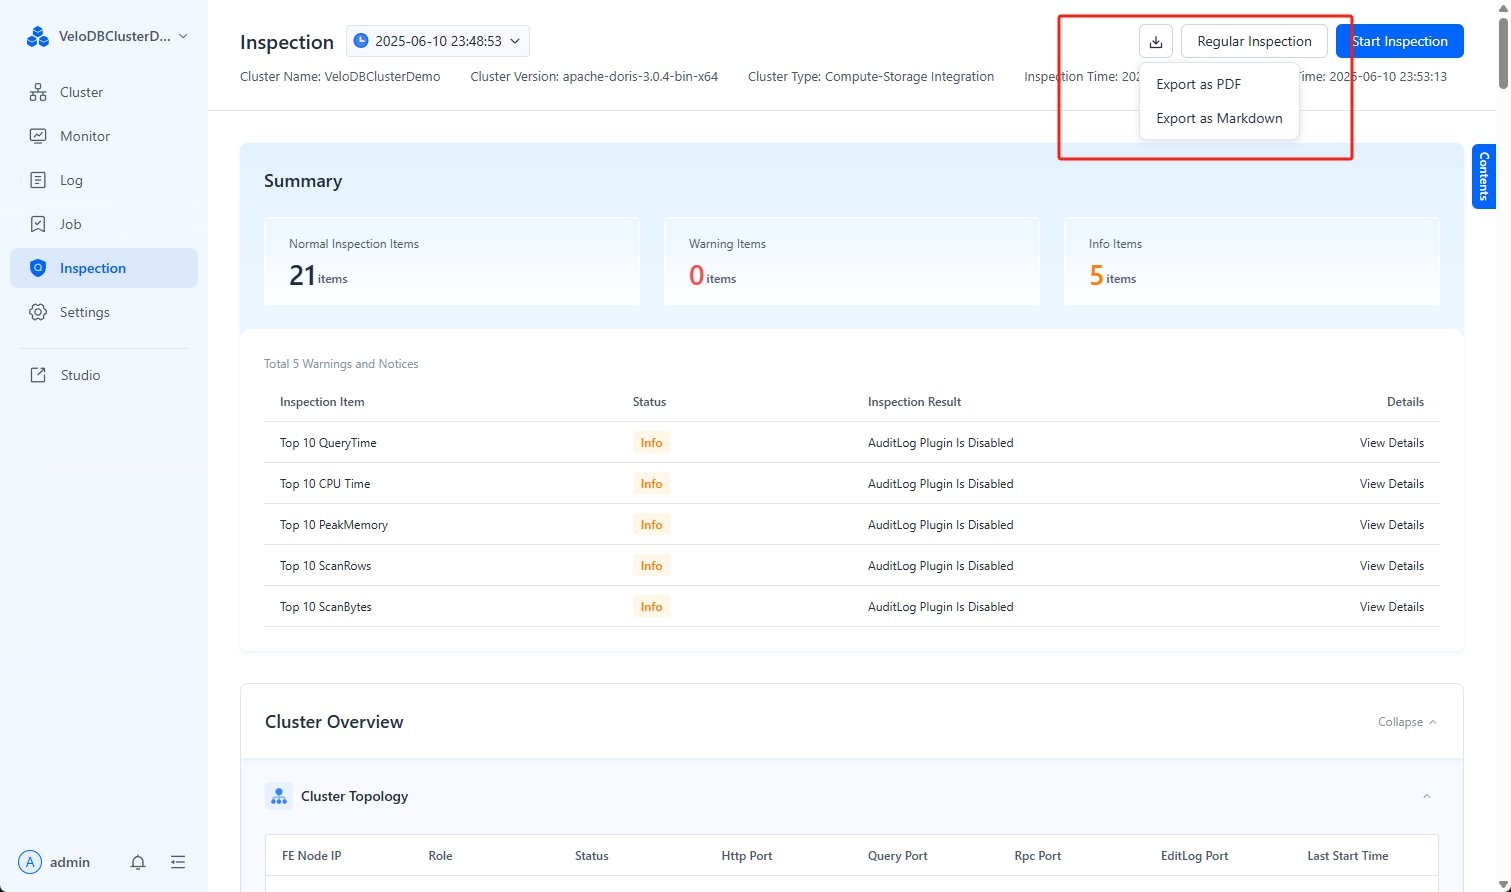
Inspection anomaly statuses are categorized into three types:
- Execution Failed: The execution did not return a successful result, potentially due to permissions, machine environment settings, or cluster availability.
- Warning: This status indicates inspection items that might significantly impact the healthy operation of the cluster. Click View Suggestions to learn how to fix them.
- Tip: This status indicates inspection items that might have some impact or pose potential risks to the healthy operation of the cluster. Click View Suggestions to learn how to fix them.
Additionally, you can Export the inspection report as a PDF or Markdown file to your local machine.
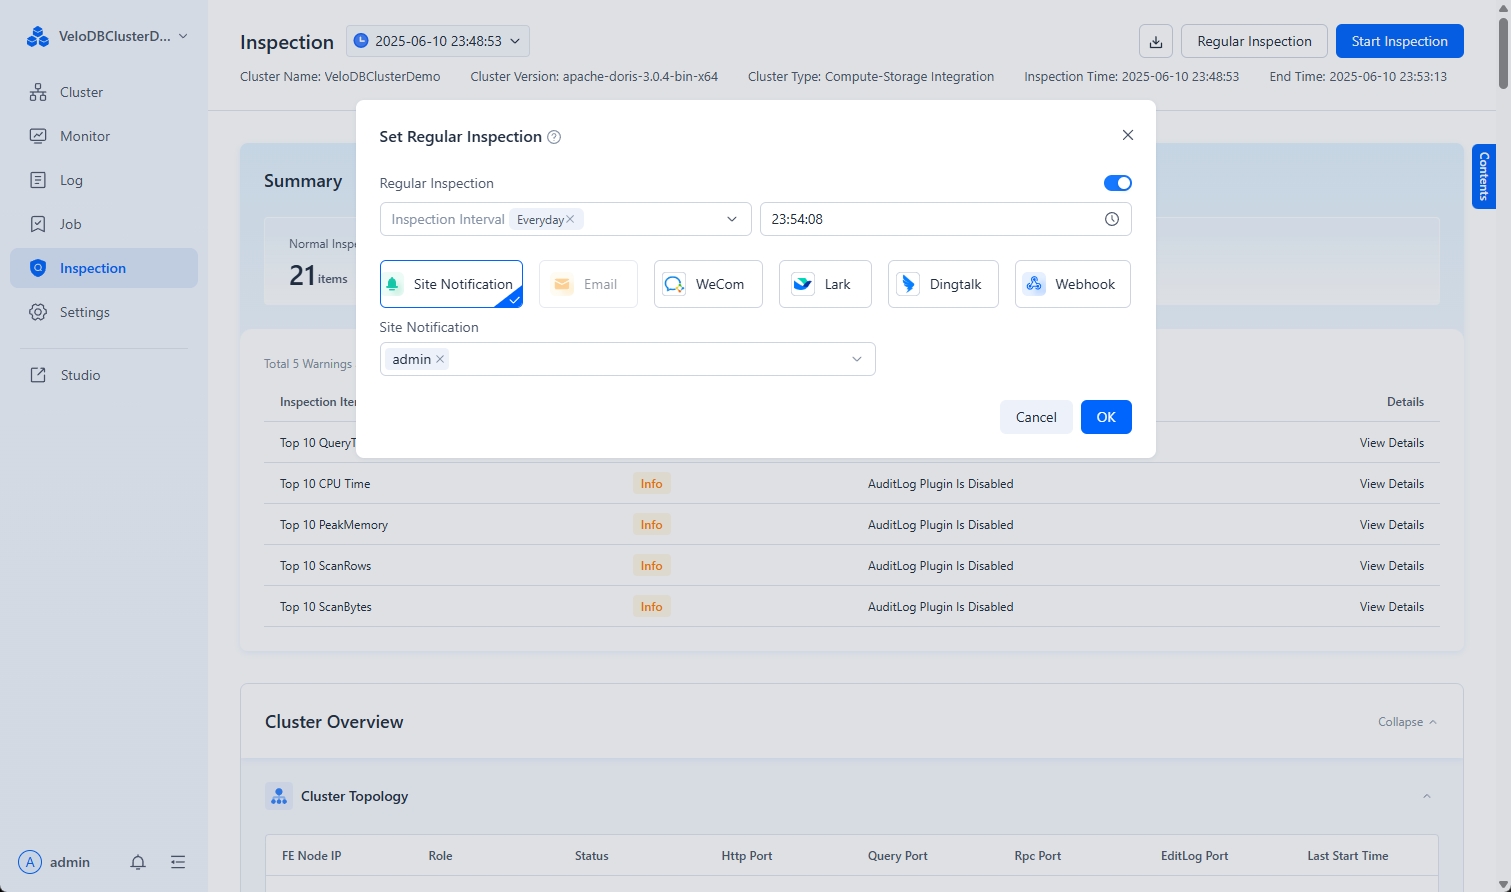
Enable Scheduled Inspection
The inspection feature supports scheduled inspections, allowing you to configure the inspection frequency and notification settings as needed.
Add Custom Inspections
Manager supports extending inspection item functionality through custom scripts.
-
Modify the
user-defined-tasks.jsonscriptAdd script extensions for inspection items in the
webserver/inspection/script/user-defined-tasks.jsonfile.For example, the following shows the addition of two custom inspection items:
CheckBadTabletandCheckSwapOff:{
"tasks": [
{
"name": "CheckBadTablet",
"source": "DORIS",
"reason": "ensure tablets are all healthy.",
"script": "CheckBadTablet.sh",
"timeout": 600,
"enabled": false
},
{
"name": "CheckSwapOff",
"source": "AGENT",
"reason": "doris be requires swap off.",
"script": "CheckSwapOff.sh",
"timeout": 600,
"enabled": true
}
]
}The parameters are described below:
Parameter Meaning nameInspection name, which will be displayed in the inspection report. sourceCan be either DORISorAGENT.scriptInspection script name. Ensure the script is located in the webserver/inspection/script/directory.timeoutScript execution timeout in seconds. enabledWhether the script is enabled. truemeans the inspection item is active. -
Modify Custom Inspection Scripts
When creating custom scripts, the user running Manager must have execution permissions for the script. You can refer to the
agent_demo.shanddoris_demo.shscript templates:agent_demo.sh: AnAGENTtype script that executes shell commands on each agent machine.doris_demo.sh: ADORIStype script that sends SQL commands to the Doris cluster.
-
Run Inspection and View Results
After adding custom inspection items, click the Inspect Now button. You can then view the results of your custom inspections at the end of the inspection report.