Doris Cluster Monitoring
Manager integrates Prometheus, Grafana, and AlertManager, allowing you to view and manage cluster monitoring directly within Manager.
View Cluster Monitoring
Manager provides a rich set of predefined monitoring metrics to help you understand the real-time operational status of your cluster.
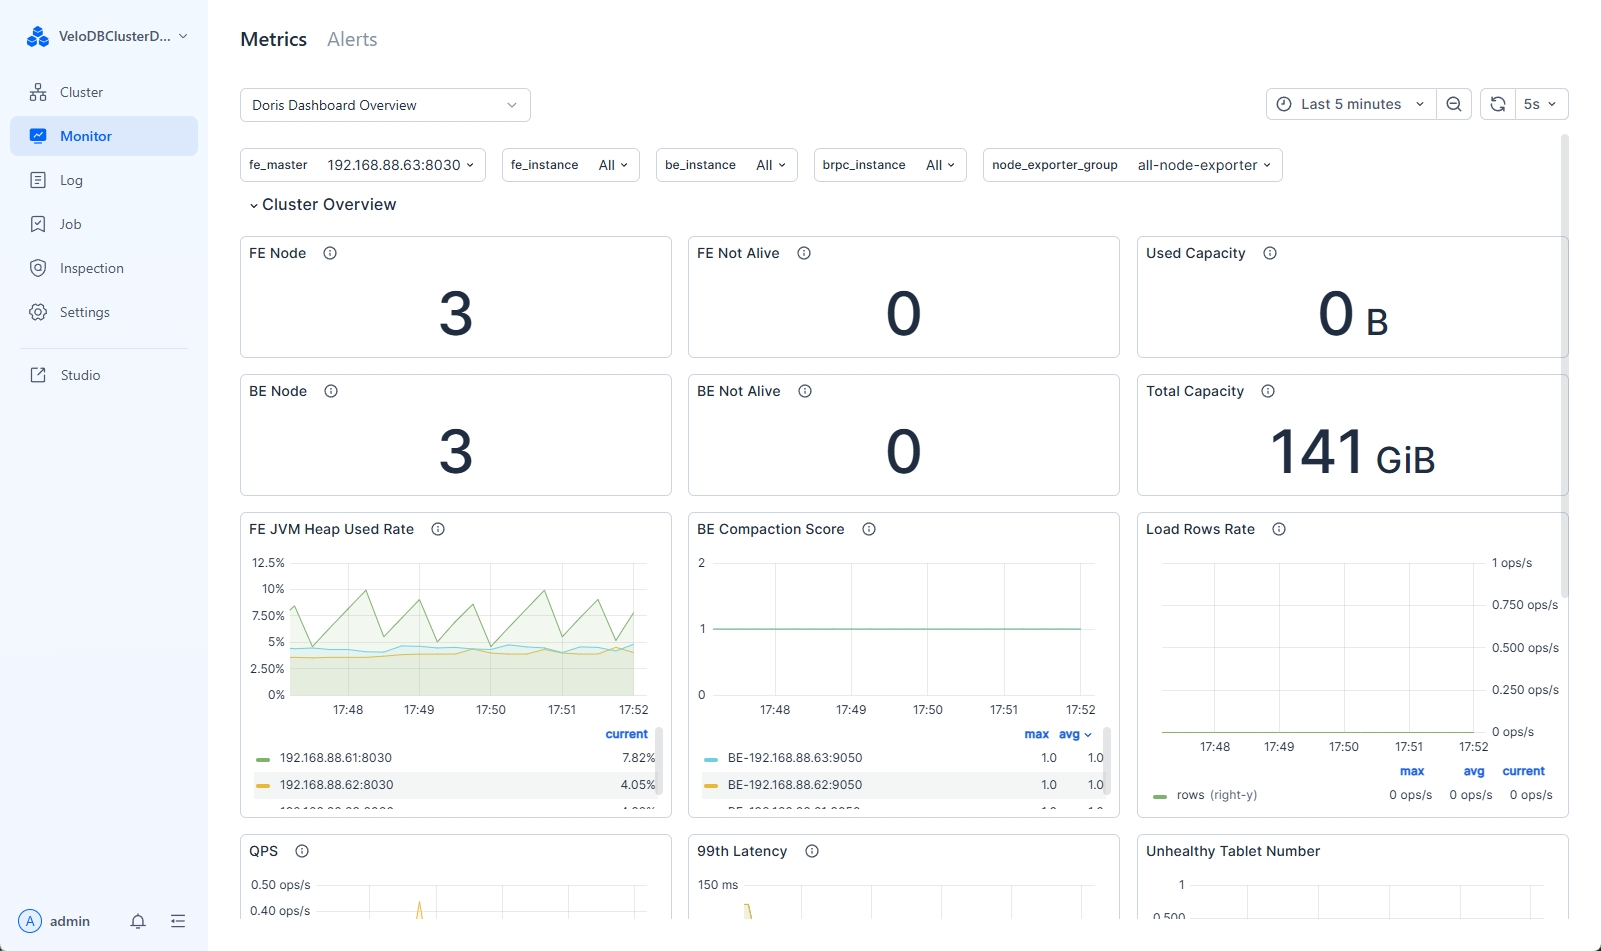
Descriptions of the monitoring metrics are as follows:
| Category | Metric Name | Metric Description |
|---|---|---|
| Cluster Overview | FE Node | Total number of FE nodes in the cluster |
| FE Not Alive | Number of offline FE nodes in the cluster | |
| Used Capacity | Used space of BEs in the cluster | |
| BE Node | Total number of BE nodes in the cluster | |
| BE Not Alive | Number of offline BE nodes in the cluster | |
| Total Capacity | Total available storage space of BEs in the cluster | |
| FE JVM Heap Use Rate | JVM heap usage rate of FEs in the cluster | |
| BE Compaction Score | Compaction score of each BE | |
| Load Rows Rate | Data import status within a unit of time | |
| QPS | QPS status of different FEs | |
| 99th Latency | 99th percentile query latency of different FEs | |
| Host Monitor | CPU Used Rate | CPU usage rate of the node |
| Mem Usage | Memory usage size of the node | |
| Mem Used Rate | Memory usage rate of the node | |
| I/O Util | Disk I/O utilization within a unit of time | |
| Disk Used Rate | Percentage of disk space used | |
| Disk Write Throughput | Disk write throughput | |
| Disk Read Throughput | Disk read throughput | |
| Network Outbound Traffic | Outbound traffic of the gateway | |
| Network Inbound Traffic | Inbound traffic of the gateway | |
| Query Statistic | RPS | Requests per second for different FEs within a unit of time |
| QPS | QPS of different FEs | |
| 99th Latency | 99th percentile query latency | |
| Query Percentile | Query latency (at different percentiles) | |
| Query Error [1m] | Query failure rate within 1 minute | |
| Connections | Number of connections for each FE | |
| Jobs | Broker Load Job | Status distribution of Broker load tasks |
| Insert Load Job | Status distribution of Insert tasks | |
| Routine Load Job | Status distribution of Routine load tasks | |
| Spark Load Job | Status distribution of Spark load tasks | |
| Broker Load Tendency | Broker load task status trend | |
| Insert Load Tendency | Insert task status trend | |
| Routine Load Tendency | Routine load task status trend | |
| Spark Load Tendency | Spark load task status trend | |
| SC Job | Number of running schema change tasks | |
| Report Queue Size | Report Queue Size of the master node | |
| Rollup Job | Number of running rollup tasks | |
| Transactions | Txn Begin/Success on FE | Total number of transactions initiated and successful transactions on FE |
| Txn Failed/Reject on FE | Failed and rejected rates of BE transactions within a unit of time | |
| Publish Task on BE | Total number of publish tasks on BE | |
| Txn Status on FE | Number of transactions in different states | |
| Txn Load Bytes/Rows rate | Rows and size of data imported within a unit of time | |
| FE | Max Replayed Journal ID | Journal ID of FE |
| Edit Log Size | Edit log size of FE | |
| Image Write | Number of image writes on FE | |
| Image Push | Number of image pushes on FE | |
| Image Counter | Number of image writes and pushes on FE | |
| Image Clean | Success and failure status of FE image cleanup | |
| Edit log Clean | Success and failure status of FE edit log cleanup | |
| BDBJE Write | 99th percentile write latency of BDBJE | |
| BDBJE Read | Reads of BDBJE within a unit of time | |
| JVM Heap | JVM heap usage of FE | |
| Scheduling Tablets | Number of tablets to be scheduled during data balancing or recovery | |
| JVM Old GC | Old GC | |
| JVM Young GC | Young GC | |
| JVM Old | JVM old size | |
| JVM Young | JVM young size | |
| FE Collect Compaction Score | Compaction score of each BE collected by FE | |
| JVM Non Heap | JVM non-heap usage of FE | |
| JVM Threads | Number of JVM threads | |
| BE | Disk Usage | Disk space usage rate of BE |
| BE FD Count | FD usage on BE | |
| BE Thread Num | Thread distribution on BE | |
| Tablet Meta Read | Metadata read status of BE within a unit of time | |
| Tablet Meta Write | Metadata write status of BE within a unit of time | |
| Tablet Distribution | Tablet distribution on BE | |
| BE Compaction Base | Rate of base compaction tasks performed by BE within a unit of time | |
| BE Compaction Cumulate | Rate of cumulative compaction tasks performed by BE within a unit of time | |
| BE Push Bytes | Size of push_request_write data on BE within a unit of time | |
| BE Push Rows | Number of rows for push_request_write on BE within a unit of time | |
| BE Scan Bytes | Size of scanned data by BE within a unit of time | |
| BE Scan Rows | Number of scanned rows by BE within a unit of time | |
| BE Tasks | Finish Task Report | Total number of tasks completed on each BE |
| Push Task | Number of successfully executed push tasks on each BE | |
| Push Task Cost Time | Time cost of executing push tasks on each BE | |
| Delete | Total number of delete tasks executed on BE | |
| Base Compaction | Total number of base_compaction tasks executed on BE | |
| Cumulative Compaction | Total number of cumulative_compaction tasks executed on BE | |
| Clone | Total number of clone tasks executed on BE | |
| Create Rollup | Total number of create_rollup tasks executed on BE | |
| Schema Change | Total number of schema_change tasks executed on BE | |
| Create Tablet | Total number of create_tablet tasks executed on BE |
Create New Monitoring Dashboard
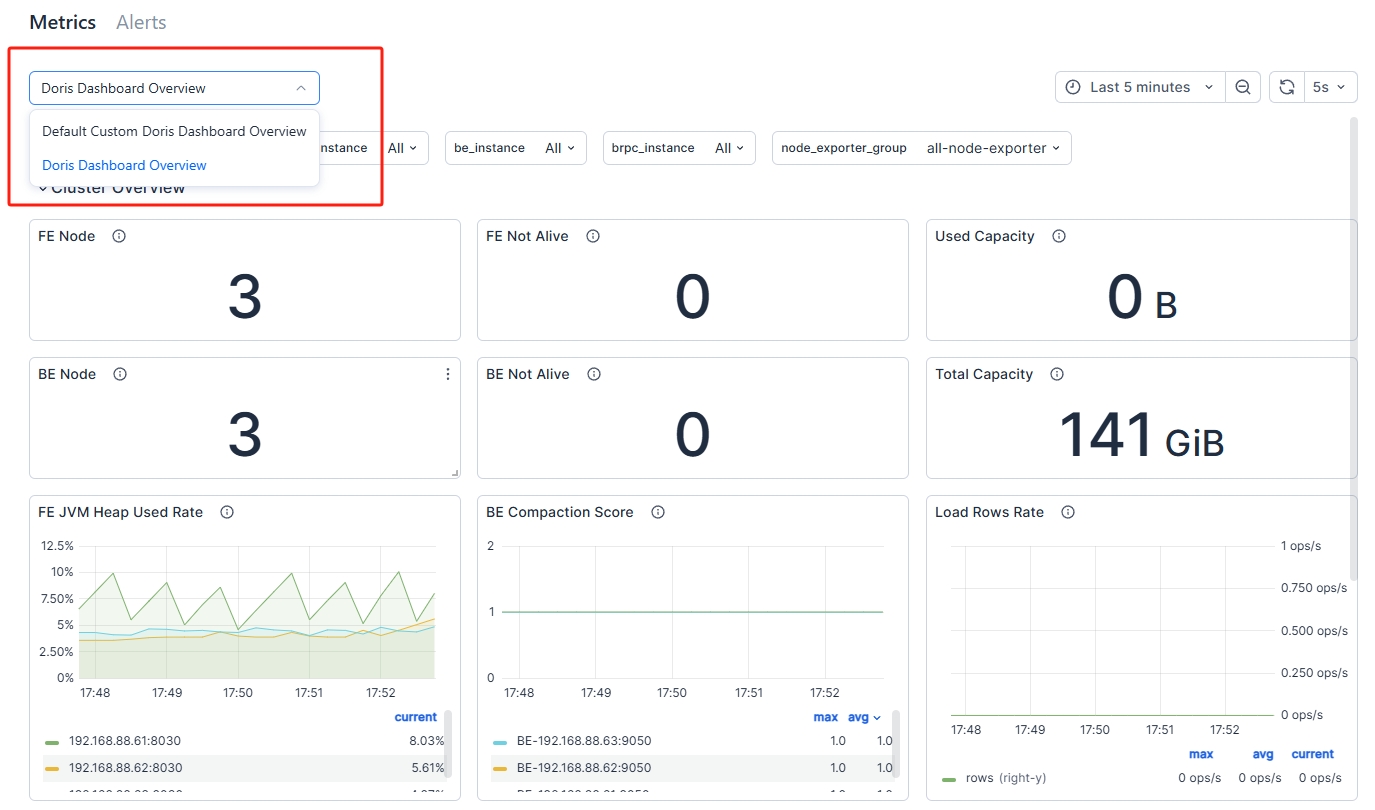
There are two monitoring dashboards in Manager:
-
Doris Dashboard Overview: A predefined Doris monitoring dashboard that provides basic Doris and host monitoring items, which cannot be modified.
-
Default Custom Doris Dashboard Overview: A user-defined monitoring dashboard that can be modified.
When creating a new dashboard, you can modify the Default Custom Doris Dashboard Overview panel to add custom dashboards.
-
Select the "Default Custom Doris Dashboard Overview" Dashboard
In the top-left corner of the monitoring page, select the "Default Custom Doris Dashboard Overview" panel:
-
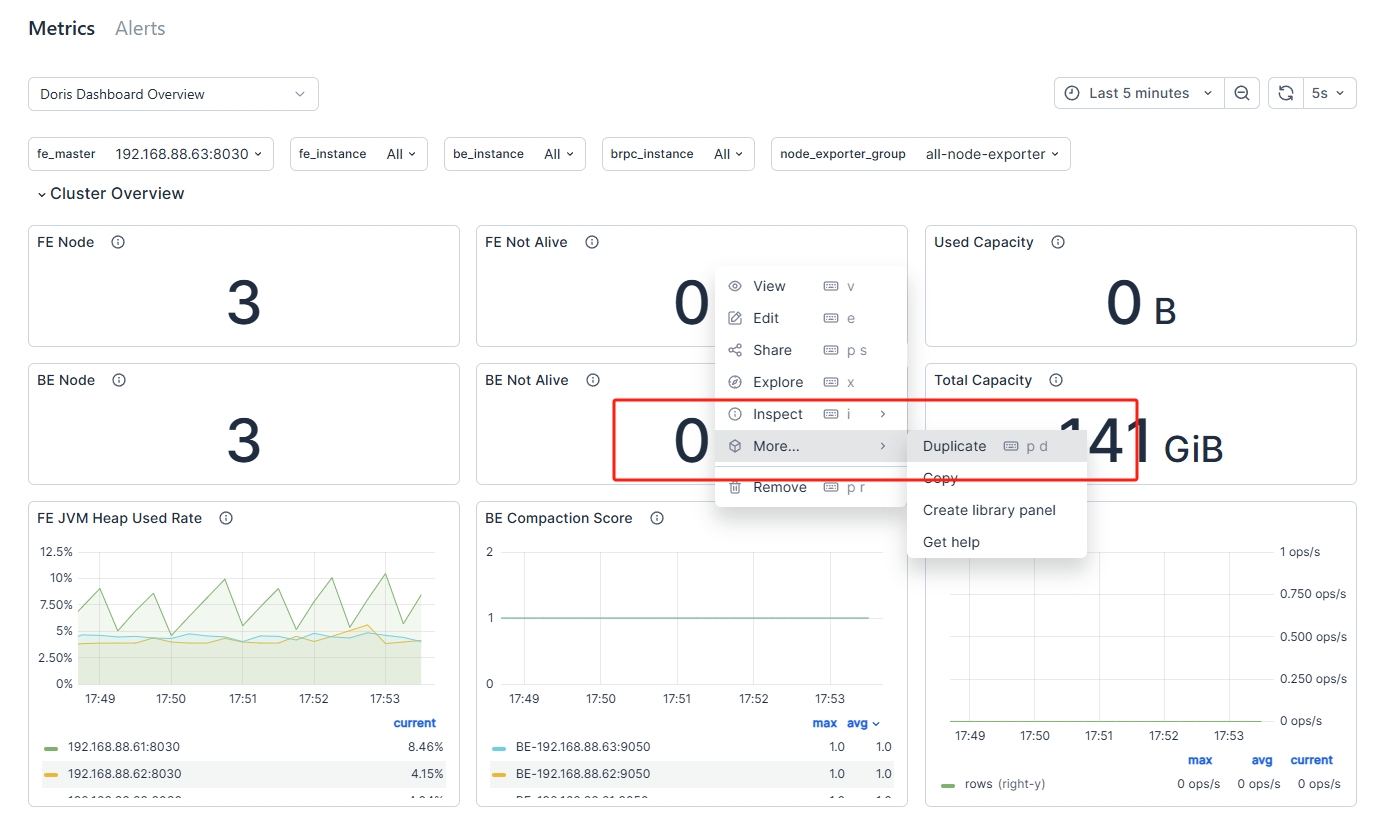
Duplicate a New Dashboard
Duplicate a new panel. You can drag and drop it into any module:
-
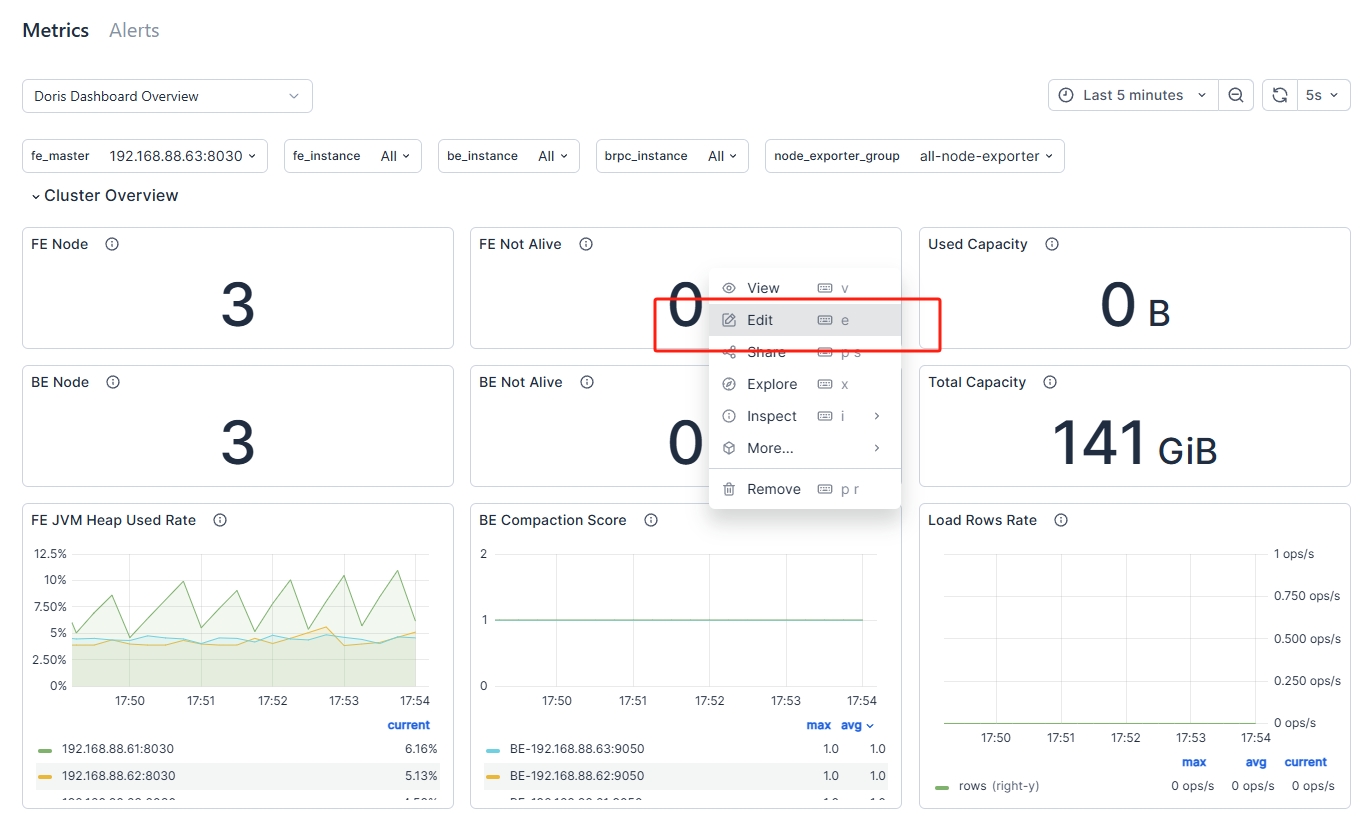
Edit the Duplicated Panel
Edit the panel. Refer to edit panel for rules.
Manage Cluster Monitoring
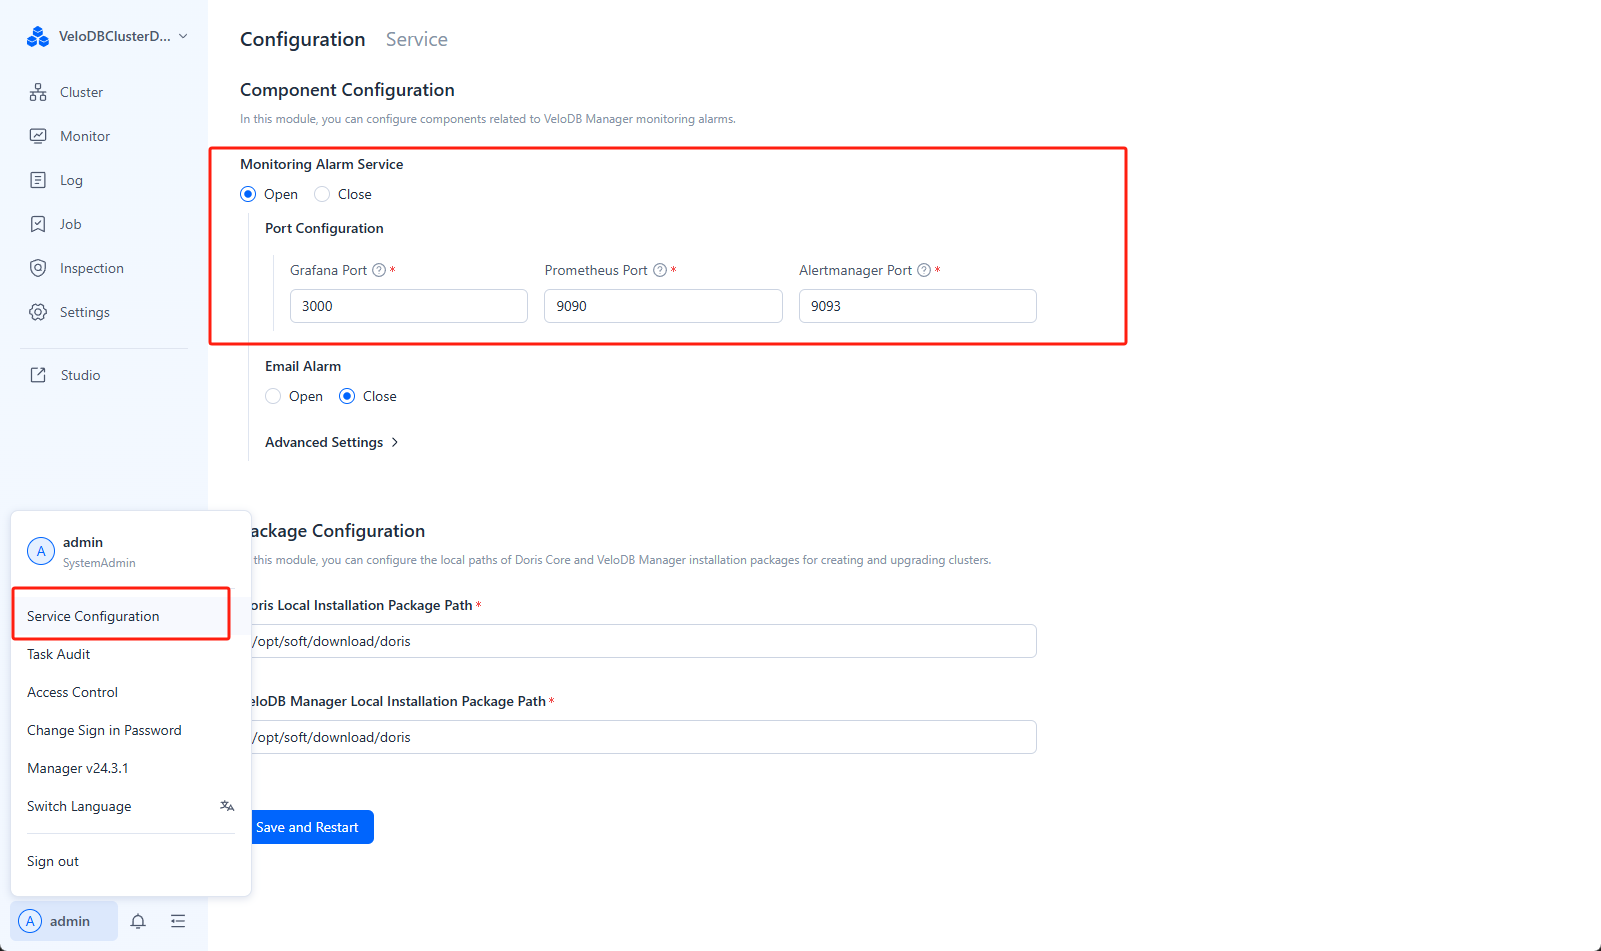
Enable/Disable Cluster Monitoring
In the user configuration, select "Service Configuration" to enable or disable monitoring and alerting services.
Enable/Disable Monitoring Authentication
Starting from Manager v24.0.3, authentication for monitoring components is enabled by default. You can set accounts and passwords for Prometheus, AlertManager, and Grafana separately. In the webserver/conf/manager.conf file, you can modify the following configurations:
| Configuration | Type | Description |
|---|---|---|
| MONITOR_AUTH_ENABLE | BOOLEAN | Enable or disable monitoring authentication, default is TRUE. |
| GRAFANA_USER | STRING | Grafana username, currently only supports the 'admin' user. |
| GRAFANA_PASS | STRING | Grafana password. If not configured separately, a random password will be set. |
| PROMETHEUS_USER | STRING | Prometheus username, defaults to the 'admin' user. |
| PROMETHEUS_PASS | STRING | Prometheus password. If not configured separately, a random password will be set. |
| ALERTMANAGER_USER | STRING | AlertManager username, defaults to 'admin'. |
| ALERTMANAGER_PASS | STRING | AlertManager password. If not configured separately, a random password will be set. |